
Binance Algotrade is an algorithmic trading set of tools using technical analysis for live cryptocurrencies trading on the Binance platform. It also contains several tools for market analysis and backtesting.
Cryptocurrencies are highly volatile products, use this software for educational prupose only as you will certainly lose money. THE AUTHORS AND CONTRIBUTORS TO THIS PROJECT ARE NOT RESPONSIBLE FOR ANY TRADING RESULTS.
The author of this software is not affiliated with Binance.
git clone git@github.com:allister633/binance-algotrade.git
cd binance-algotrade
git checkout develop
pip install -r requirements.txtAnalyse.py is a graphical static market analysis tool that allows to visualise the closing prices of a pair with different indicators. It also displays buy and sell signals of available strategies. The goal is to visualise and spot different trends to develop or adjust an automated trading strategy for live usage.
This tool relies on Plotly for data visualisation. It can be installed using pip command :
pip install plotlyAnalyse.py uses data stored in CSV file generated by klines.py. Klines.py retrieves open-high-low-close data for a pair with a given interval at a given date. Let's get last prices for Bitcoin compared to Thether with a 15m interval for January 2020 :
python klines.py --start 2020-01-01T00:00:00 --end 2020-01-31T00:00:00 --interval 15m BTCUSDTThis will generate a BTCUSDT_20200101-000000_20200131-000000_15m.csv file in the data folder.
Now let's visualise this prices with two exponential moving averages of 9 and 21 periods, and a simple strategy that buys currency when the 9 EMA crosses the 21 EMA from below.
python analyse.py data/BTCUSDT_20200101-000000_20200131-000000_15m.csv --ema 9 21 --strategy 1 9 21This should open a tab in your navigator with the graph.
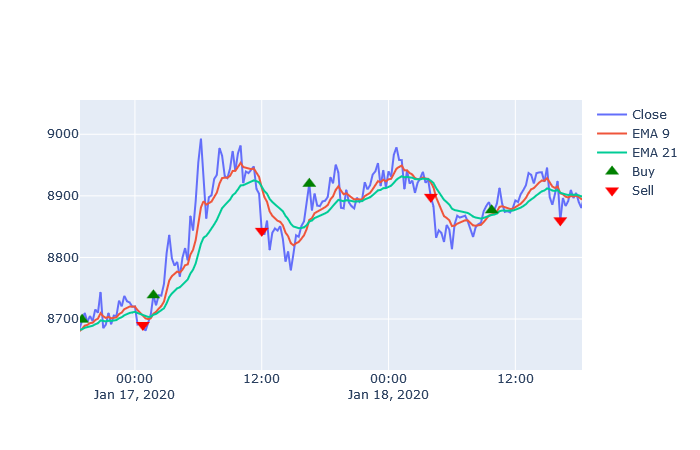
When we zoom on the graph and look at a frame of several hours, we can see that sometimes the strategy generates buy signals when the price is lower that the sell signal price, meaning that this trade is profitable. However, most of time, when the market is not clearly trending, this strategy generates many false signals and often too late to catch the market moves. We can surely fine tune the moving averages to adapt to this time window, however it will surely fit only this period and would perform poorly on another one. Also tuning too much variables for better performances on a given time frame is called data snooping bias, something we want to avoid for a sustainable live trading strategy.
Now let's try another strategy based on a little bit more advanced indicator, the . The MACD is a momentum indicator that uses the difference between two exponential moving averages, usually 12 periods for a fast and 26 for a slow one, compared to a signal line which is an EMA of this difference, usually of 9 periods. As with the previous strategy, buy and sell signals are generated when the MACD crosses its signal line.
python analyse.py data/BTCUSDT_20200101-000000_20200131-000000_15m.csv --macd 12 26 9 --strategy 2 12 26 9The new graph should be open on the navigator and contains a subplot with the MACD.
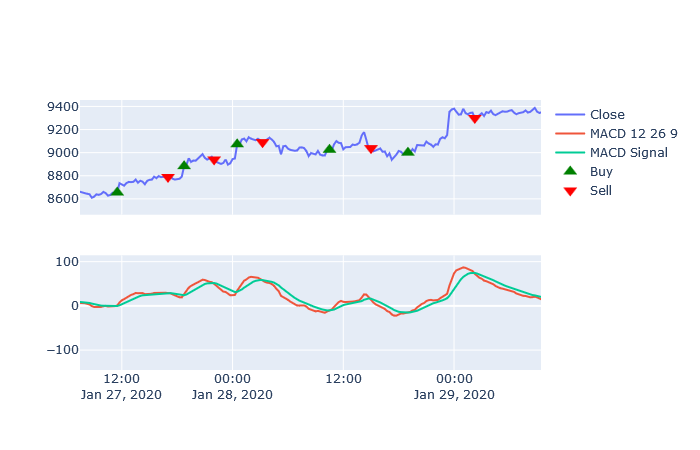
We can see that the MACD based strategy generate buy and sell signals with less lag that the simple EMA crossover. This strategy seems better, however it is not flawless as many false signals are generated when the market is stalling. It is always better to combine several indicators such as to confirm trends and / or filter some false signals.
Analysing the graphs of the two strategies, one looks more promising than the other, however we would like to compare both in term of returns, drawdowns and risks. This will be covered in the Backtesing chapter.