There are thousands of definitions out there about what are microservices, but the one I like best is that of the great master Martin Fowler
In short, the microservice architectural style is an approach to developing a single application as a suite of small services, each running in its own process and communicating with lightweight mechanisms, often an HTTP resource API. These services are built around business capabilities and independently deployable by fully automated deployment machinery. There is a bare minimum of centralized management of these services, which may be written in different programming languages and use different data storage technologies.
James Lewis and Martin Fowler
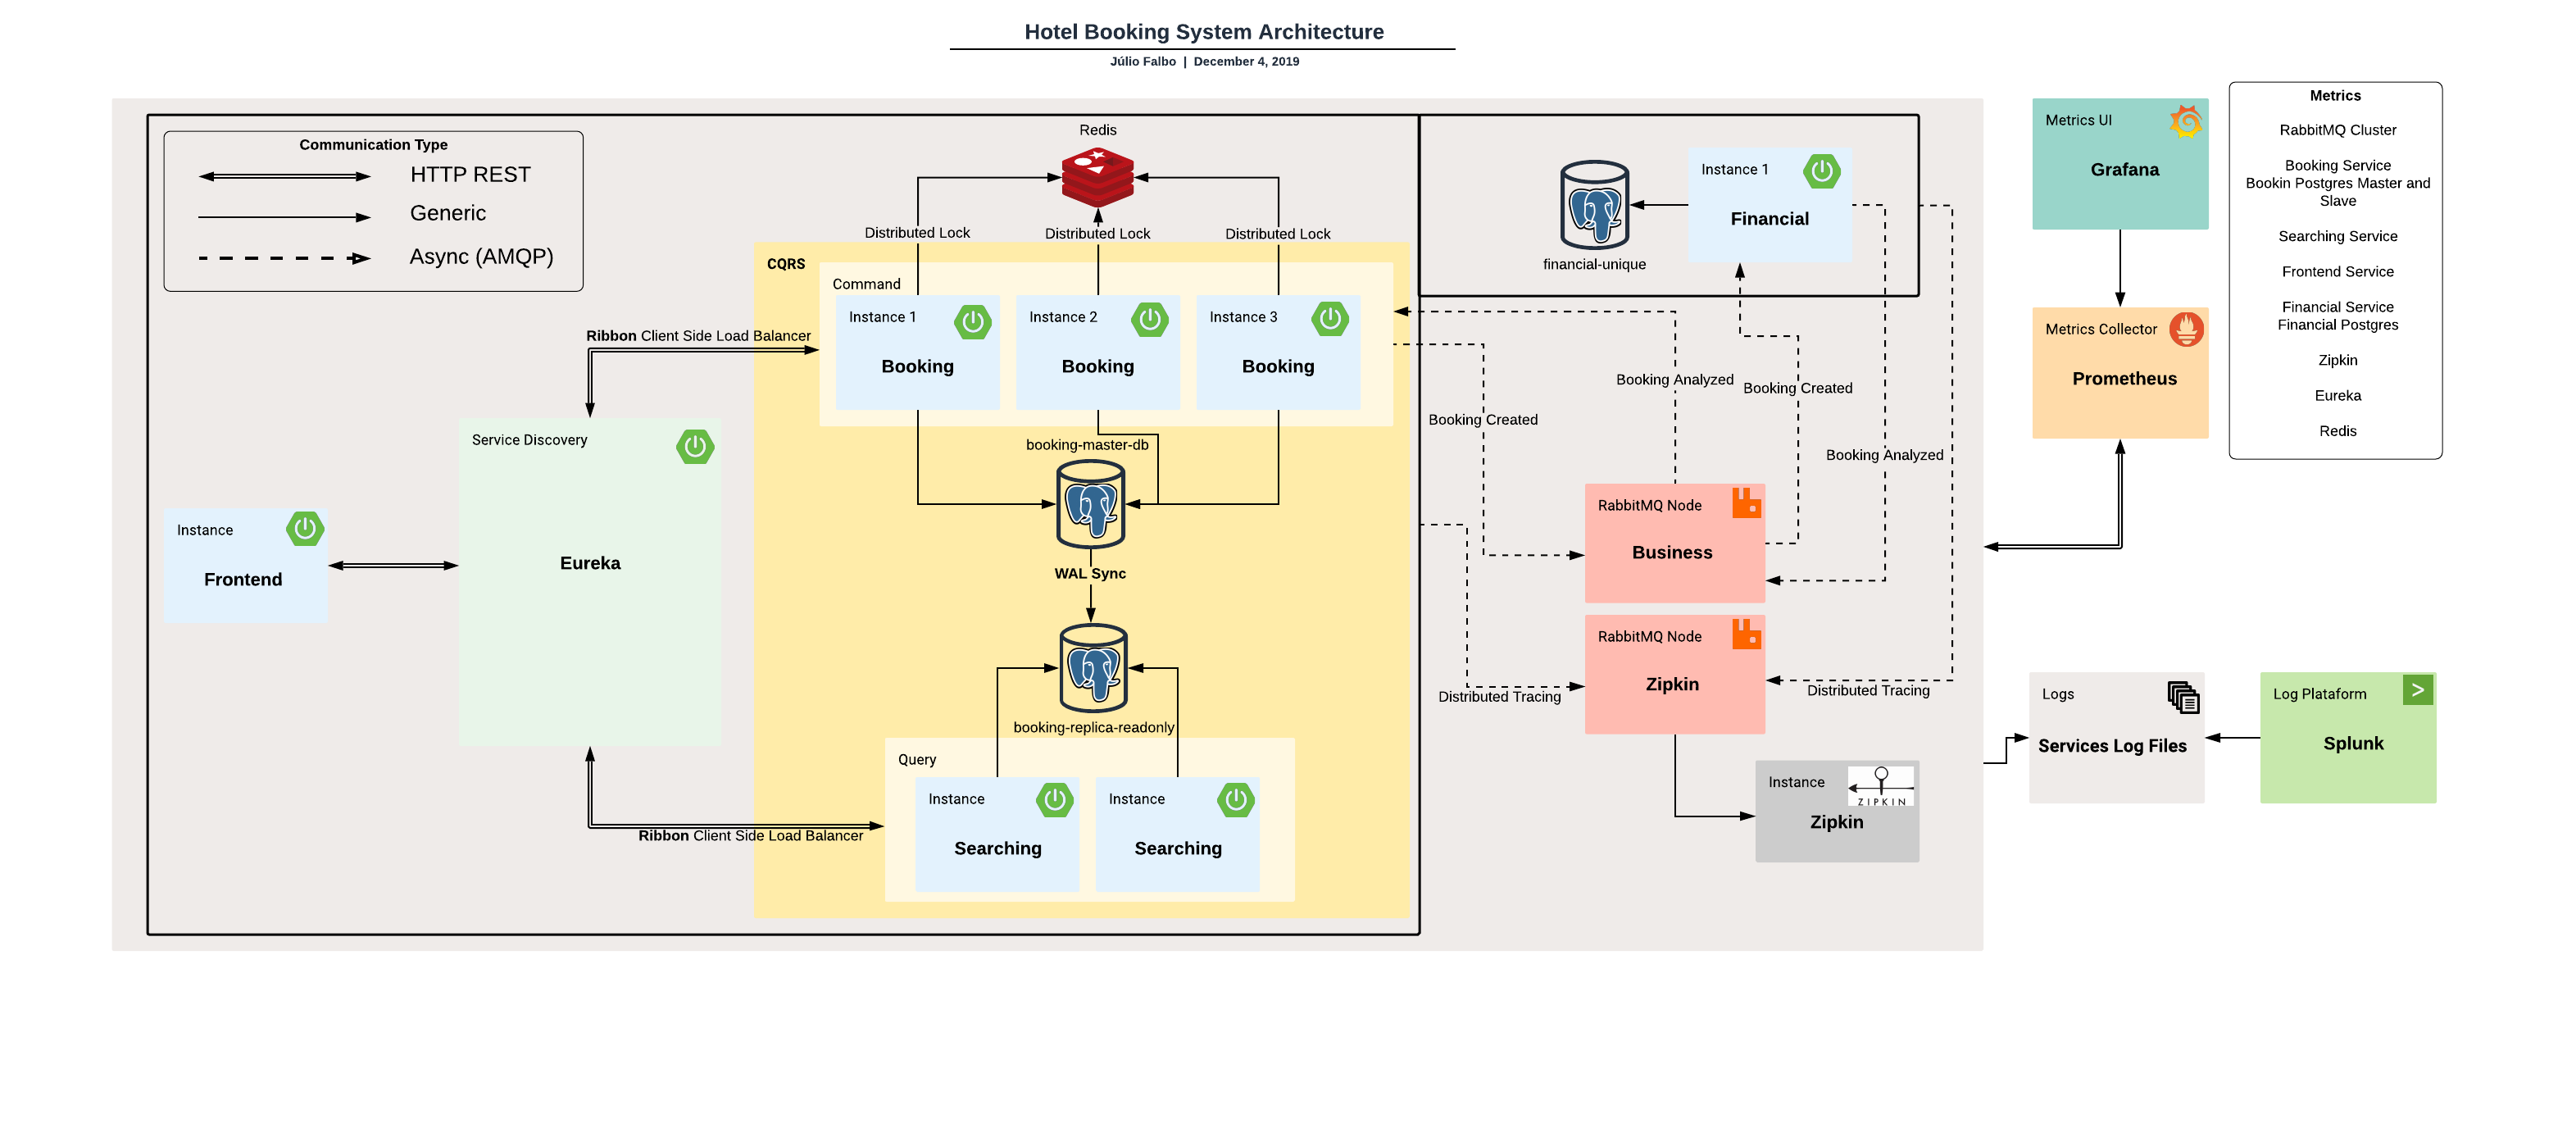
This is a whole environment of a Microservices Architecture. Here you can find the implementation of a lot of "fancy" patterns that we can find like CQRS, Distributed Lock, Domain Events, etc.
- Clone the repository
git clone git@github.com:juliofalbo/complete-microservices-env.git
- Build the services
./build.sh
- Start the whole environment
./start.sh
Note: If you want build and run just call ./start true
- Stop all services removing all volumes
./stop.sh
Note: Doing this you will loose all your data
- RabbitMQ as a Message Broker
- Feign to create REST Clients
- Ribbon to Client Side Load Balance
- Eureka to a Service Discovery
- Sleuth and Zipkin to a Distributed Tracing
- Hystrix to a Fault Tolerance
- Prometheus as a Metrics Collector
- Grafana as Metrics Analytics and UI
- Postgres as Database
- Flyway as Database Migration Tool
- Splunk as Log Analysis Platform
- Redis to handle Distributed Lock
- Swagger to create an OpenAPI documentation
| Application | Port |
|---|---|
| Booking Microservice | 8100, 8101, 8102 |
| Searching Microservice | 8200, 8201 |
| Financial Microservice | 8300 |
| Frontend Microservice | 8400 |
| RabbitMQ | 5672, 5673 |
| RabbitMQ Admin UI | 15672, 15673 |
| Booking Postgres Master | 5432 |
| Booking Postgres ReadOnly Replica | 5433 |
| Financial Postgres | 5434 |
| Grafana | 3000 |
| Prometheus | 9090 |
| Splunk | 8000 |
| Netflix Eureka | 8761 |
| Zipkin | 9411 |
In the root folder we have a file called CreateBookingConcurrencyTest.jmx. So, this is a JMeter that can be easily imported and the only thing that you should do is change the room id for the tests.
With this test it is possible to see that the booking service is queuing the requests based on the distributed lock on Redis and treating the concurrency issue.
- Grafana Dashboards
- All monitored services
- Splunk
- RabbitMQ UI
- Zipkin
- Eureka
- Booking Swagger
- Searching Swagger
- Frontend
- DDD Study
- Create RabbitMQ Cluster
- Create https://grafana.com/ and Prometheus
- Create Postgres Replication Strategy
- Create a Service Discovery (Eureka)
- Create Booking Service
- Create Searching Service
- Create Distributed Lock with Redis
- Create Domain Events
- Create Retry Strategy and DLQ Strategy for RabbitMQ messages
- Create Financial Service
- Creating Frontend
- Creating Retry Strategy for HTTP requests (Feign)
- Create Distributed Tracing with Zipkin
- Create and Integrate Splunk with all Services
- Integrate Prometheus with: RabbitMQ Cluster, All Postgres containers, All Services containers, Zipkin
- Create a docker-compose to up the whole environment
- Add embedded RabbitMQ and embedded Redis for test purpose
- Create Dashboards on Grafana for all services in Prometheus
- Create more Unit tests to cover more classes and scenarios
- Implement Twitter Diffy to test changes
- Implement Integration Test with Karate (Cucumber)
- Create Auth service with Keycloack
- Create business metrics on the Services

