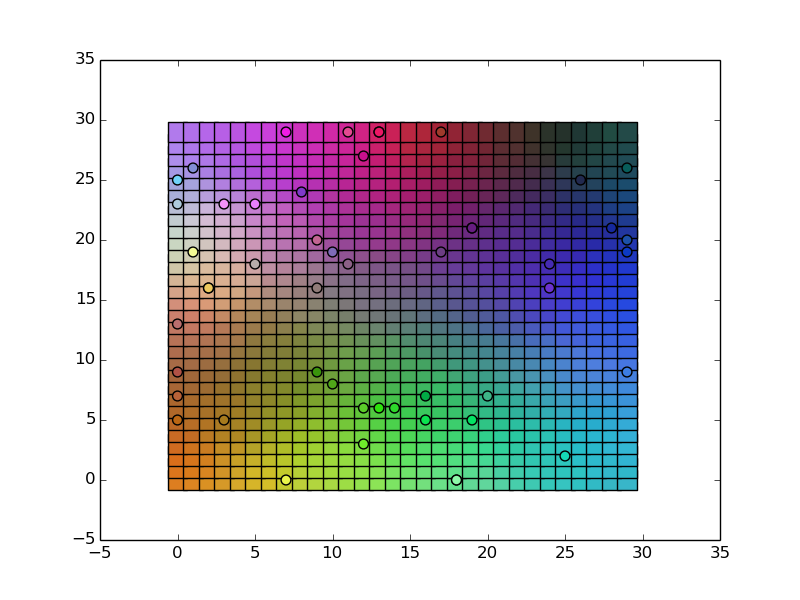
This is a tool for generating self-organizing maps, which are a neat way to visualize high dimensional data in a lower dimensional representation.
Import module, set up a map object, and train the map. Maps of RGB colors are a good example.
import som
color_data = [ [ random.random()*255 for i in xrange(3) ] for i in xrange(1000) ]
mymap = som.map(color_data)
mymap.train()
The map can be printed to a file, or plotted. Map coordinates can be predicted for new data points.
mymap.printGrid('map.dat')
mymap.classify([210,44,122])
See colors_example.py for a more detailed example.