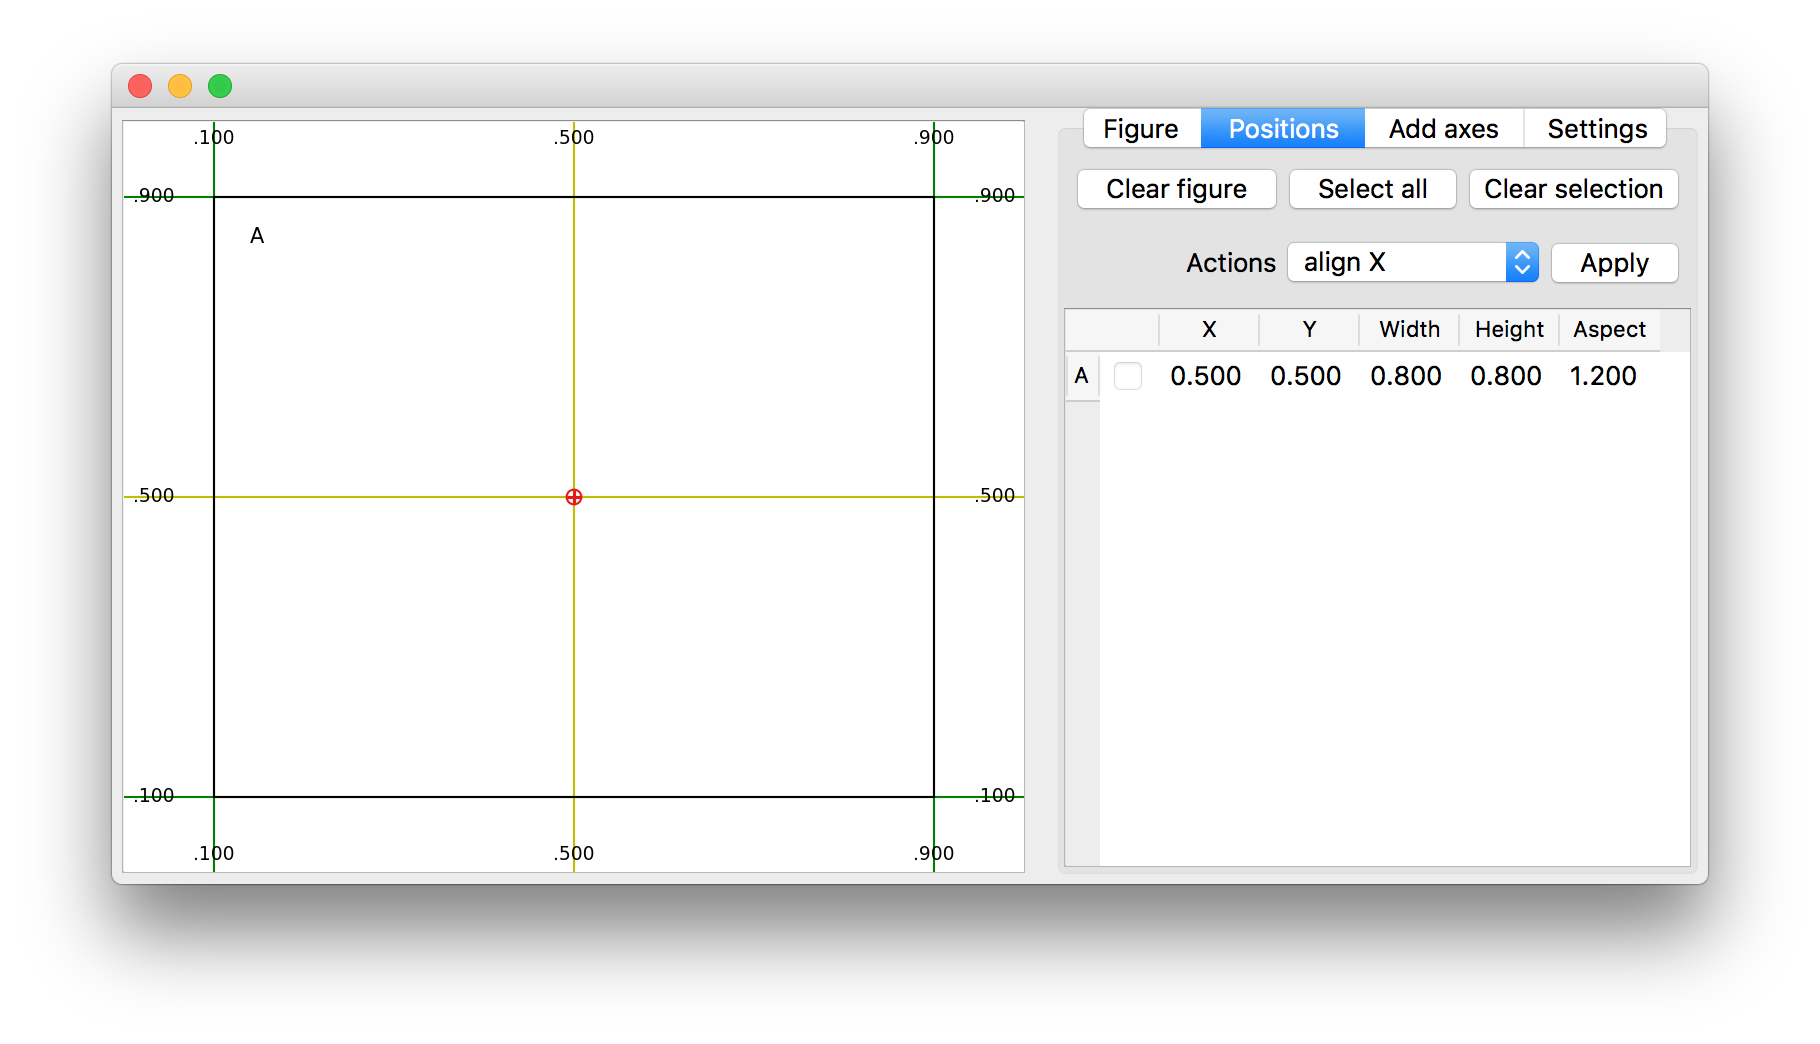
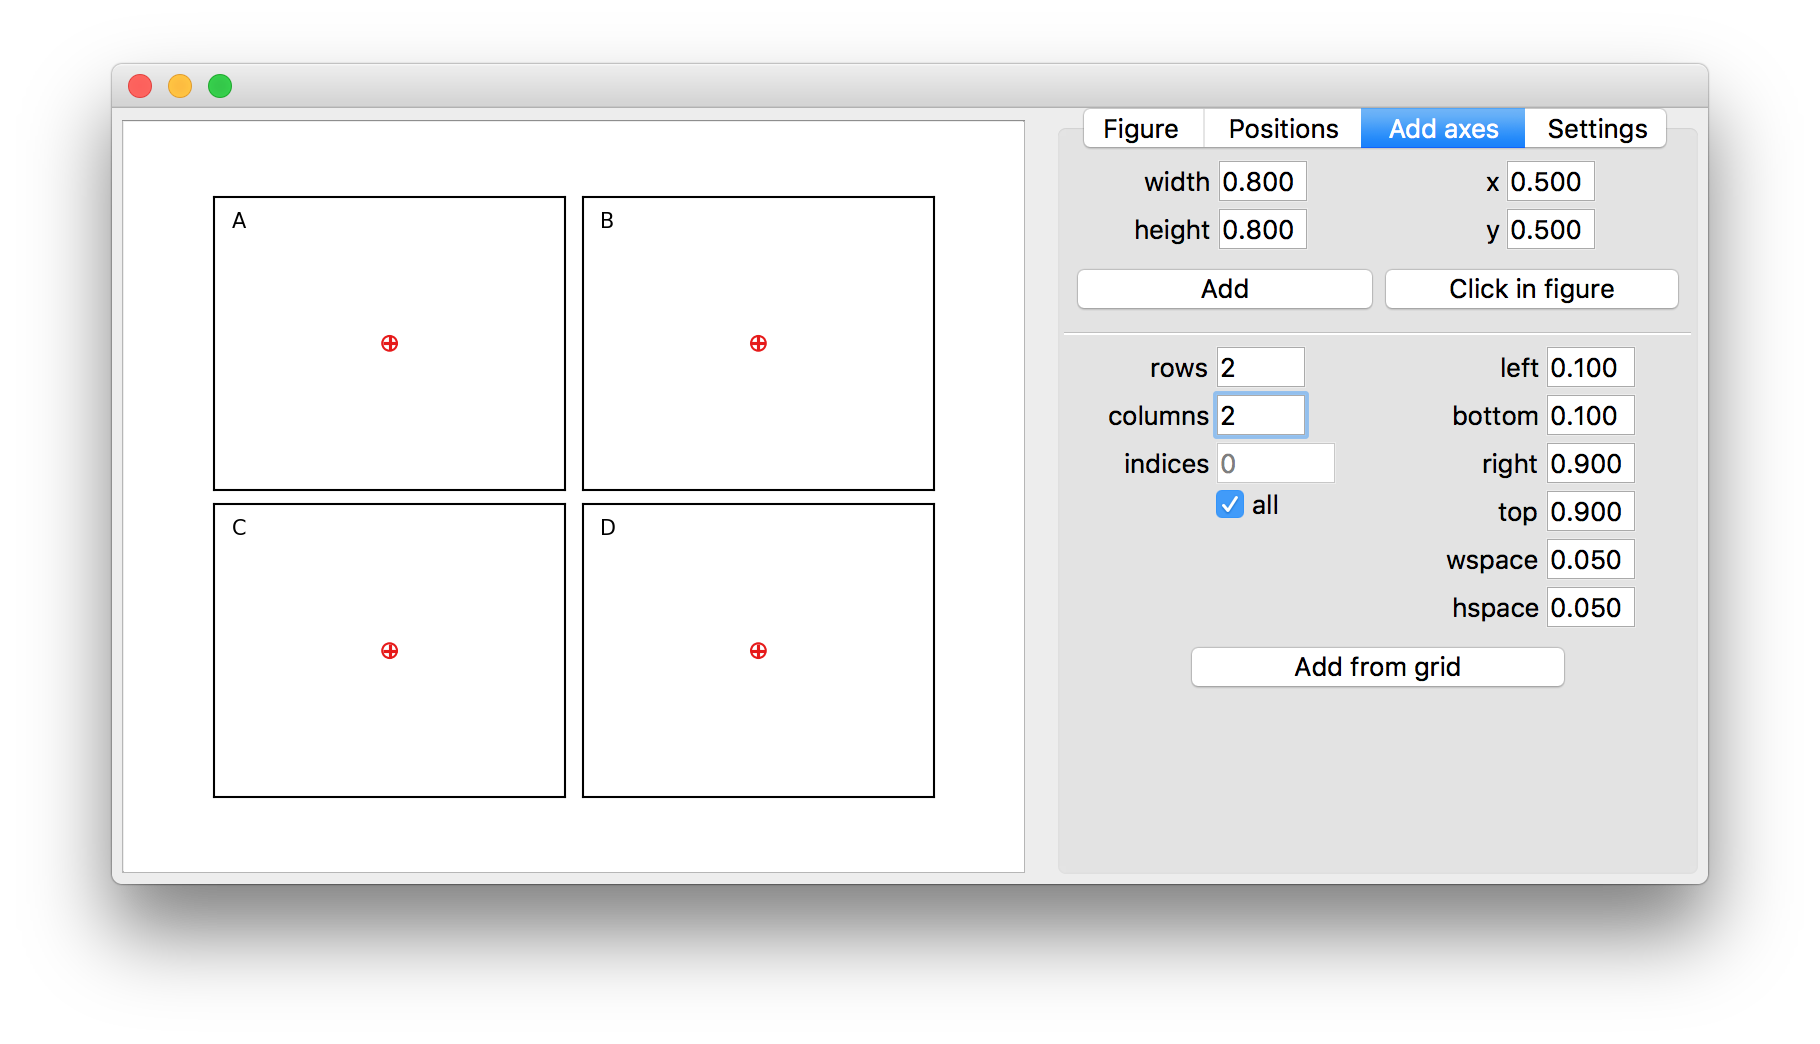
Correctly positioning axes in matplotlib can be a long and iterative process.
Using the graphical interface utility axpositioning.adjust_figure_layout(fig) can ease the process.
- Move and resize existing axes
- Join, split and align axes
- Change the used reference point of an axes bounds when editing
- Create new axes by manually defining the position and size, clicking in the figure or using GridSpec settings
- Change the size of the figure
- Preview the updated positions of the empty placeholder axes during editing
- Close to update the axes positions and size of the original figure
Run from the command line
python -m axpositioningAdjust figure layout using gui in script
from matplotlib import pyplot as plt
import axpositioning

fig = plt.figure()
ax = fig.add_subplot(111)
ax.plot([0, 1], [0, 1])

axpositioning.adjust_figure_layout(fig)

plt.show()
Adjust axes position using anchors and plotutils.PositioningAxes
from matplotlib import pyplot as plt
import axpositioning

fig = plt.figure()
ax = fig.add_axes([.1, .1, .8, .8])
p = axpositioning.PositioningAxes.from_axes(fig, ax, anchor='C')

p.set_anchor('C')
print(p.x, p.y)

p.set_anchor('SW')
print(p.x, p.y)

p.set_anchor('NE')
print(p.x, p.y)
