- This project utilizes the PyTorch library to implement a Convolutional Neural Network (CNN) model for classifying 28x28 grayscale images of handwritten characters (a-z) and digits (0-9).
- The dataset is downloaded from MNIST database which contains 124,800 grayscale images of handwritten characters and 240,000 grayscale images of handwritten digit with the dimension of 28×28 pixels.
- The CNN model takes a 28x28 grayscale image as input and converts it into 6 feature maps, each with a dimension of 7x7 pixels. These 6 feature maps are then flattened, resulting in 294 (7x7x6) pixels.
- The 294 flattened feature maps are then used as input to a Neural Network. This Neural Network contains an input layer with 294 input neurons, a hidden layer with 50 neurons, and an output layer with 26 neurons for character classification or 36 neurons for combined character and digit classification.
The model takes an input of 28×28 grayscale image and outputs a prediction of the 26 character classes or 26 character plus 10 digit classes.

-
First Convolutional Layer:
- Input: (single-channel grayscale image)
- Kernel size: 3×3, padding = 1, stride = 1
- Output size (before pooling): 28×28×6
- First convolution size
$\large\ =\ \frac{Input\ size\ +\ 2\ \times\ Padding\ -\ Kernel\ size}{Stride}\ +\ 1\ =\ \frac{28\ +\ 2\ \times\ 1\ -\ 3}{1}\ +\ 1\ =\ 28$
- Resulting feature map: 28×28×6
- First convolution size
- After max pooling (2×2, stride = 2):
- First max pooling size
$\large\ =\ \frac{Input\ size\ -\ Pool\ size}{Stride}\ +\ 1\ =\ \frac{28\ -\ 2}{2}\ +\ 1\ =\ 14$
- Resulting feature map: 14×14×6
- First max pooling size
-
Second Convolutional Layer:
- Input: 14×14×6
- Kernel size: 3×3, padding = 1, stride = 1
- Output size (before pooling): 14×14×6
- Second convolution size
$\large\ =\ \frac{14\ +\ 2\ \times\ 1\ -\ 3}{1}\ +\ 1\ =\ 14$
- Resulting feature map: 14×14×6
- Second convolution size
- After max pooling (2×2, stride = 2):
- Second max pooling size
$\large\ =\ \frac{14\ -\ 2}{2}\ +\ 1\ =\ 7$
- Resulting feature map: 7×7×6
- Second max pooling size
-
Flattening for Fully Connected Layers:
- 7×7×6 = 294
- 294 pixels becomes the input to the Neural Network.
- 7×7×6 = 294
-
Neural Network:
- Input Layer:
- 294 input neurons connected to hidden layer
- Hidden Layer:
- 50 input neurons connected to output layer
- Output Layer:
- 26 output neurons in the case of character classification
- 36 output neurons in the case of both character and digit classification
- Input Layer:
- To assess the model's performance, the testing dataset is used, and undersampling is performed to ensure balanced class distribution across alphabet and digit images.
- The evaluation metrics used include precision, recall, F1-score, and accuracy.
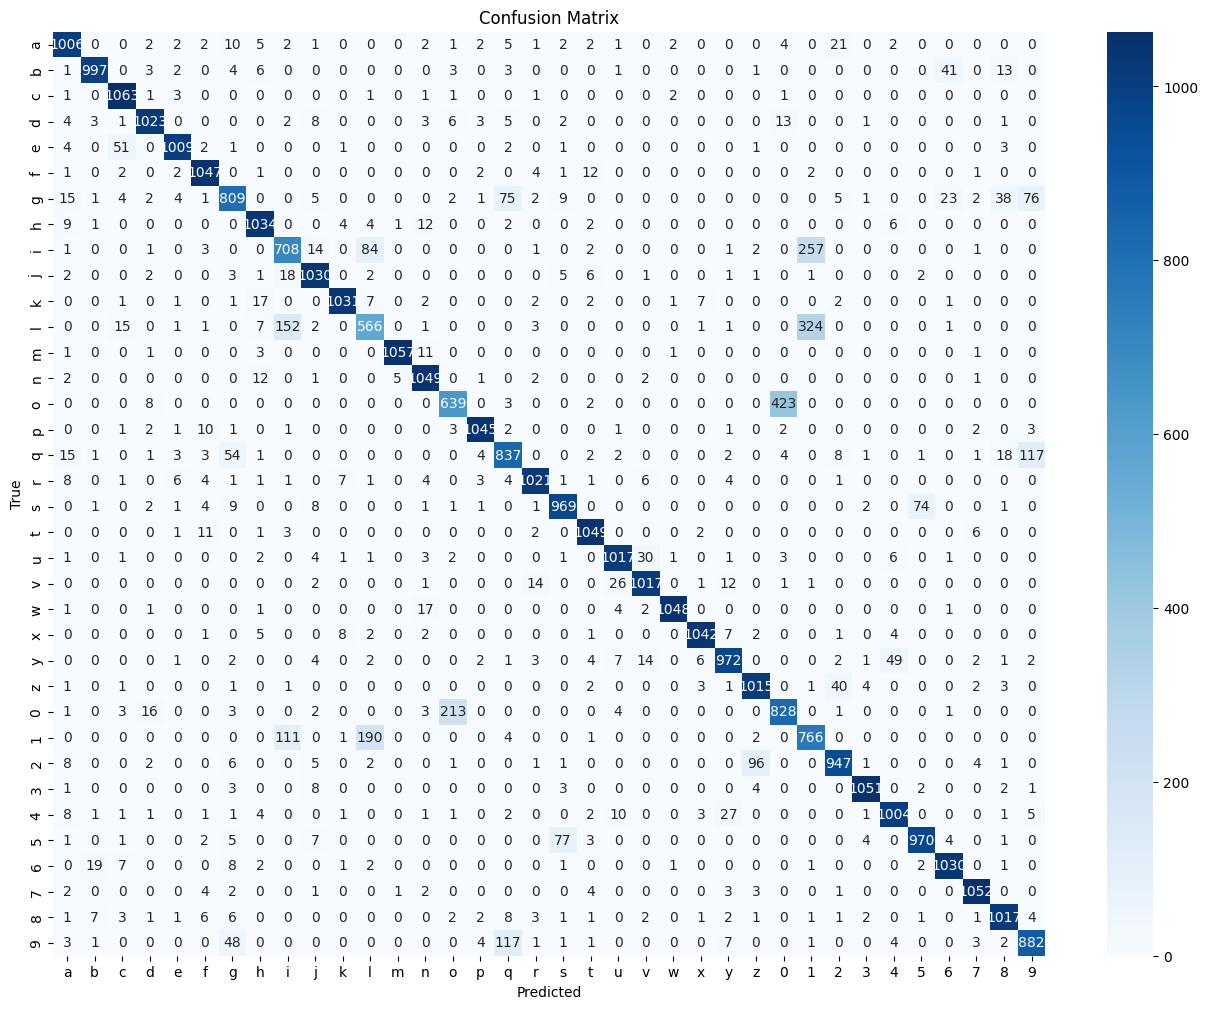
- A confusion matrix is also used to visualize the predicted labels against the actual labels.
The overall accuracy of 90% indicates a good classification performance.
            precision    recall  f1-score   support

         a       0.92      0.94      0.93      1075
         b       0.97      0.93      0.95      1075
         c       0.92      0.99      0.95      1075
         d       0.96      0.95      0.95      1075
         e       0.97      0.94      0.96      1075
         f       0.95      0.97      0.96      1075
         g       0.83      0.75      0.79      1075
         h       0.94      0.96      0.95      1075
         i       0.71      0.66      0.68      1075
         j       0.93      0.96      0.95      1075
         k       0.98      0.96      0.97      1075
         l       0.66      0.53      0.58      1075
         m       0.99      0.98      0.99      1075
         n       0.94      0.98      0.96      1075
         o       0.73      0.59      0.66      1075
         p       0.98      0.97      0.97      1075
         q       0.78      0.78      0.78      1075
         r       0.96      0.95      0.96      1075
         s       0.90      0.90      0.90      1075
         t       0.95      0.98      0.97      1075
         u       0.95      0.95      0.95      1075
         v       0.95      0.95      0.95      1075
         w       0.99      0.97      0.98      1075
         x       0.98      0.97      0.97      1075
         y       0.93      0.90      0.92      1075
         z       0.90      0.94      0.92      1075
         0       0.65      0.77      0.70      1075
         1       0.57      0.71      0.63      1075
         2       0.92      0.88      0.90      1075
         3       0.98      0.98      0.98      1075
         4       0.93      0.93      0.93      1075
         5       0.92      0.90      0.91      1075
         6       0.93      0.96      0.95      1075
         7       0.97      0.98      0.98      1075
         8       0.92      0.95      0.93      1075
         9       0.81      0.82      0.81      1075

  accuracy                           0.90     38700
  macro avg     0.90       0.90      0.89     38700
  weighted avg  0.90       0.90      0.89     38700
The model may struggle to differentiate between classes that closely resemble each other.


