ScatterplotMatrix
d3 Scatterplot Matrix visualization for Qlik Sense
This visualization is based on Mike Bostock's excellent Scatterplot Matrix Brusing example (http://bl.ocks.org/mbostock/4063663).
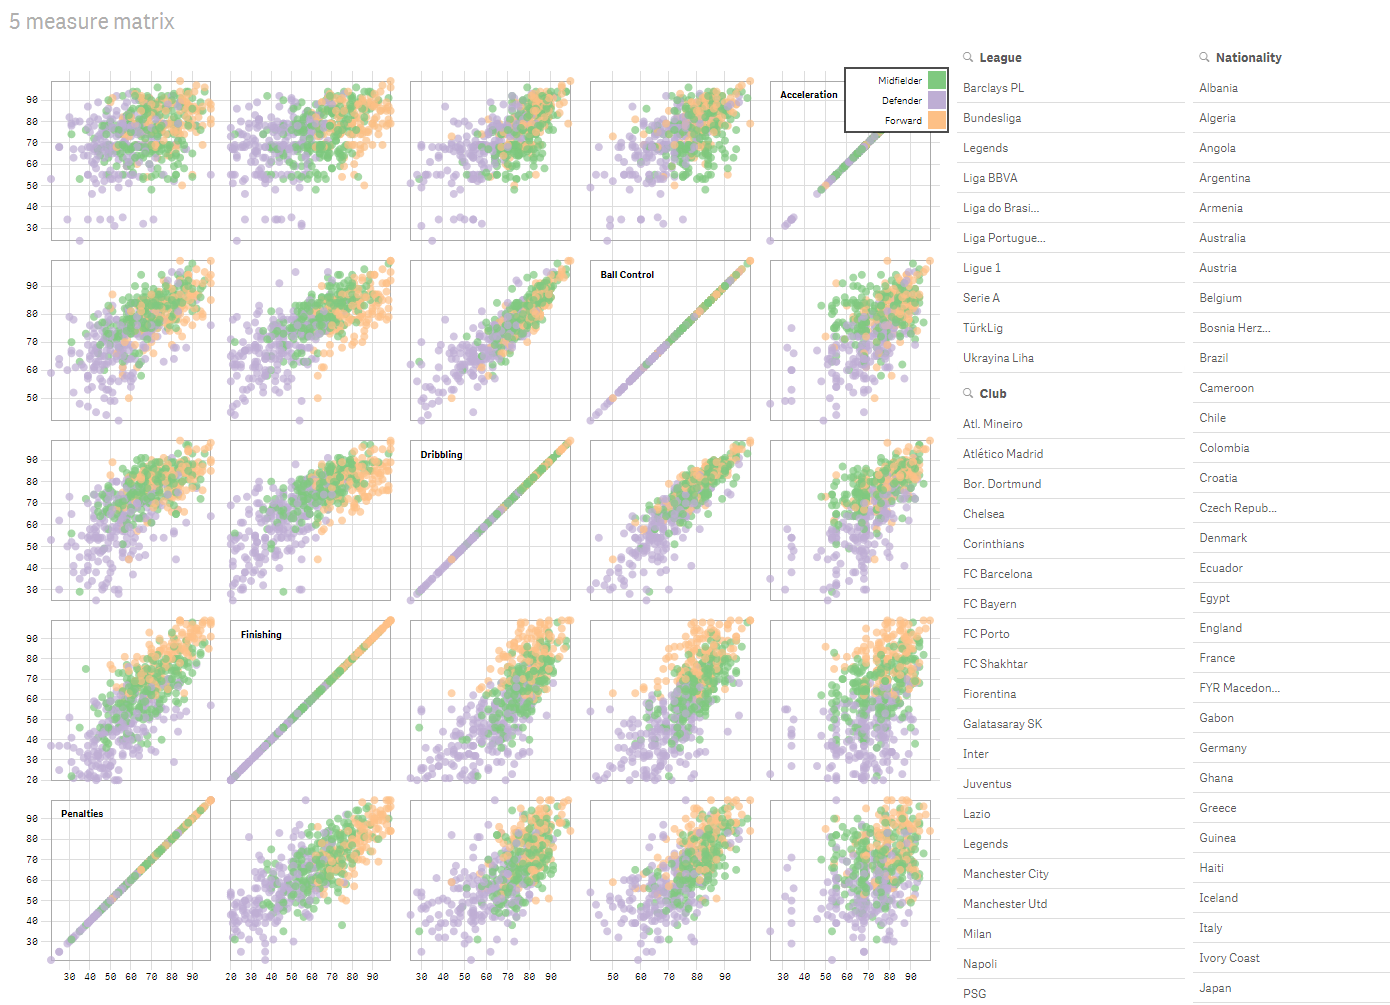
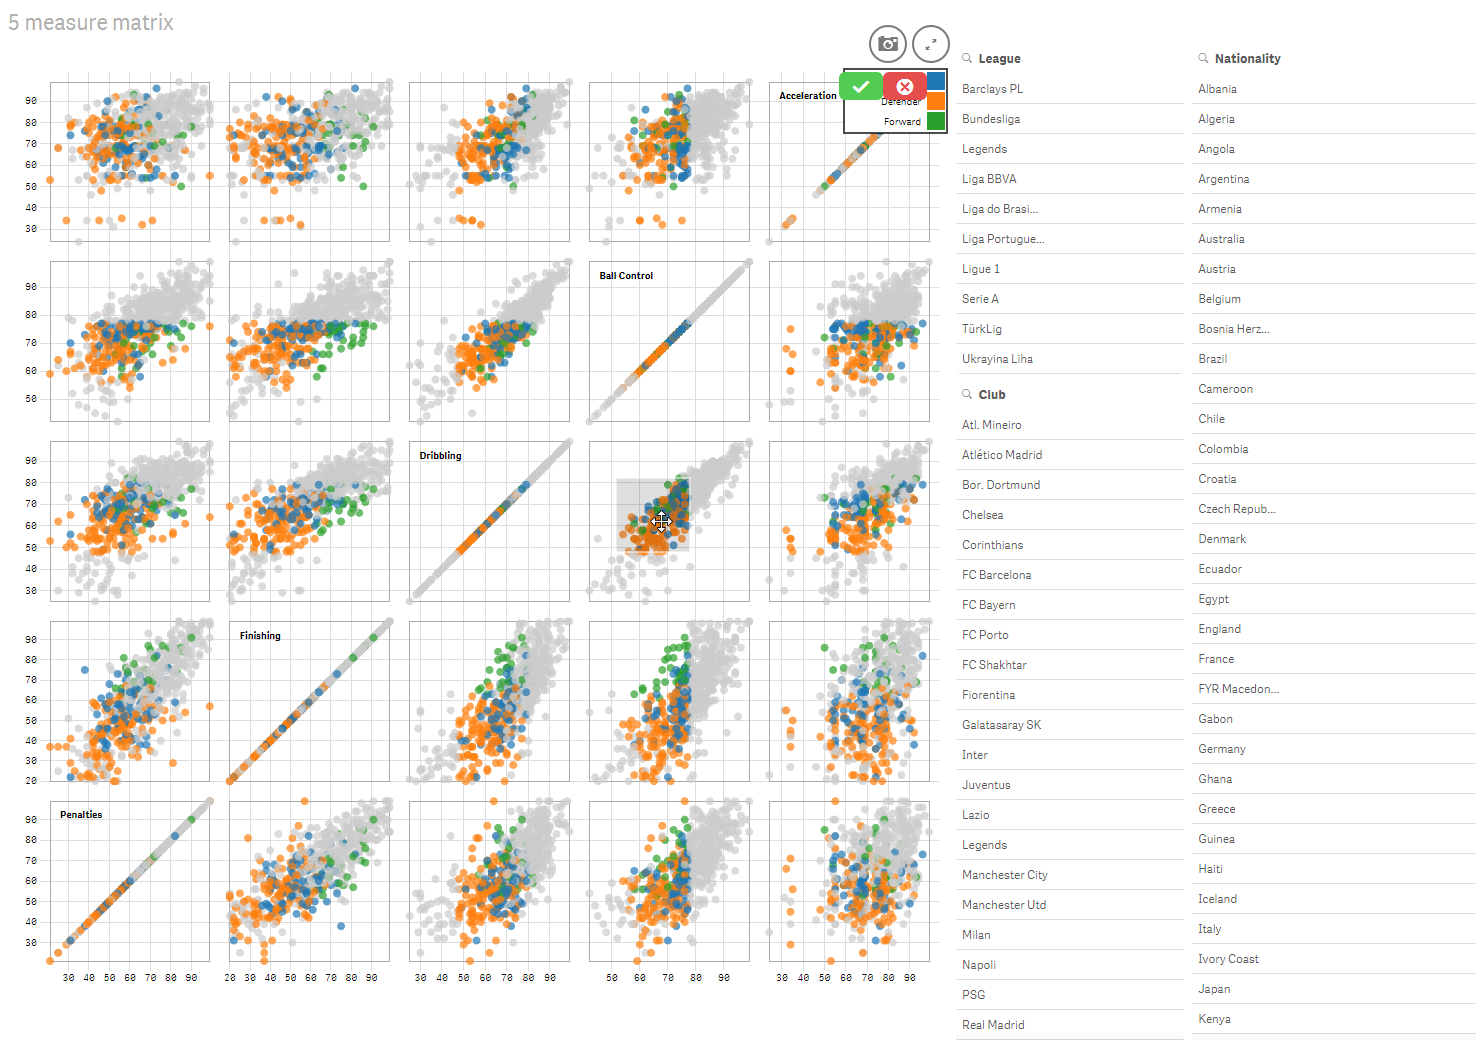
It comes with a demo based on a FIFA 14 dataset showing a matrix of scatterplots comparing players across different metrics. The extension is fully interactive with selection support based on brushing.
Example
Installation
- Go to Git-Hub (https://github.com/johsund/ScatterplotMatrix)
- Download ZIP
- Extract under Sense Extension folder
- Add two dimensions (Dots & Colors) and 2 to 9 expressions to create a Scatter Plot Matrix
- Customize look and feel with the properties - themes, legends, titles

