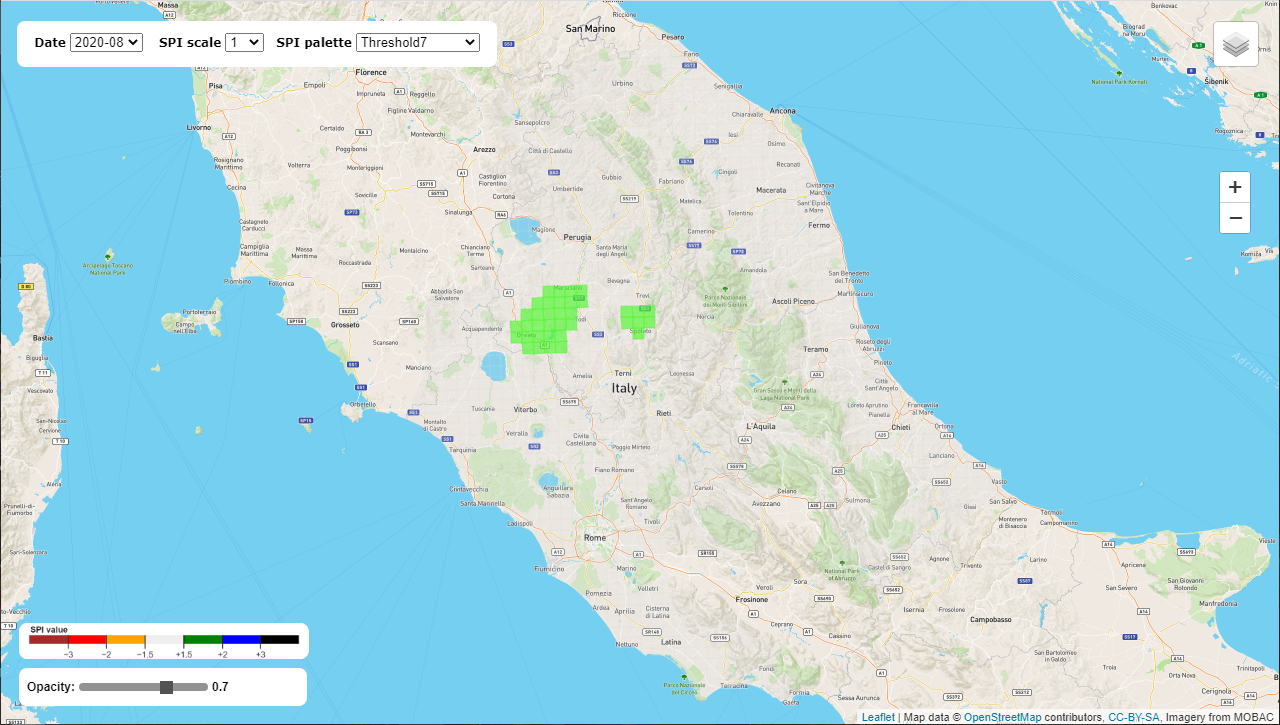
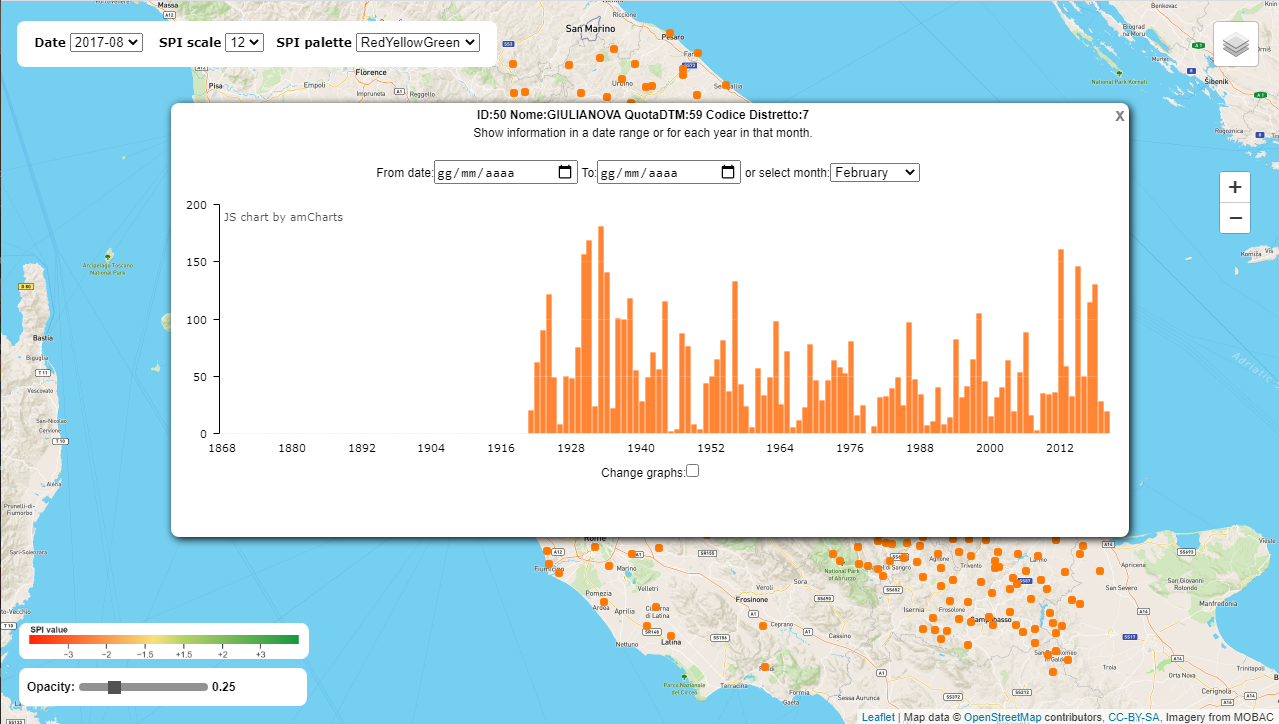
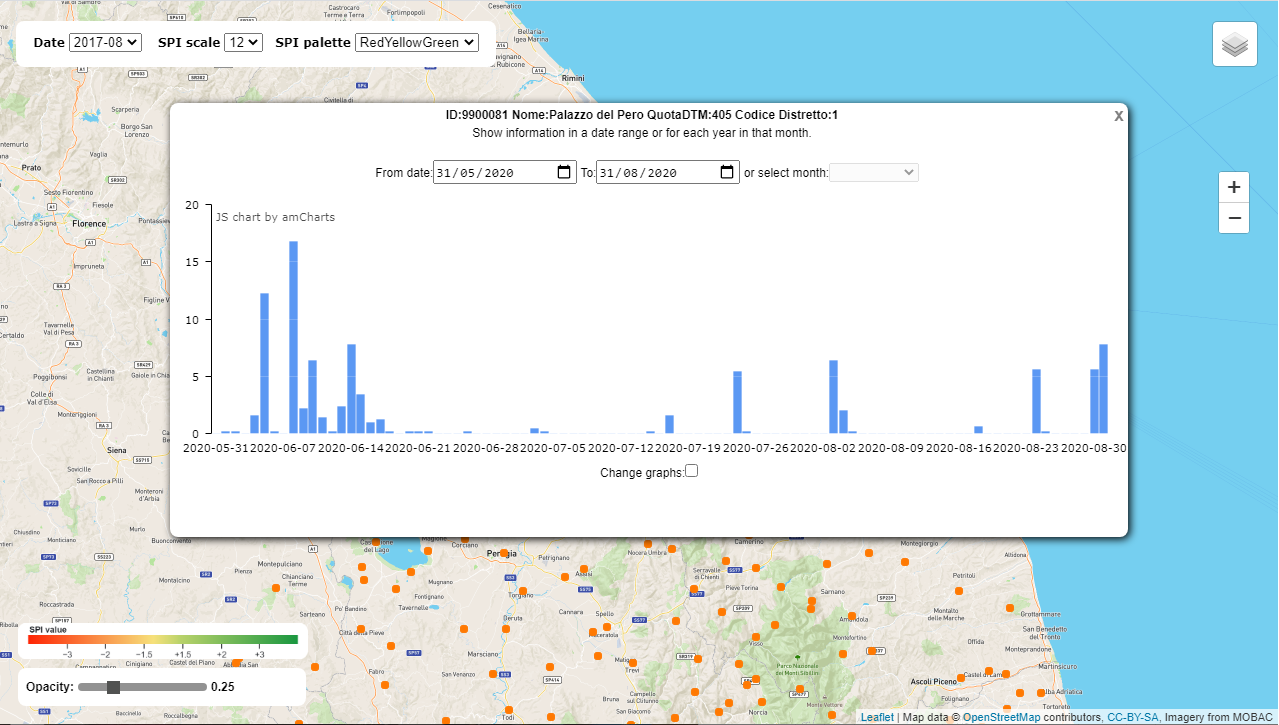
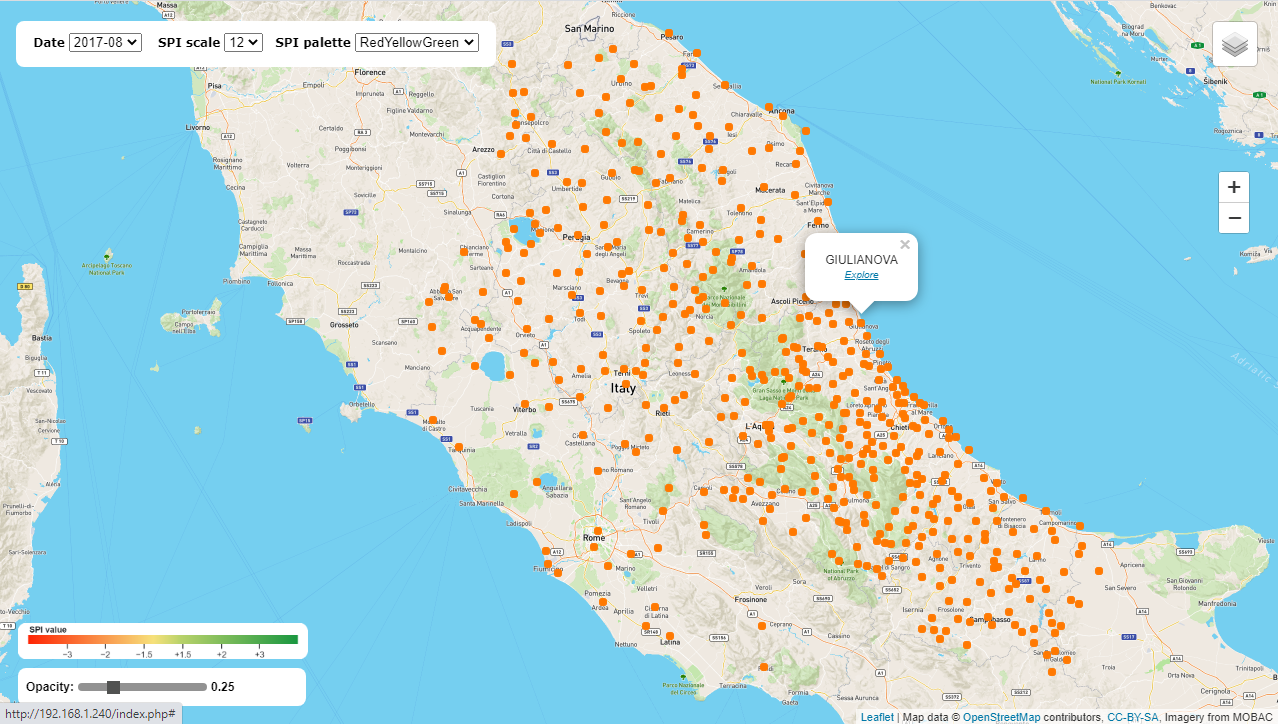
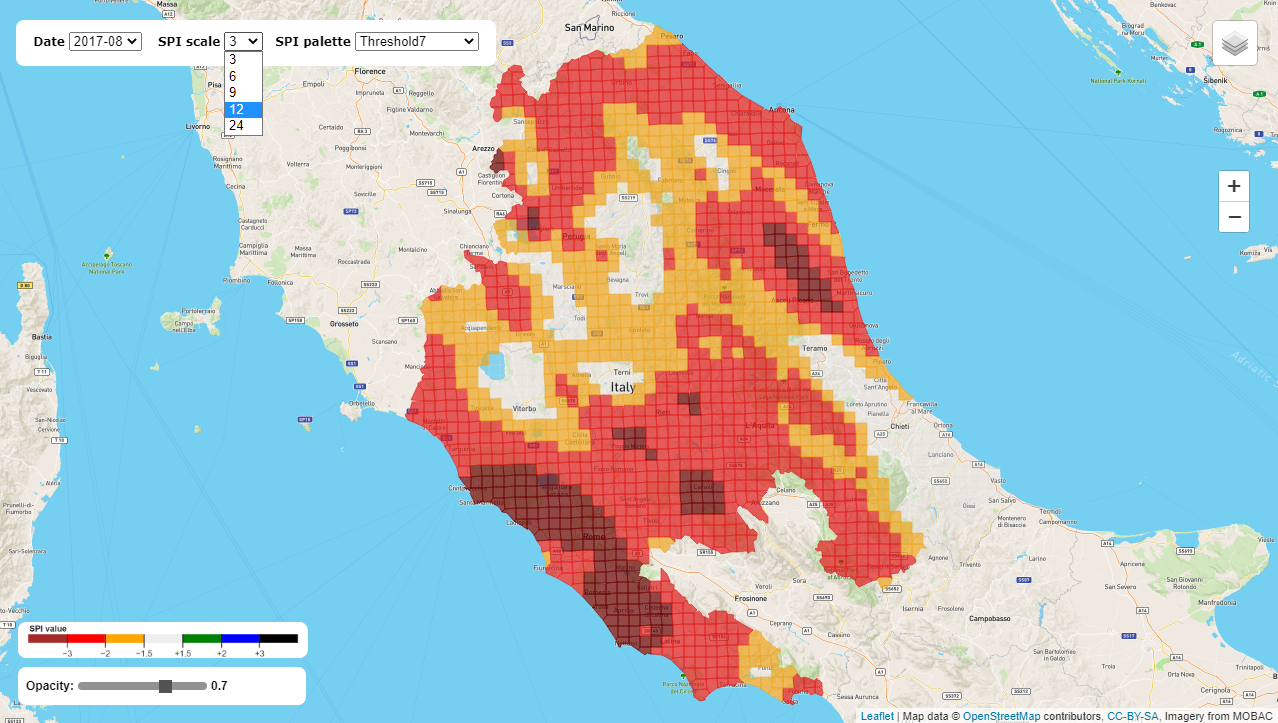
This web application is developed with the scope to create an interactive drought-bulletin, without the use of GIS software. The application shows a map where Standard Precipitation Index (SPI) values are drawn over it. Values are shown in clickable colour cells. Clicking on a cell open a pop-up with the value, you can change the colour of the cells using the colour palette. On the menu's layer is possible to select the pluviometric station's layer that shows clickable orange icons on the map. When you click on an icon station you get a pop-up with the name of the station and you can explore it, clicking on Explore. When you click on Explore a Window appear over the map showing a graph. You can see in this graph the data for a single month in each available year or show daily data for a specific date range.
Home Page
Graph of the selected month in each year
Graph of the selected data range
Pluviometric stations on the map while selecting active layer
Different color palette while selecting new SPI scale
Contains the app
Contains data, image and scripts used in the development of the app
Contains tests and exercises
BSD 3-Clause "New" or "Revised" License A permissive license similar to the BSD 2-Clause License, but with a 3rd clause that prohibits others from using the name of the project or its contributors to promote derived products without written consent.
