This document will guide you through the basic steps to get started with the HPX dashboard.
As the dashboard is almost entirely built with Python, installation can be done through the usual
pip install. It is recommended to create a virtual environnement:
python -m venv path_for_the_venv
source path_for_the_venv
pip install --upgrade wheel
or if you use anaconda, you can create the environnement as follows:
conda create --name myenv python=3.8Once the environnement is created, clone the repository:
git clone https://github.com/jokteur/hpx-dashboardFor regular users, installation can be done with the command:
cd hpx-dashboard
pip install .
For developpers, it is recommended to install with the source in place:
cd hpx-dashboard
pip install -e .

# Install pre-commit and Sphinx additionnaly
pip install -r ./requirements-dev.txt
# Install the hooks for git
pre-commit install
Once the hpx-dashboard is installed, make sure that it works by testing the command:
hpx-dashboard-serverIf after a few seconds, it shows
INFO:hpx-dashboard:Bokeh server started on http://localhost:5006Then it means that the installation has been successful.^
If you are a user of the supercomputer Piz Daint of the CSCS, then the installation procedure is a little bit different. To create the virtual environnement:
# Load the python module if it is not already loaded
module load cray-python
python -m venv path_for_the_venv
# It may that the wrong packages (from system packages) will load once the program is running
# Before activating the environnement, you can unset the python path
unset PYTHONPATH
# Then activate the environnement
source ./path_for_the_venv/bin/activate
Then the rest of the installation should be similar as described above.
HPX is an open-source C++ standard library for Concurrency and Parallelism which closely follows the C++11/14/17/20 ISO standard. The goal of HPX is to provide an open source implementation of a new programming model which allows to fully take advantage of parallel systems, from low power devices to large scale clusters. This means that the libary allows for task-based programming: the user can spawn millions of threads (i.e. tasks) with minimal overhead.
To learn more about HPX, visit the official documentation or the official github.
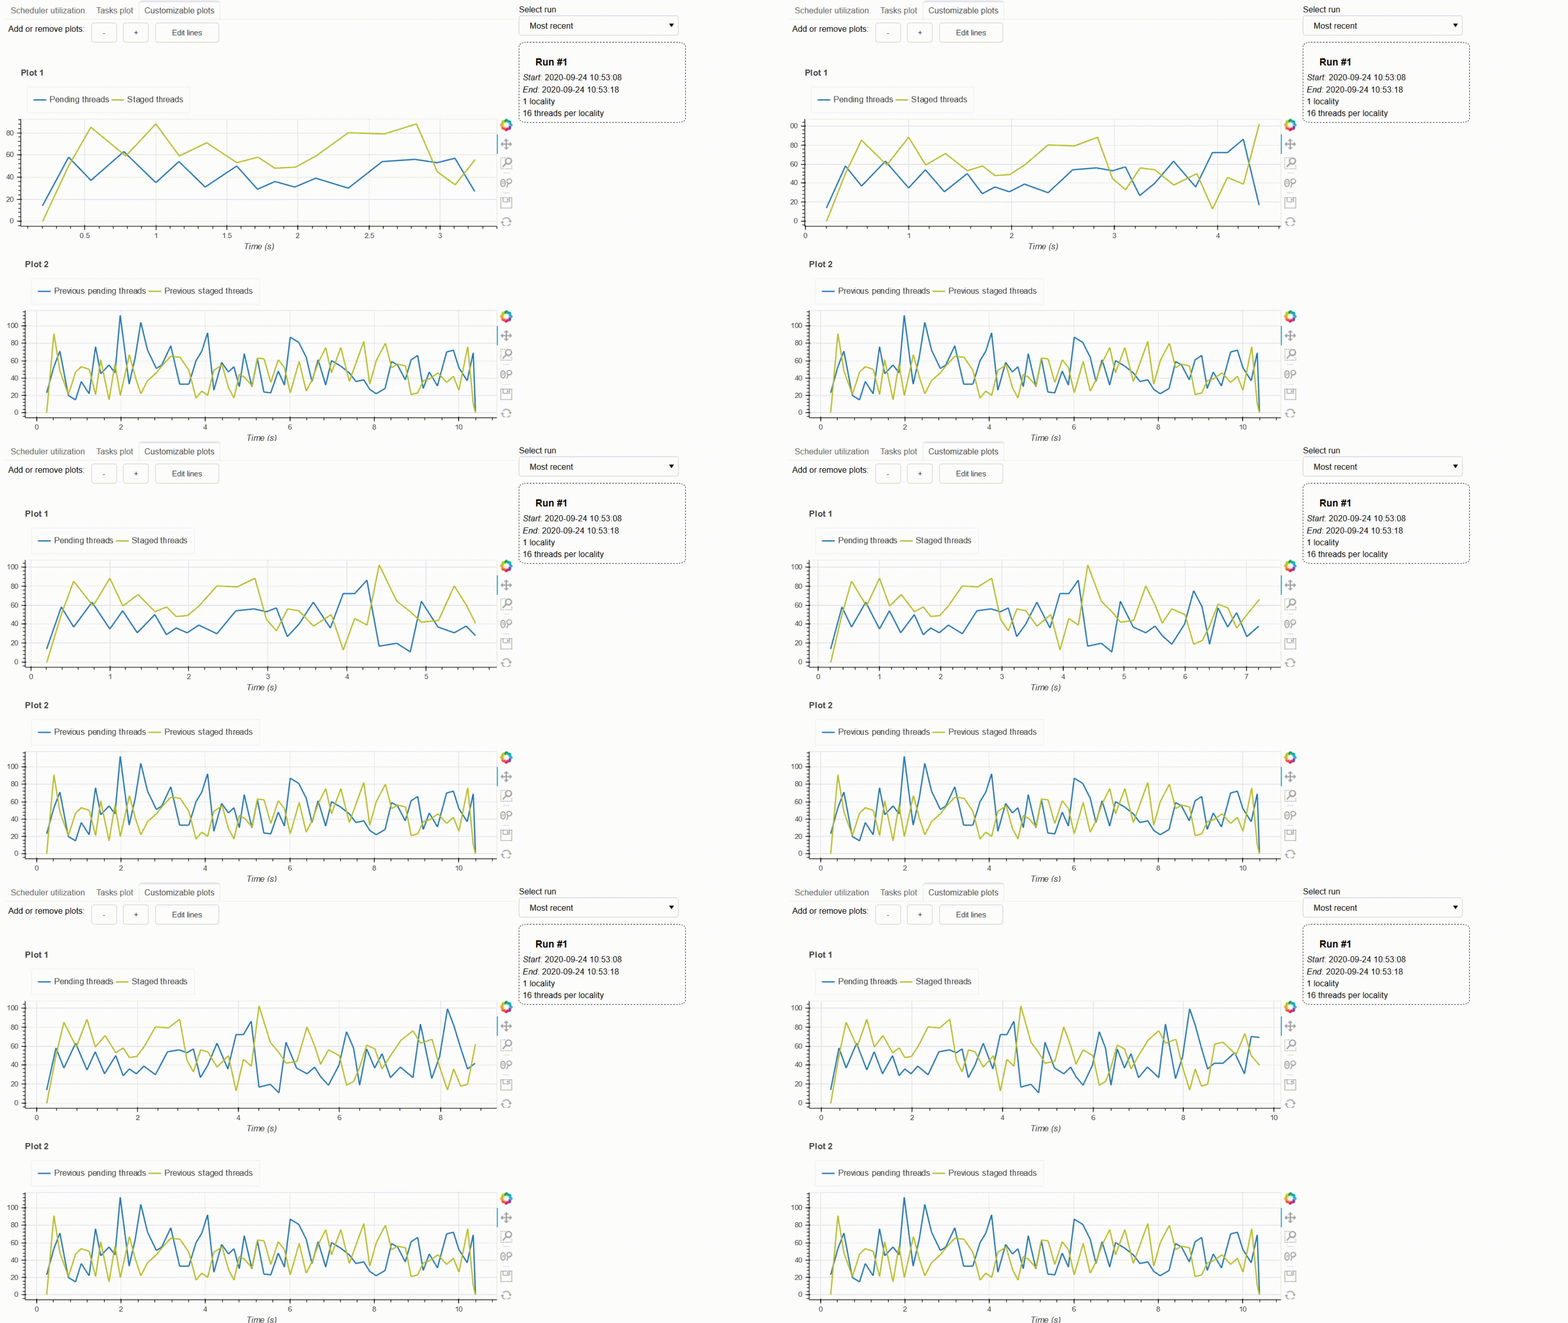
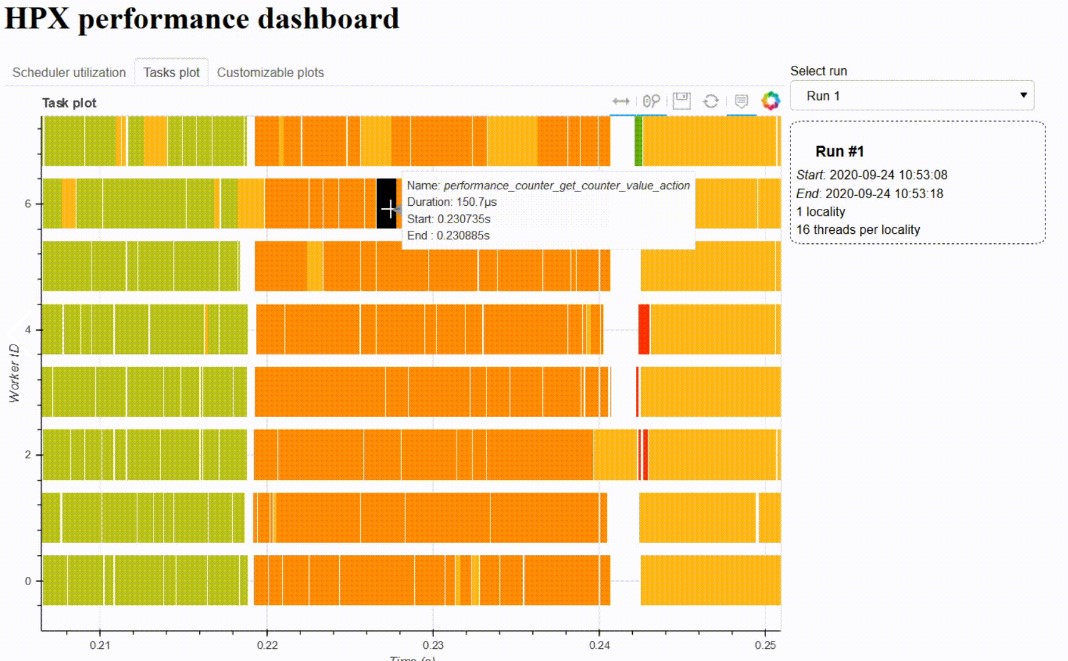
The goal of the HPX dashboard is to provide an open-source interactive dashboard for debugging and performance analysis of HPX applications. The tool is build with Python and Bokeh , which allows for interactive plotting. Here are the goals of the project:
- It should be an external tool that does not add overhead on the HPX application. This is why data produced by HPX can be streamed over the network to the plotting server of the dashboard.
- The tool should be in real-time. Indeed, HPX has a capability of producing real-time data (with the performance counters). This allows for the user to have a quick feedback on the performance of his app.
- Integration with Jupyter notebooks. With the notebooks, the user explore the data that is collected by the dashboard and also extend it.
- A tool that is also build for the demonstration of HPX applications in tutorials and courses.
This tool is not intended to replace more advanced profiling tools such as vampire. Also, due to current limitations with Python and rendering, this tool cannot process extremely large datasets which typically result from very long executions of HPX applications.
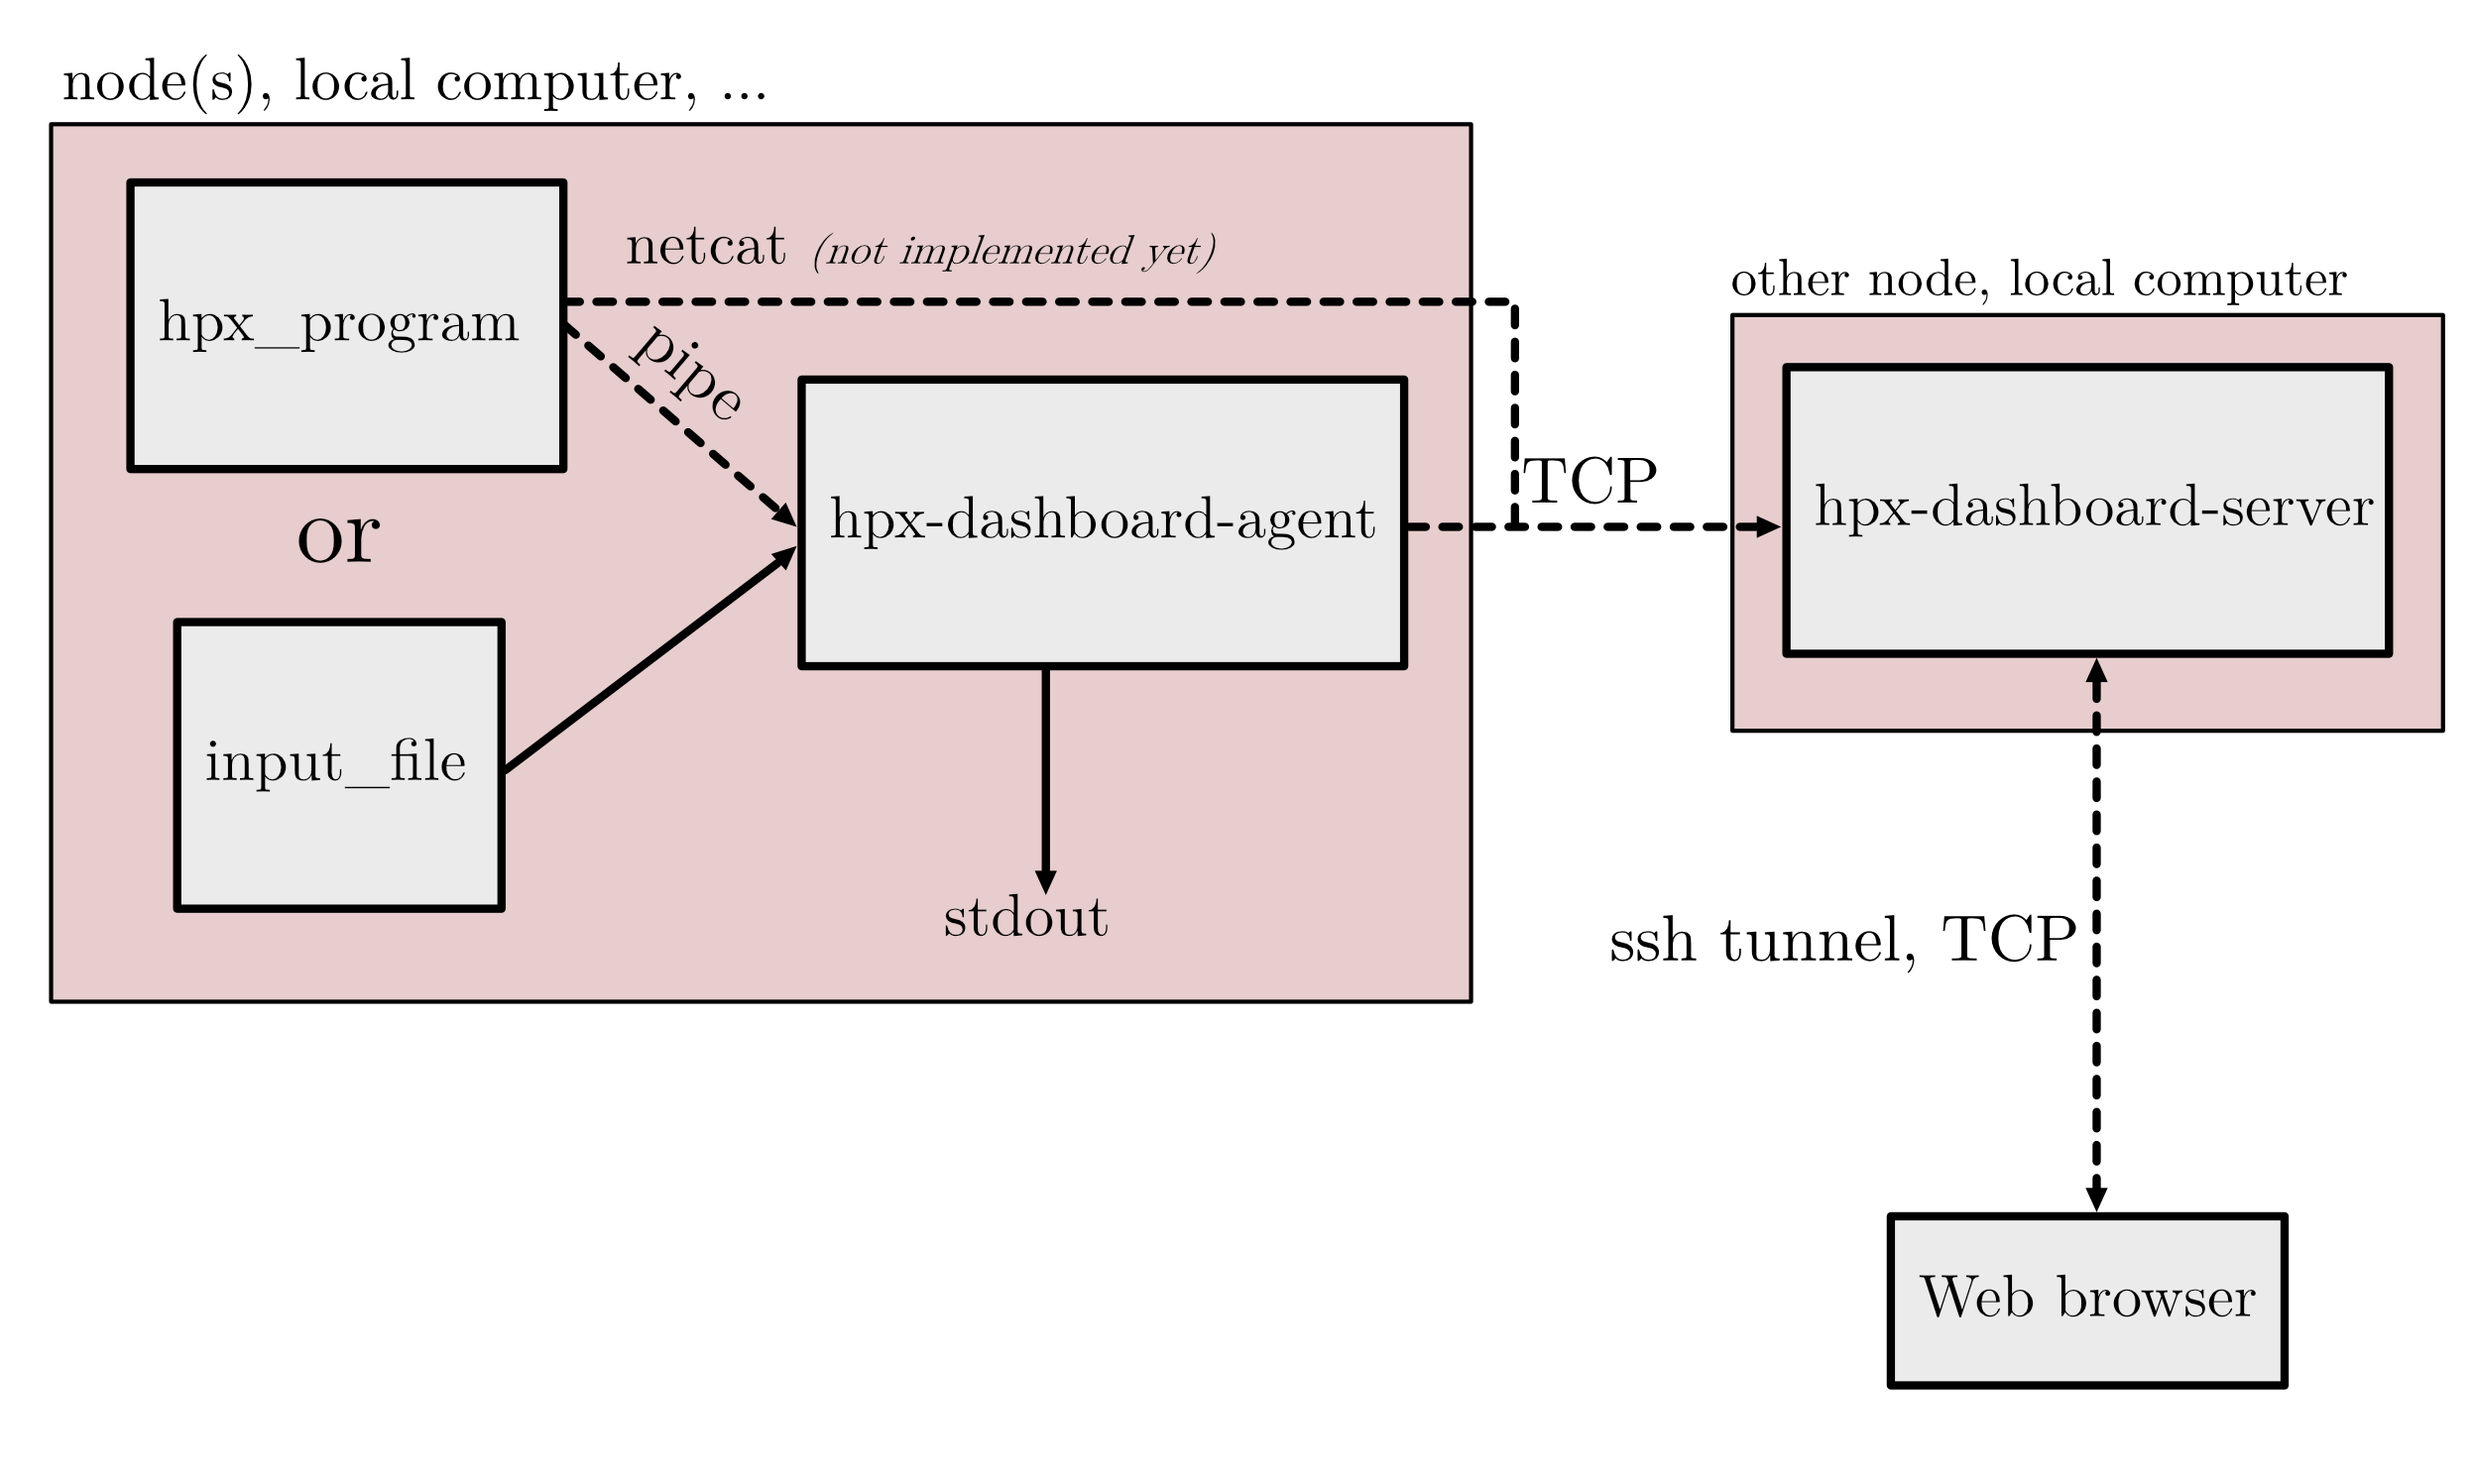
The hpx dashboard is divided into two separate command lines: hpx-dashboard-agent and
hpx-dashboard-server. The role of the agent is to collect the data and parse it. With
the agent, you can filter out hpx data from the standard output and redirect non hpx data to a
file or to the console. The agent connects to the server (also called the plotting server), and
sends data to it through TCP. The server will collect and organise the incoming data. Finally, the
user connects to the plotting server through the web-browser. It is also possible to do the plotting
directly on a jupyter notebook (see documentation).
First start the server with
hpx-dashboard-server, you can then connect with the browser to localhost:5006 and interact with the widgets.
Then launch the hpx program with a performance counter (example program):
1d_stencil_4 --hpx:print-counter=/scheduler/* --hpx:print-counter=/threads/* | hpx-dashboard-agentwhich will automatically send the data to the server.
For building the documentation, Sphinx needs to be installed on the environment. It is necessary that the dashboard is also installed as a package in the same environment for the source code generation.
Install sphinx and the rtd theme:
pip install sphinx sphinx-rtd-themeAnd then build the doc:
cd docs
make html

