🐍🐼📈❤️
This repo supports the blog post
The Easiest Way to Create an Interactive Dashboard in Python. Turn Pandas pipelines into a
dashboard using hvplot .interactive
by Sophia Yang and Marc Skov Madsen
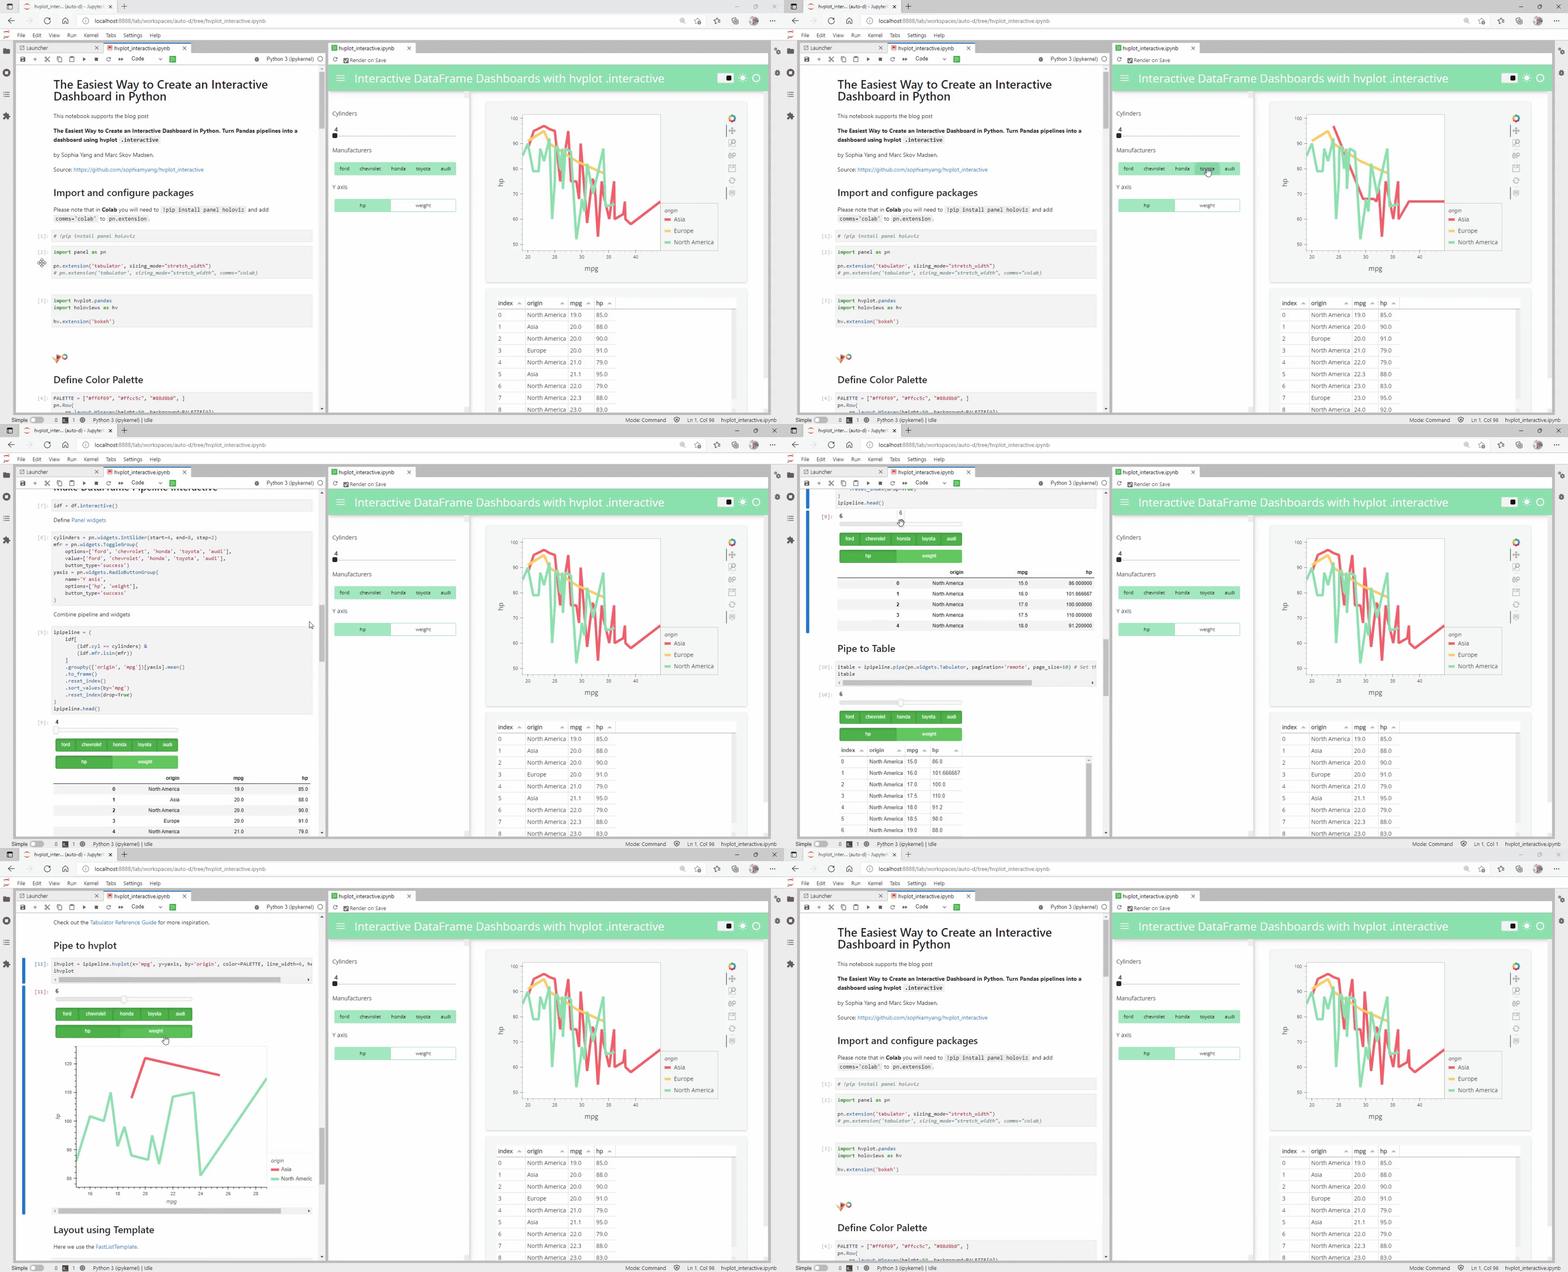
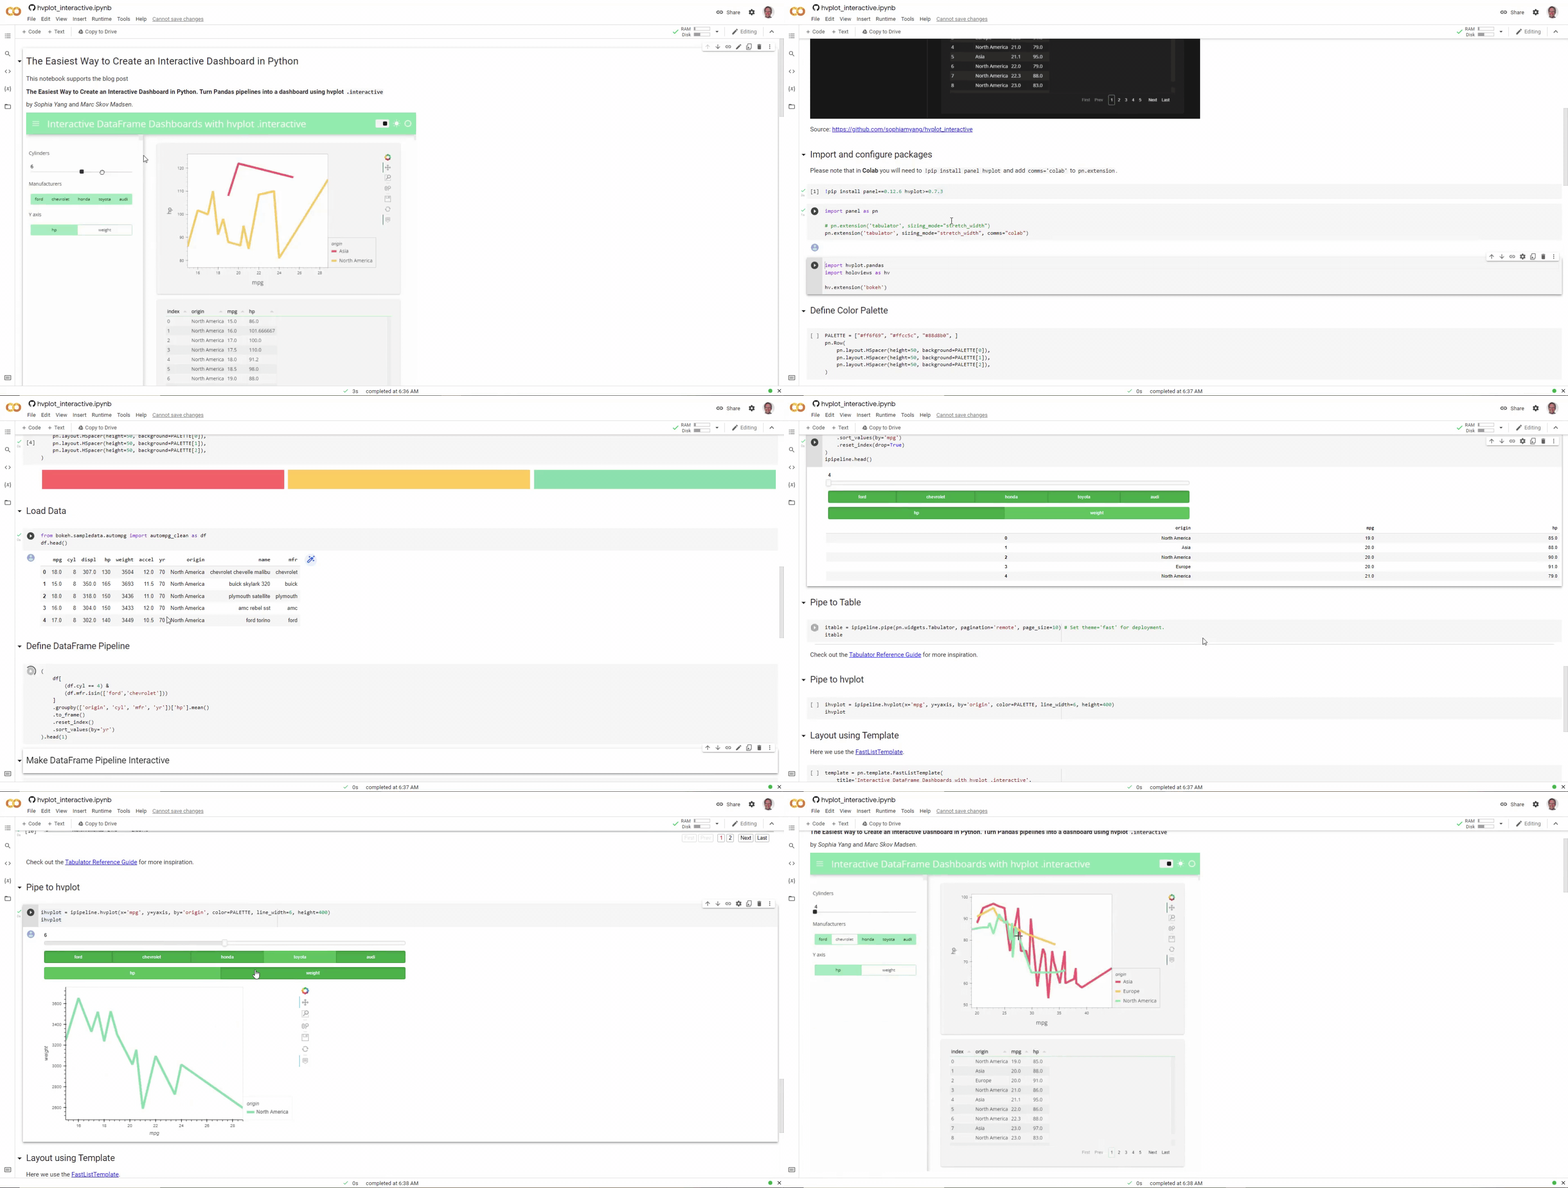
Check out the notebook and app on Binder or in Colab
| Jupyter Notebook | Jupyter Labs | Panel Apps | VS Code | Colab |
|---|---|---|---|---|
You can use either conda or pip. Here we provide the instructions for conda.
conda install -c conda-forge hvplot panel pandas jupyterlabIncludes the Jupyter Preview and jupyter-panel-proxy server. Will also work in VS Code.
conda create --name hvplot_interactive -c conda-forge hvplot panel pandas jupyterlab jupyter-panel-proxy jupyter_bokeh
conda activate hvplot_interactive
jupyter serverextension enable panel.io.jupyter_server_extensionTo run the notebook
jupyter lab hvplot_interactive.ipynbIf you installed jupyter-panel-proxy, then (on unix based systems) you can open the app at
http://localhost:8888/panel/
To serve the app with auto reload you can run
panel serve hvplot_interactive.ipynb --autoreload --showThe app will appear at http://localhost:5006/hvplot_interactive
To work with Panel and hvplot in VS Code in Binder you will need to set the python and Jupyter interpreter to notebook before you open the notebook.
On the back of this work we created or updated the following Issues
On the back of this work we created or updated the following Features


