COVID Data Analysis
Jonathan Gilligan
covid-data
Description
This is a collection of R scripts that I use for plotting daily and weekly COVID-19 data (case counts and deaths) for counties in the United States. These scripts use the data collected and curated by the Johns Hopkins Center for Systems Science and Engineering (CSSE), which the Center kindly makes available at https://github.com/CSSEGISandData/COVID-19.
To use these scripts, initialize by running the function startup(),
which downloads the latest data from GitHub and prepares it for use. You
can get data for one or more states or counties with select_data() or
rural_data().
-
select_data()allows you to specify one or more states or one or more counties within a single state. If you call it with no arguments, it will return data for the whole US. -
rural_data()allows you to look at data only from rural counties in one or more states. -
I plot data using
plot_time_series(), which has a number of options to control the way that the data is plotted.
Examples
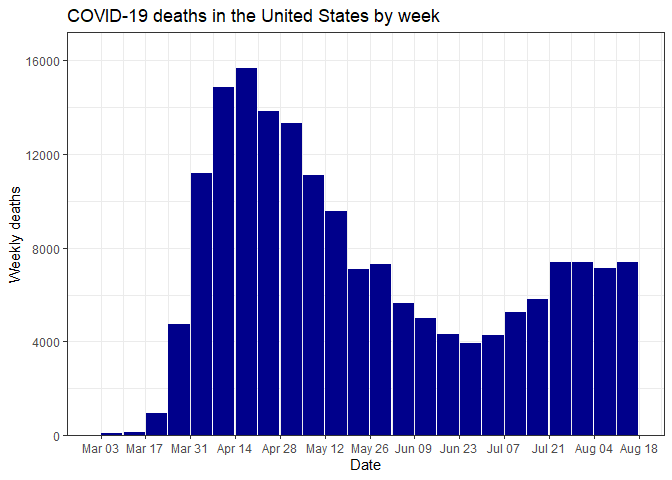
Plot weekly COVID-19 deaths for the whole US:
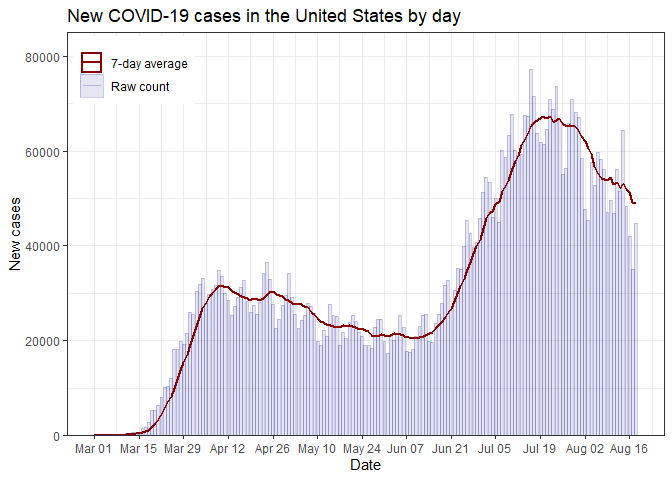
select_data() %>% plot_time_series("deaths")Plot daily new cases for the whole US
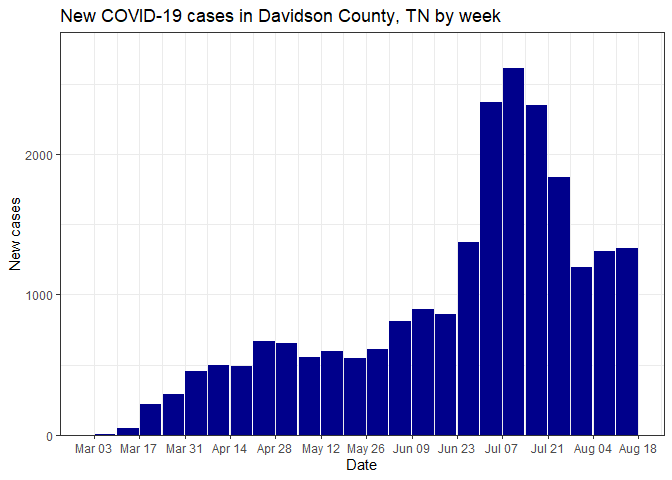
select_data() %>% plot_time_series("cases", weekly = FALSE)Plot weekly case data for a single county (Davidson County, TN)
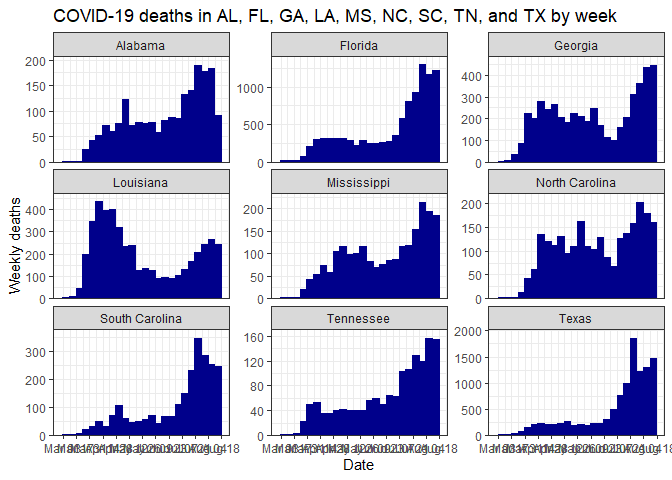
select_data("TN", "Davidson") %>% plot_time_series("cases", weekly = TRUE)Make a facet plot for multiple states:
select_data(c("TX", "LA", "MS", "AL", "FL", "GA", "SC", "NC", "TN")) %>%
  plot_time_series("deaths", facet = TRUE)
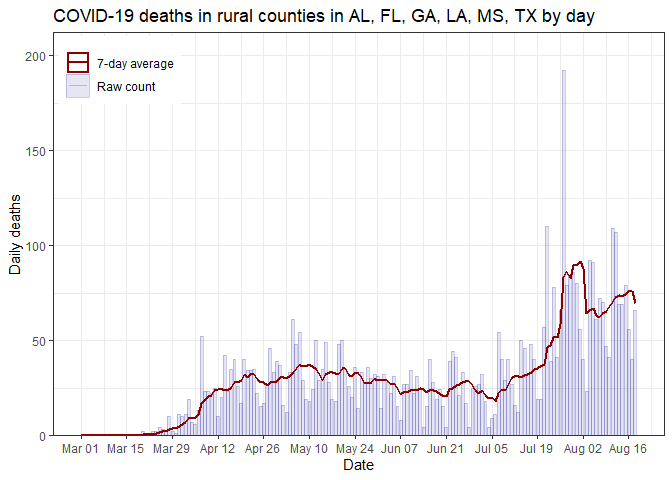
Make a plot for rural counties in several states:
rural_data(c("TX", "LA", "MS", "AL", "FL", "GA")) %>%
  plot_time_series("deaths", weekly = FALSE)