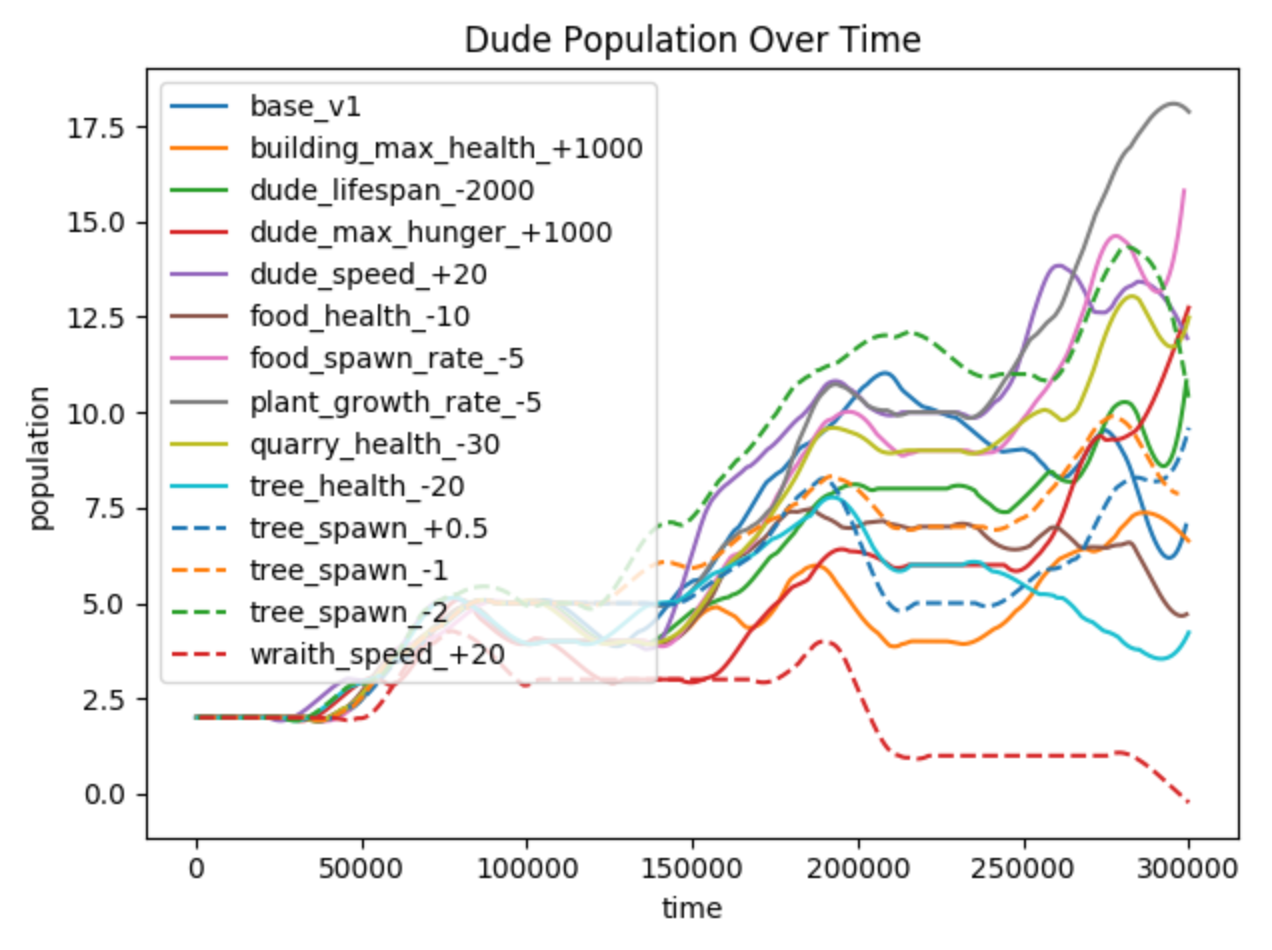
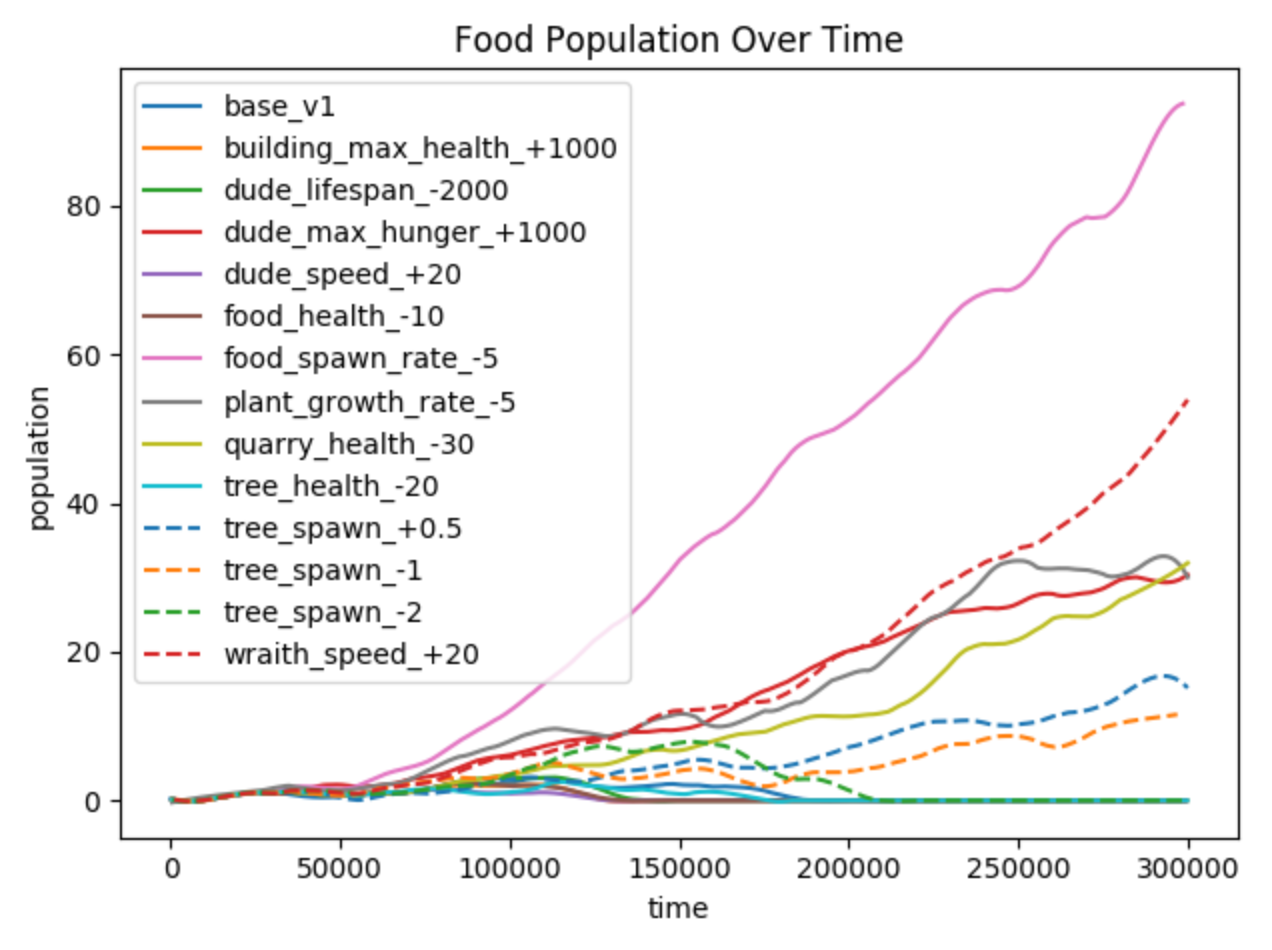
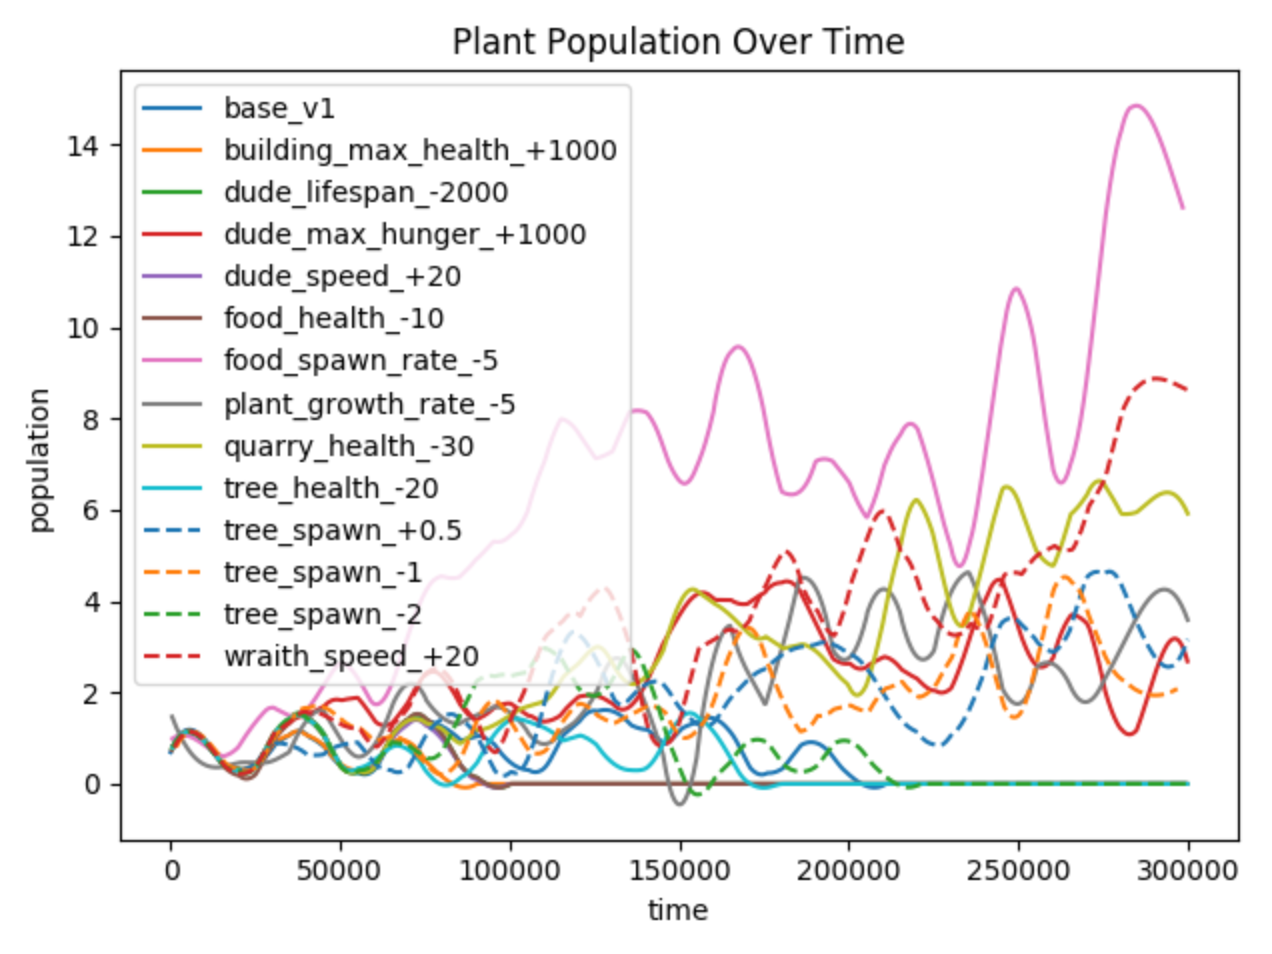
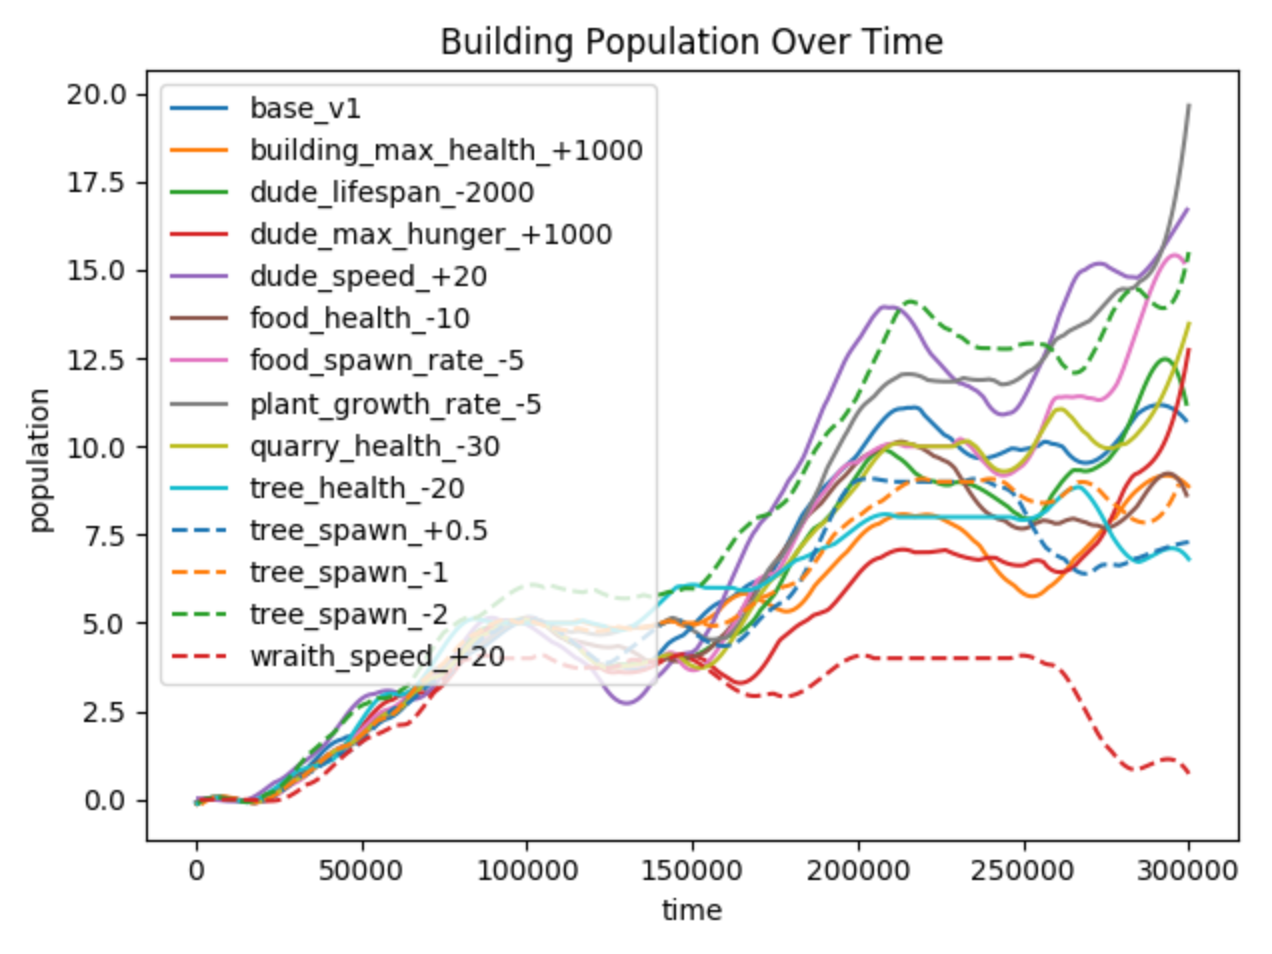
This repository features an unsupervised analysis of emergent game data (which can be viewed here), written in Python. It includes various tools for the pre-processing of game data and the generation of visualisations.
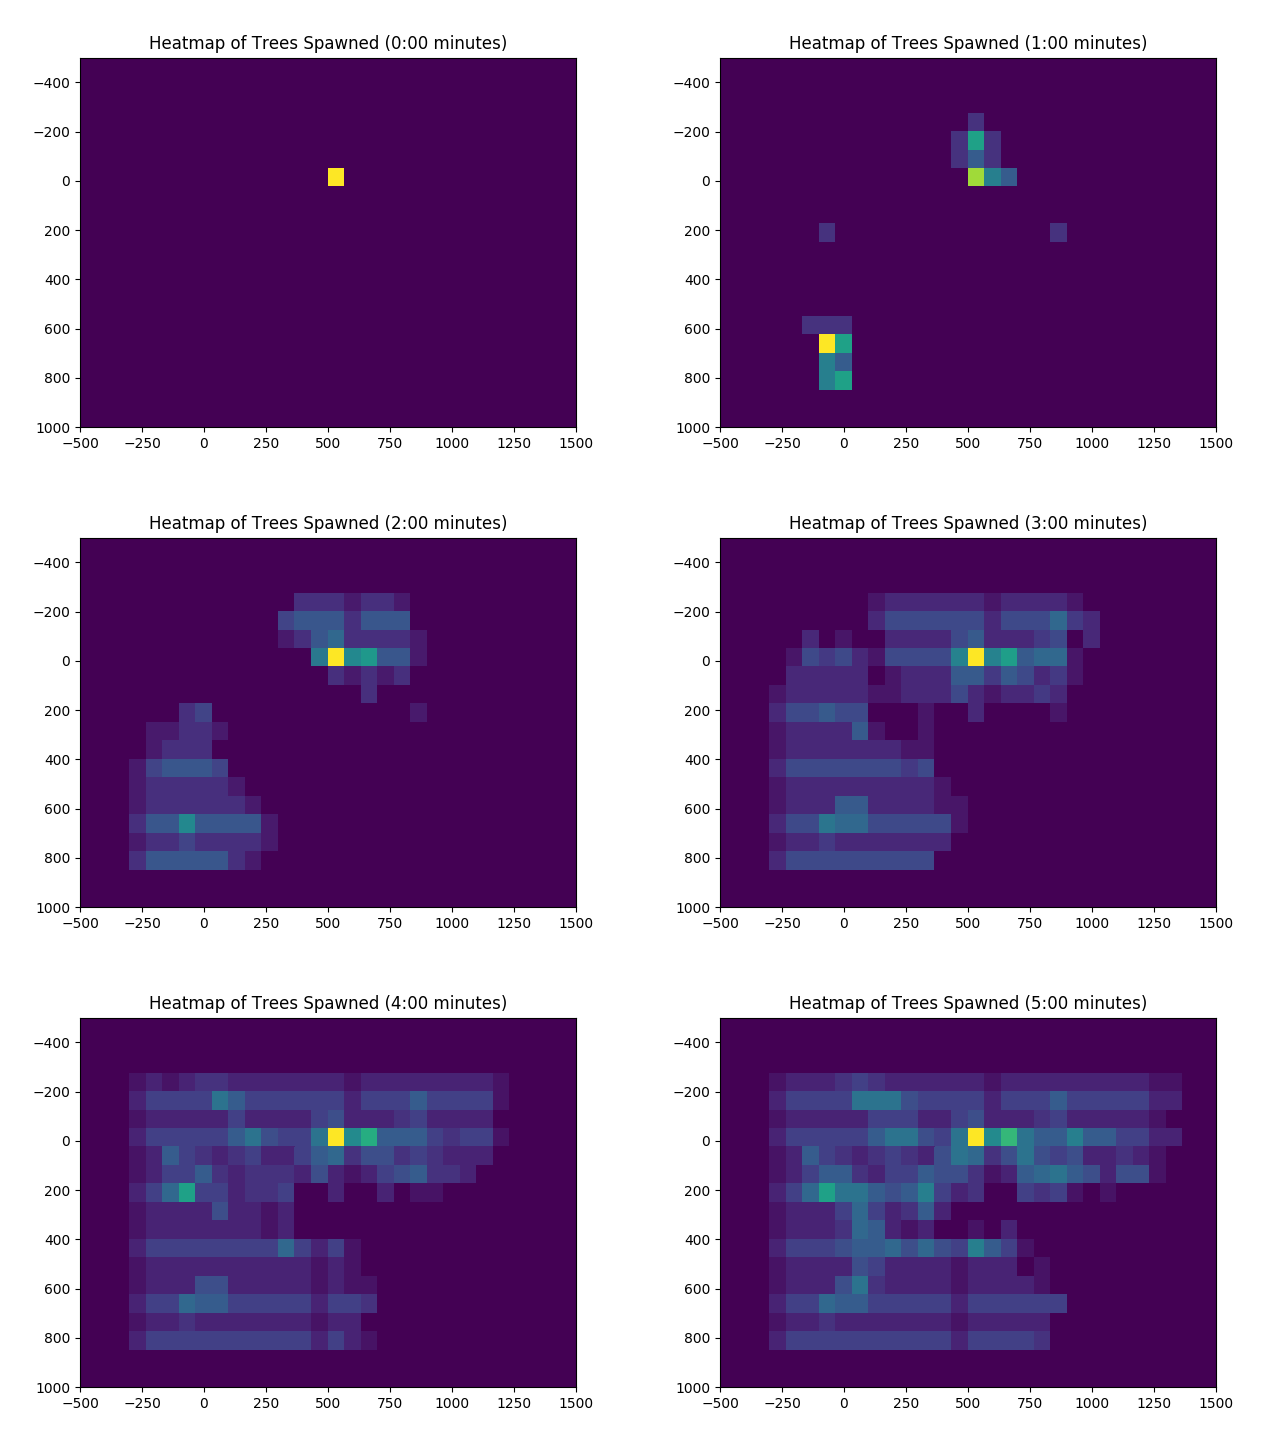
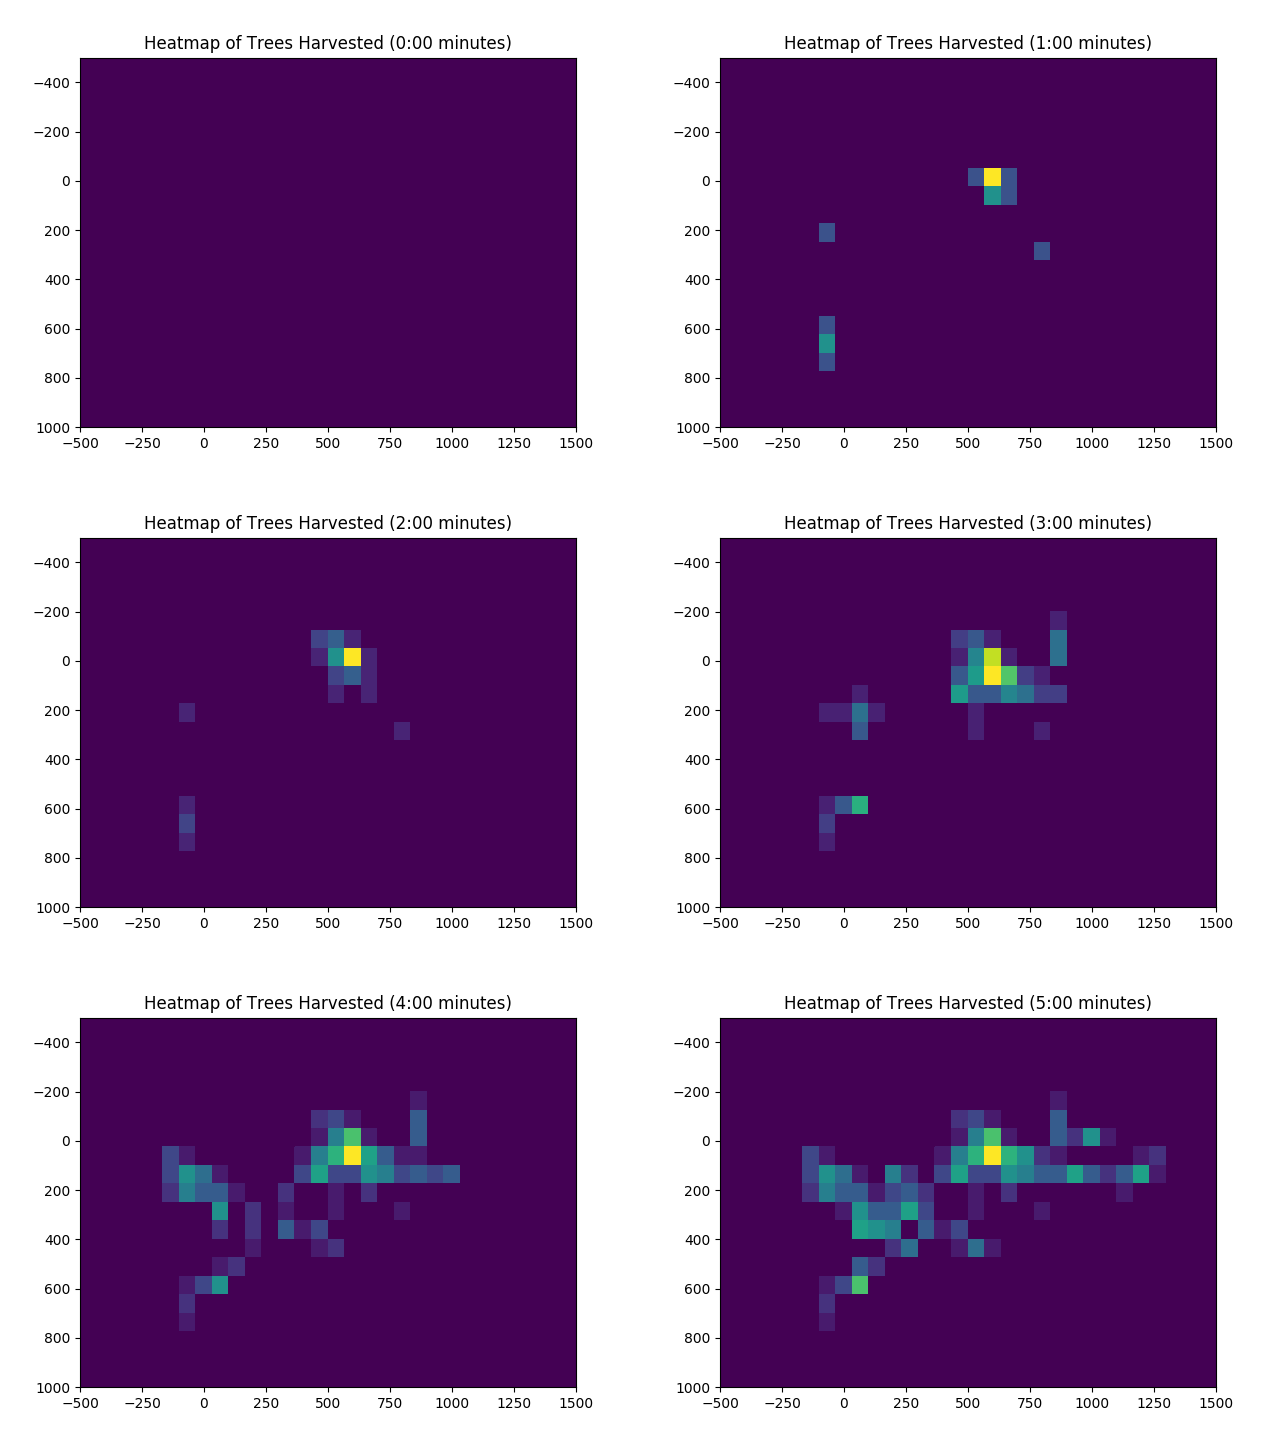
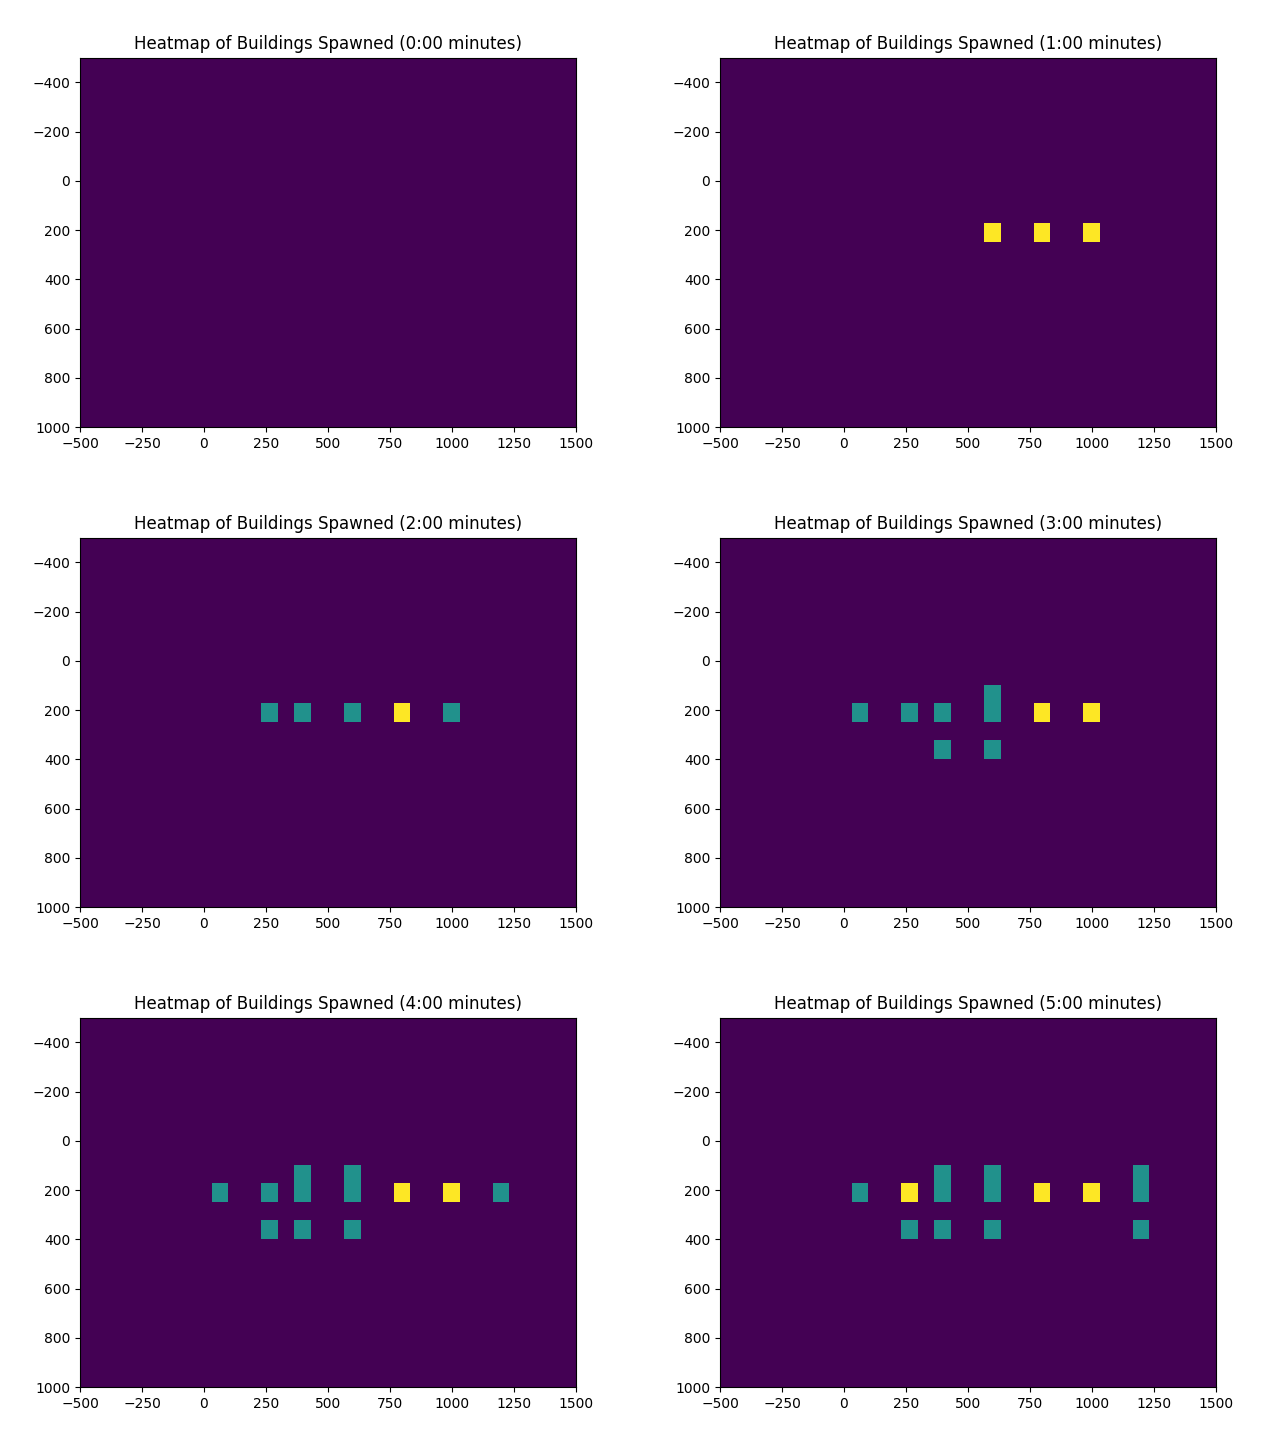
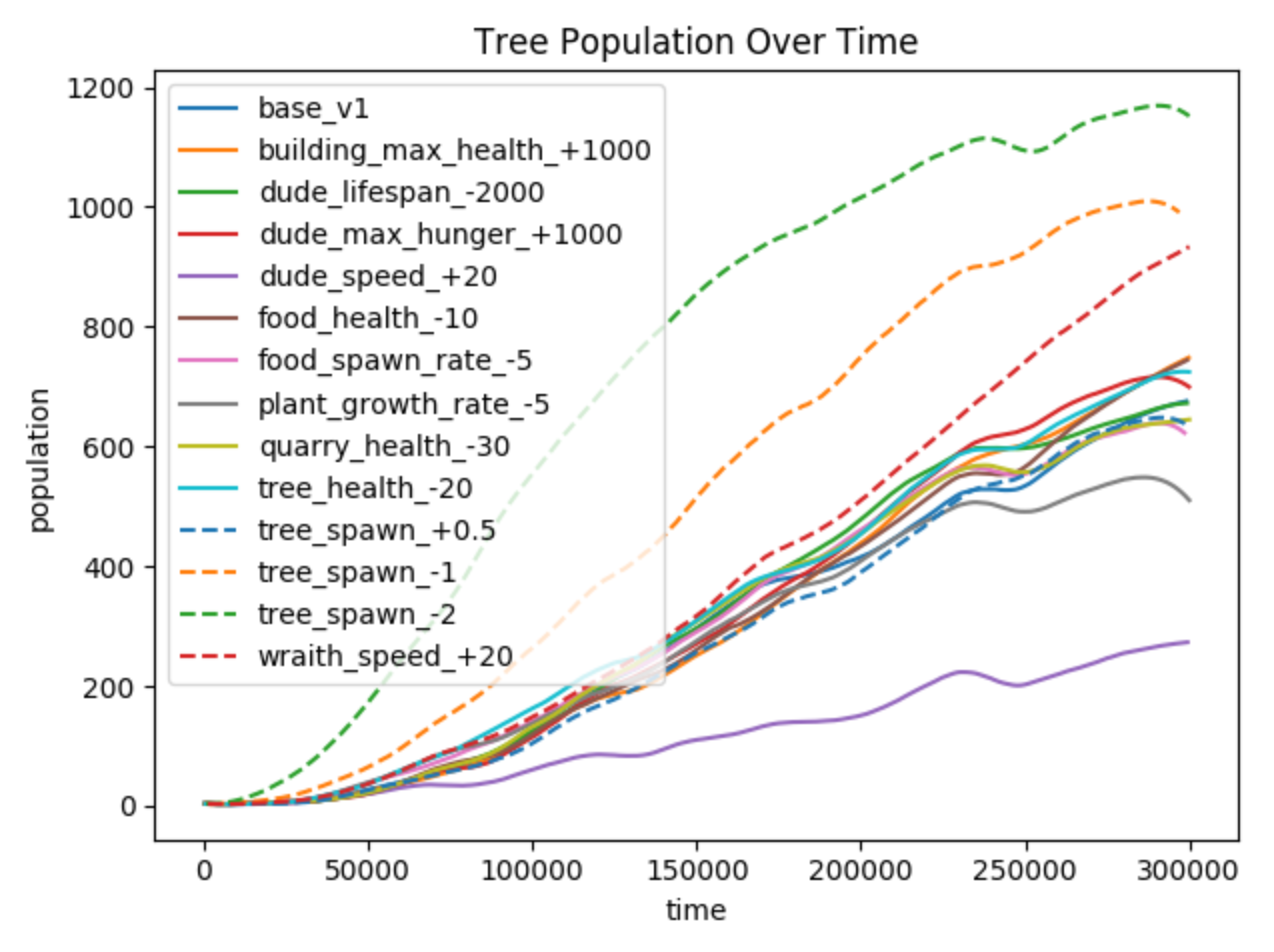
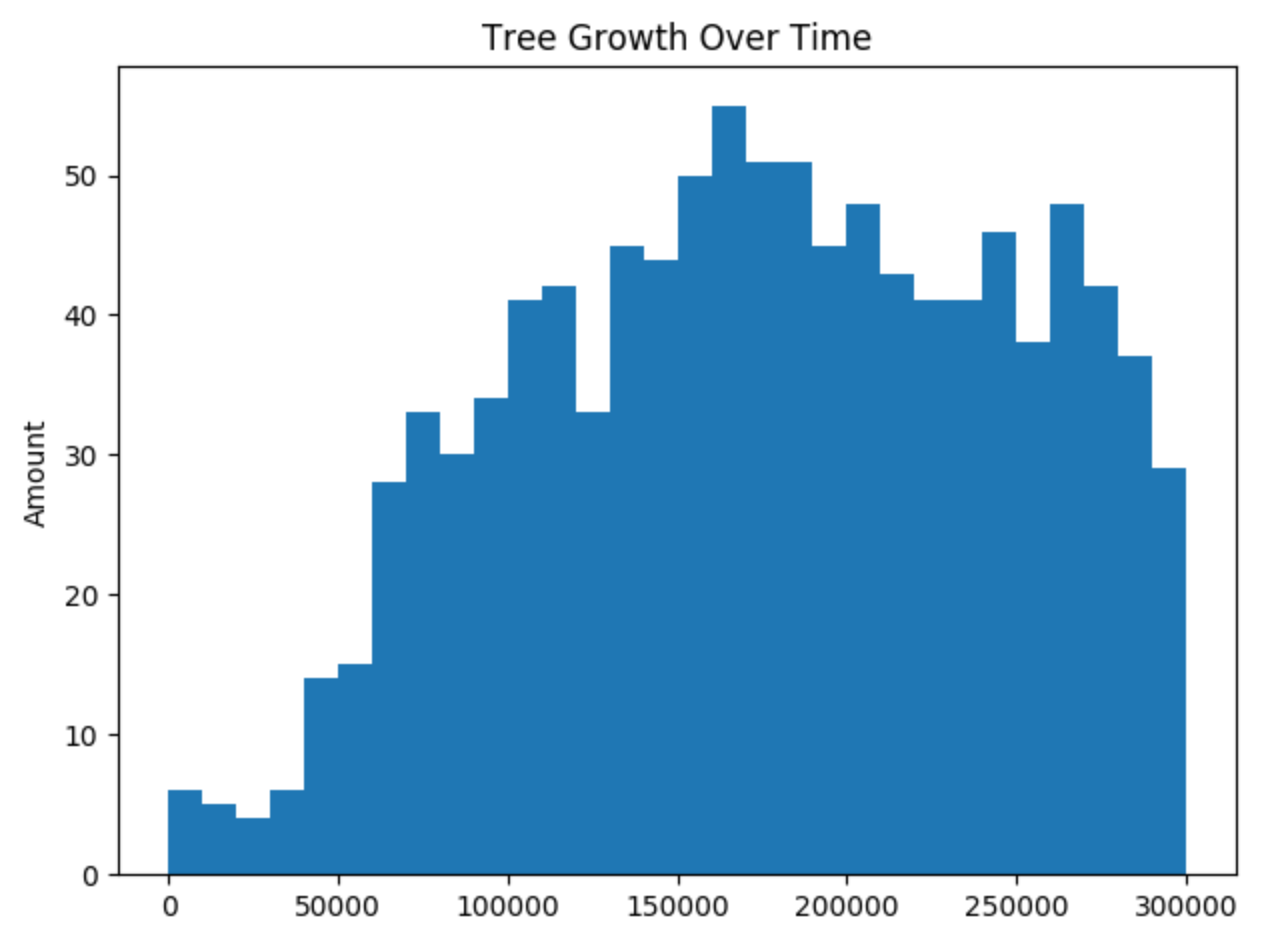
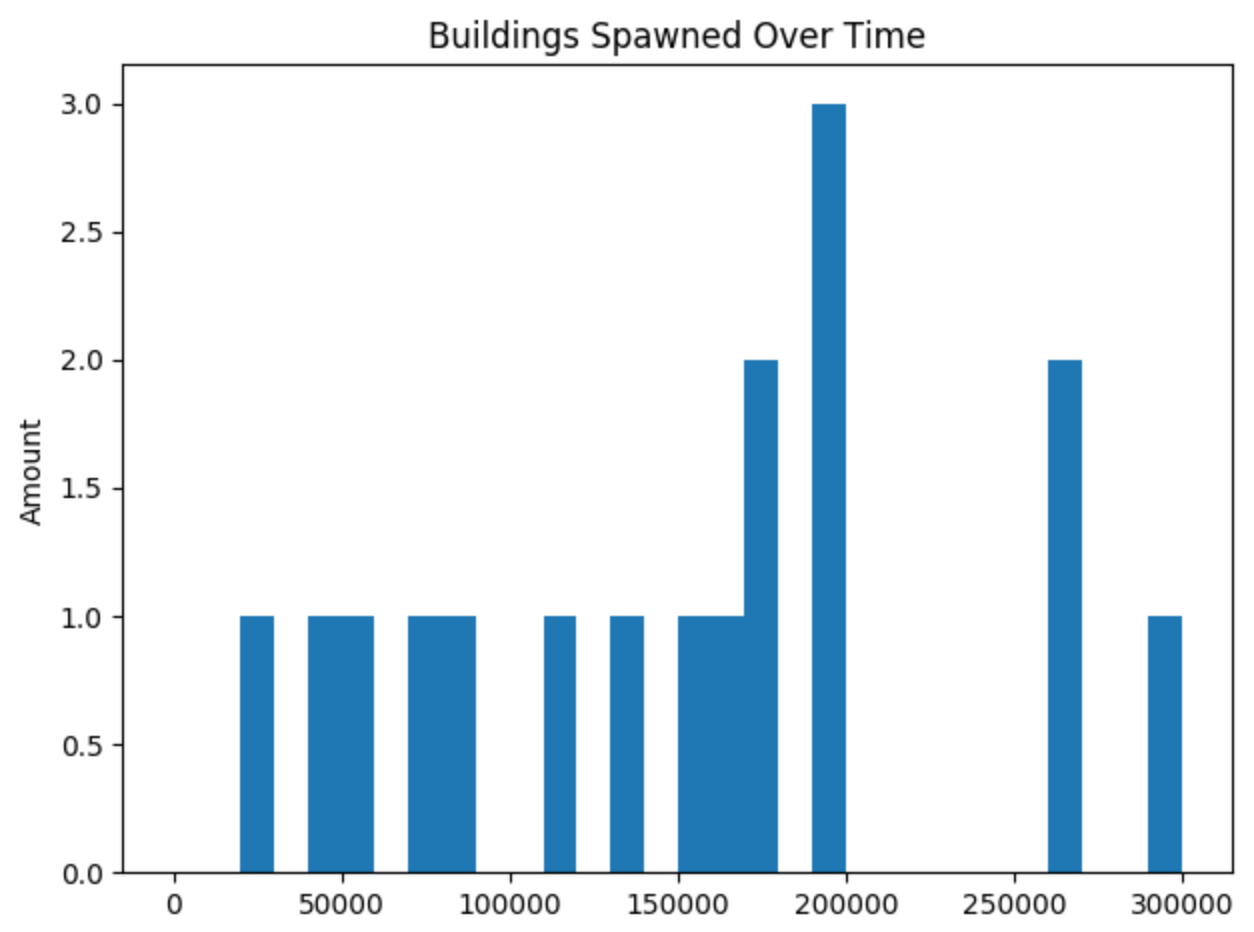
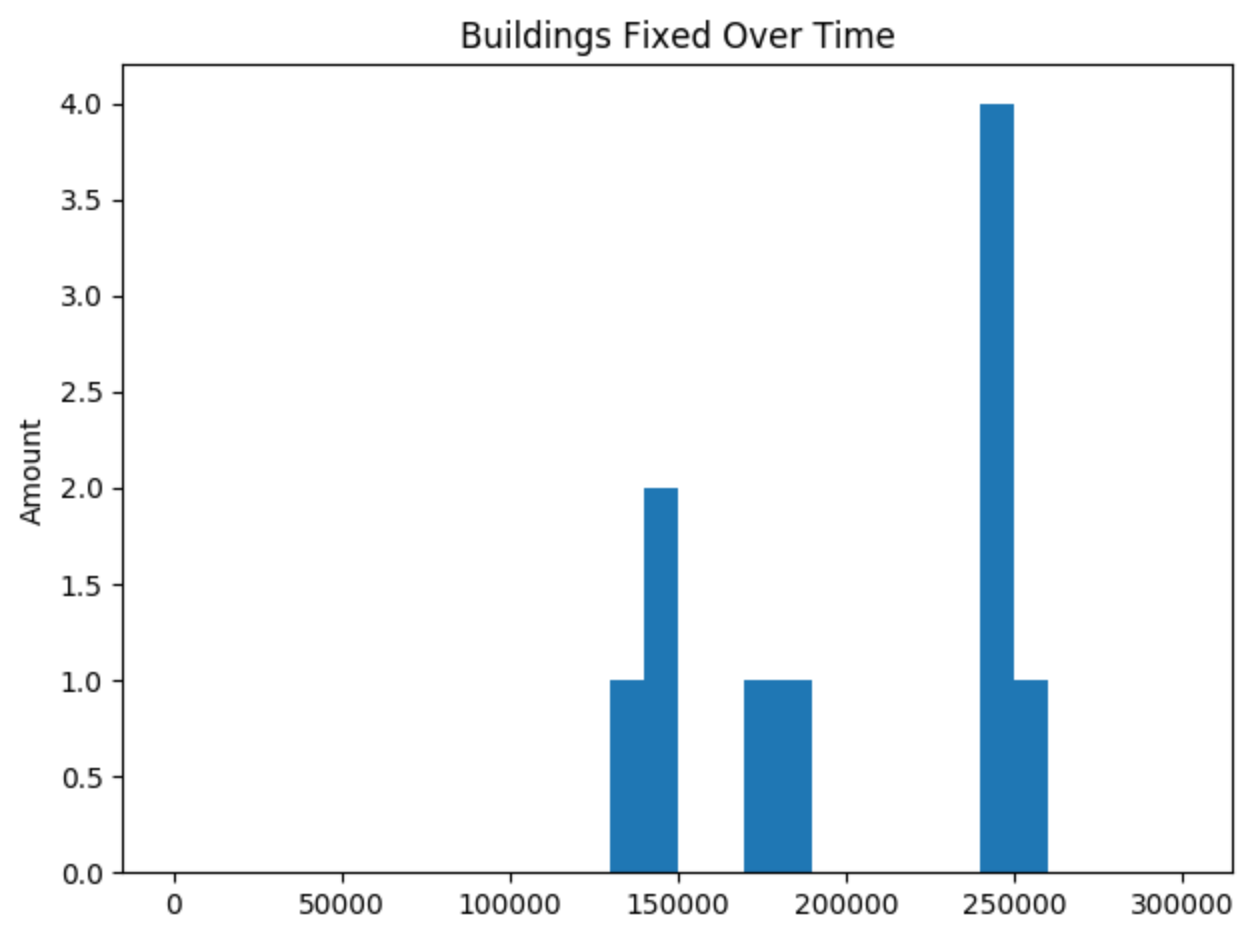
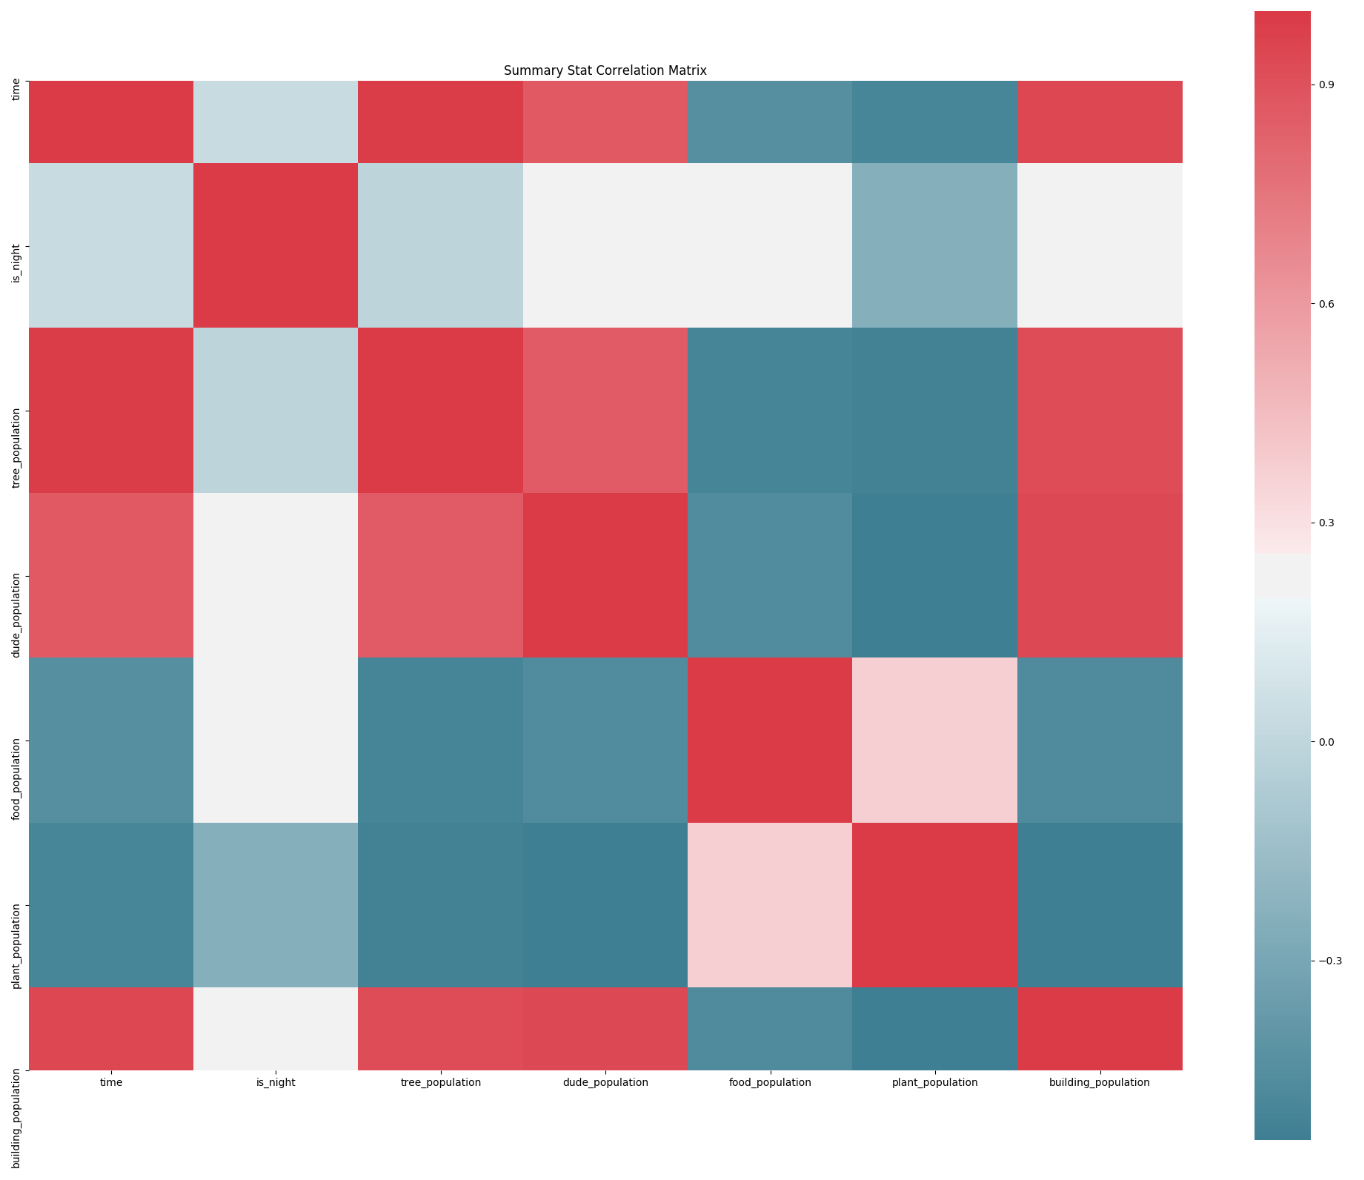
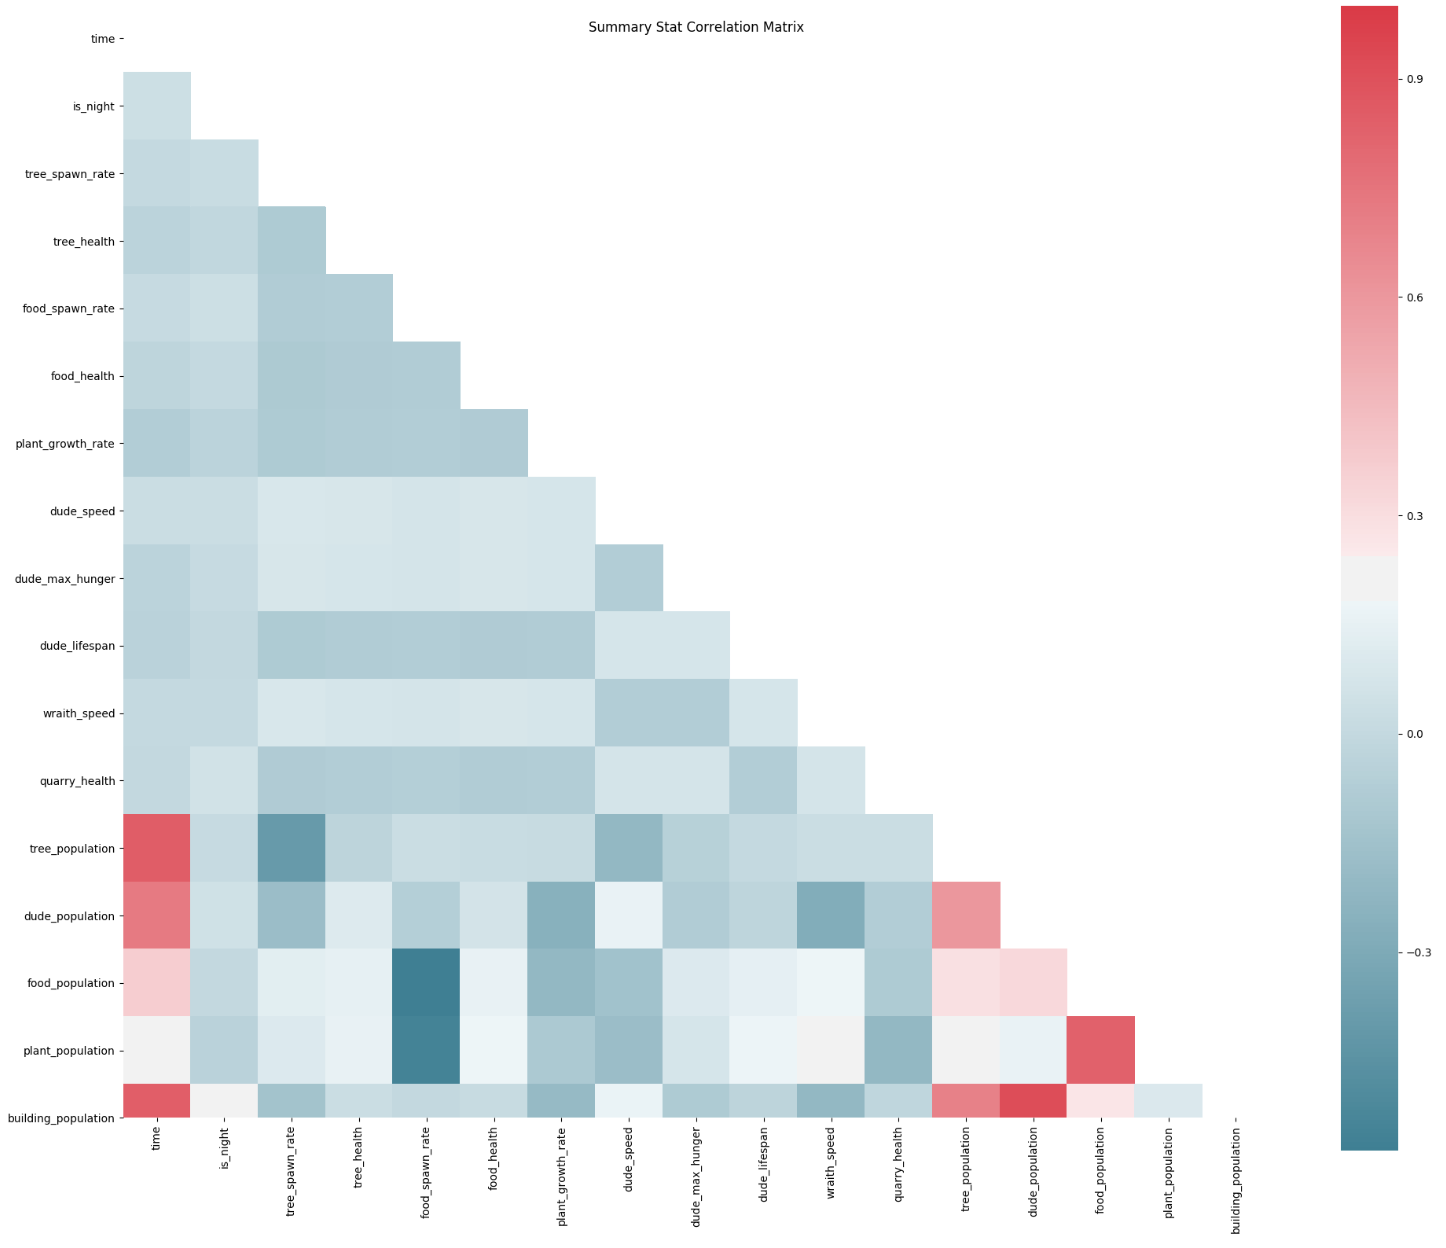
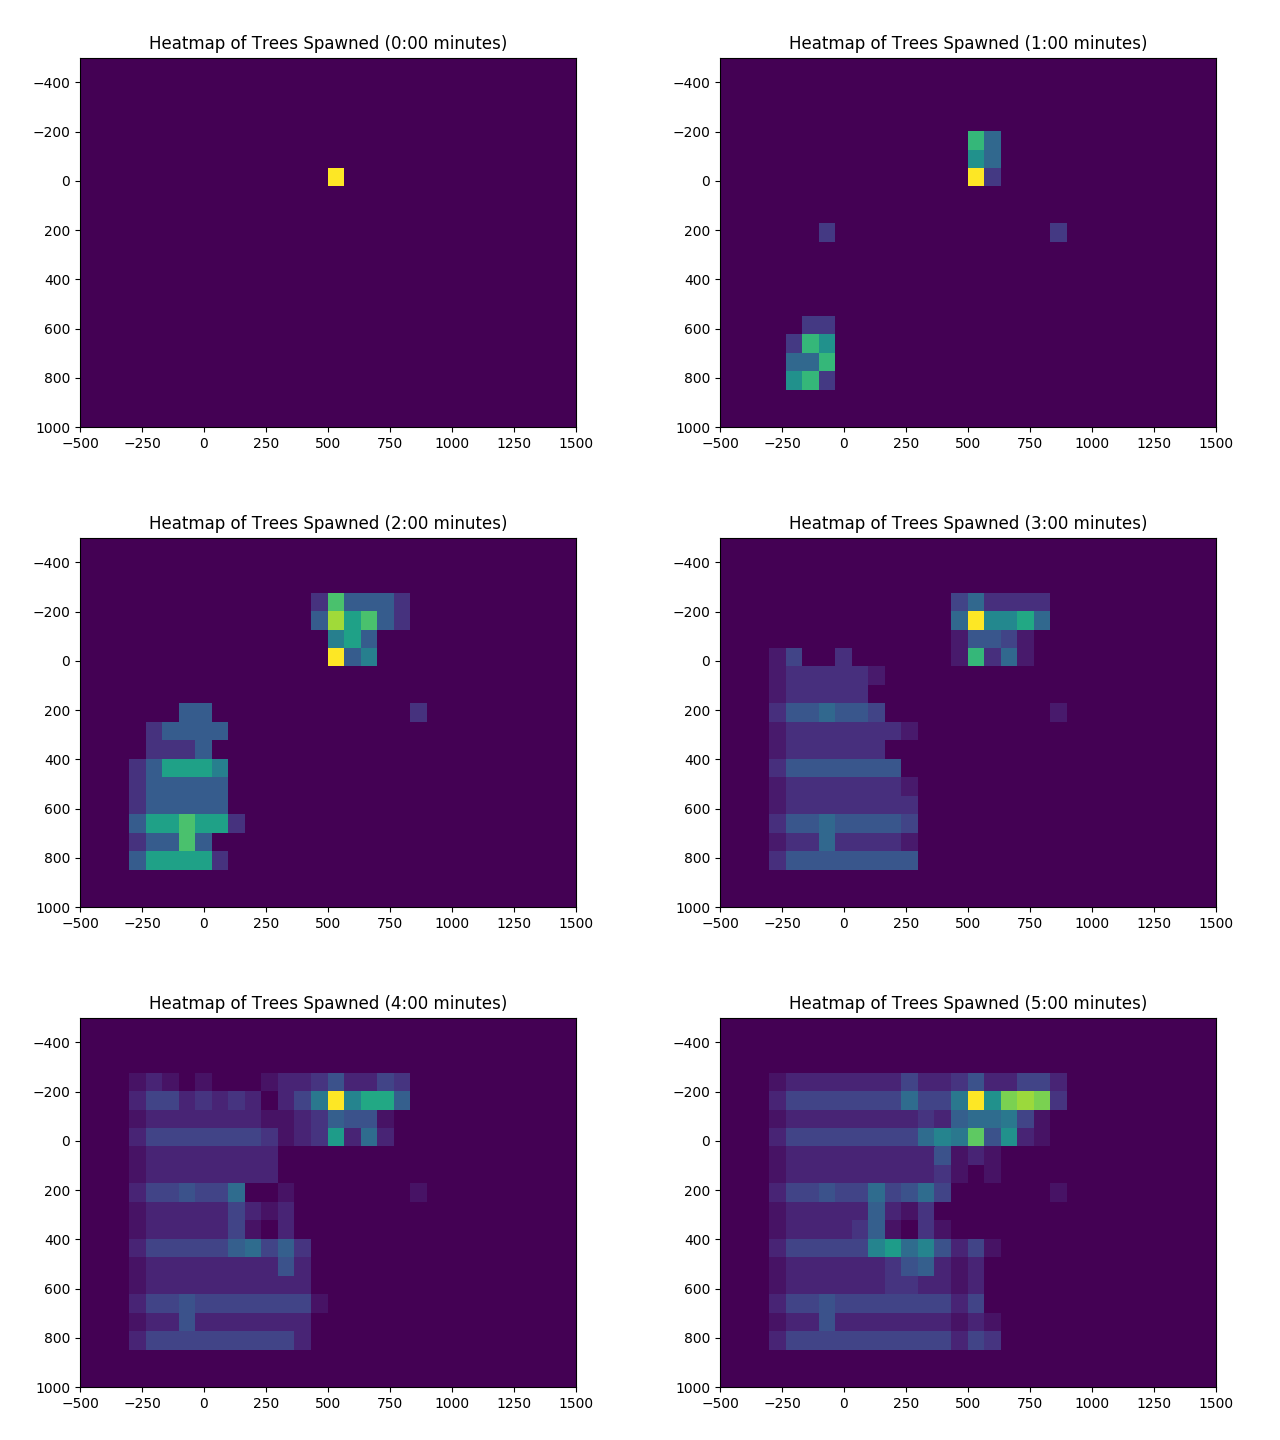
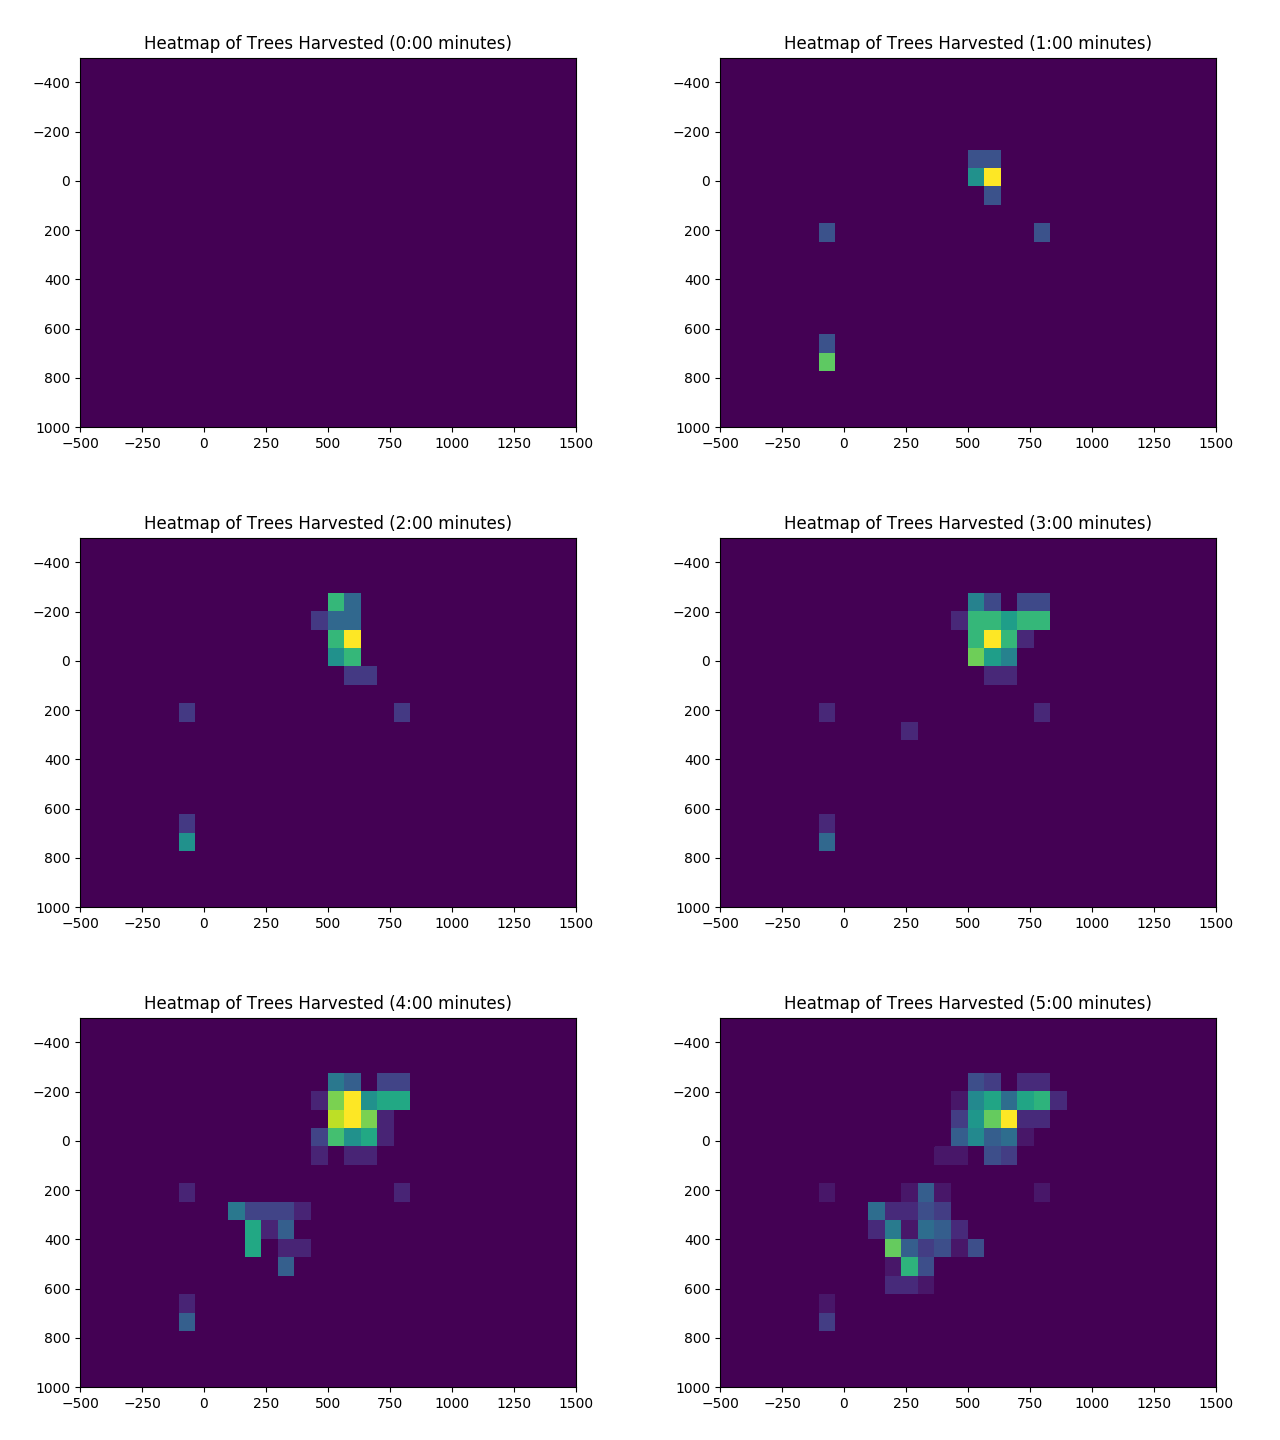
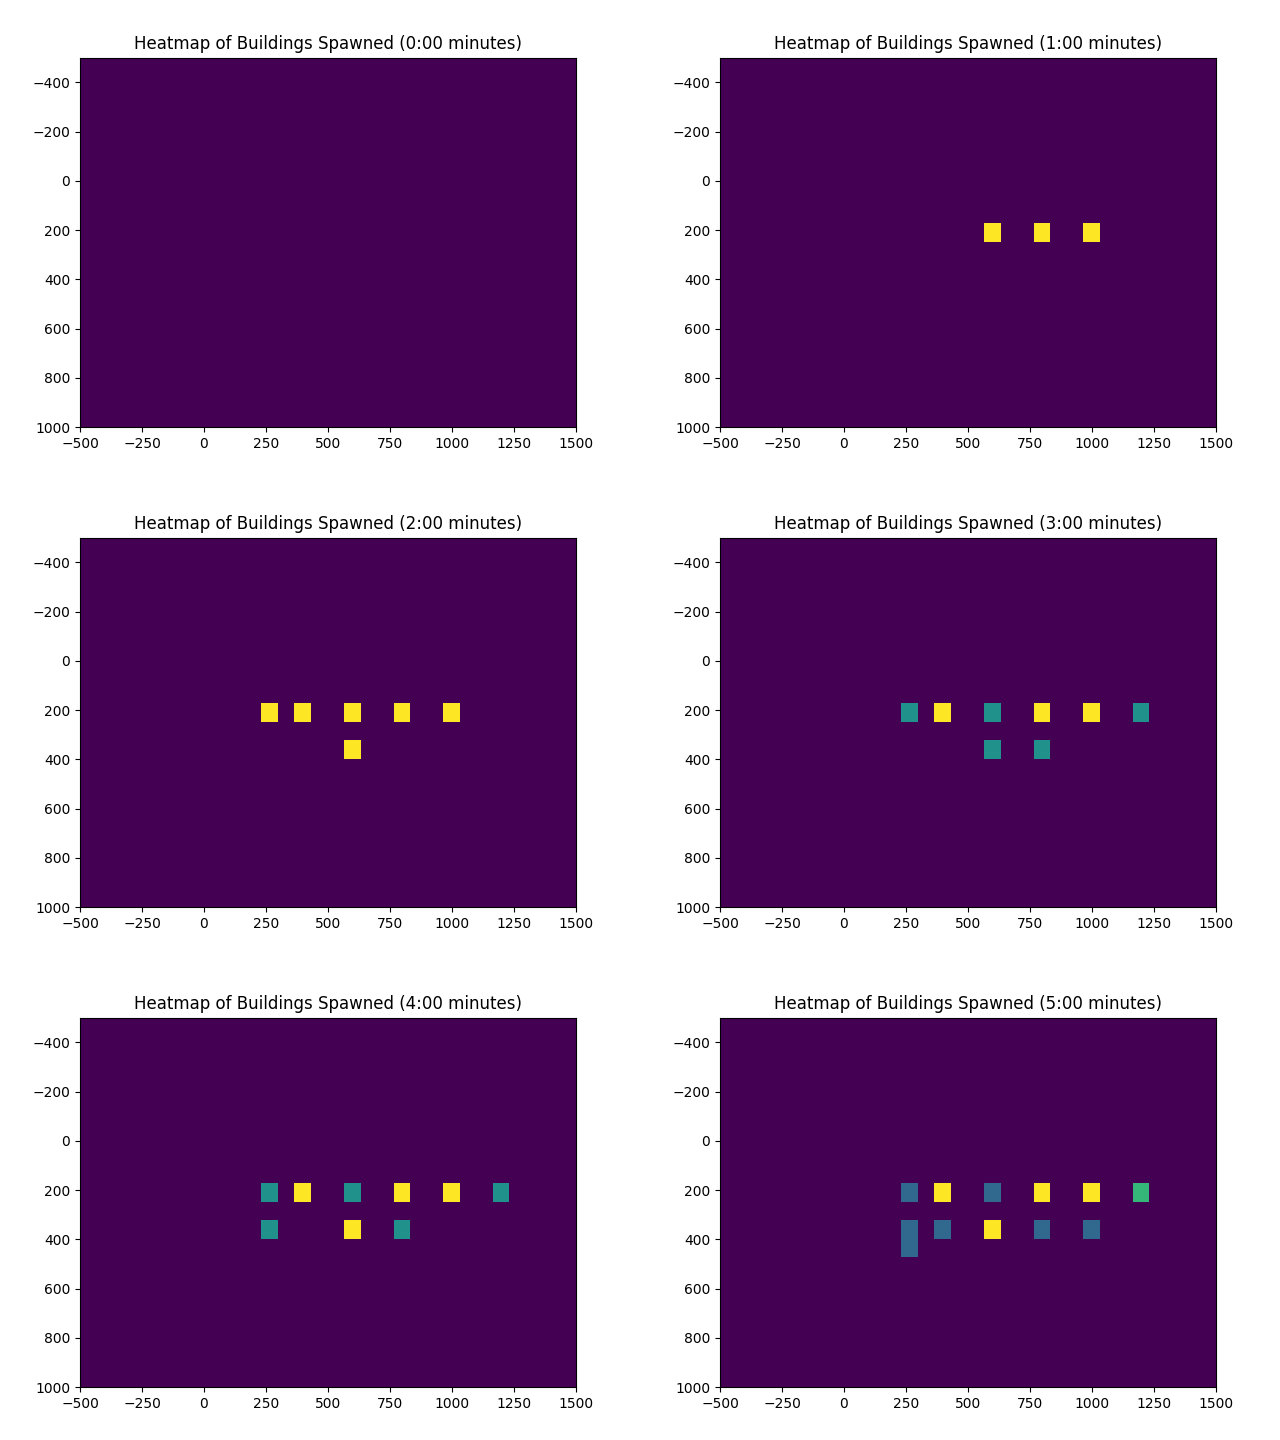
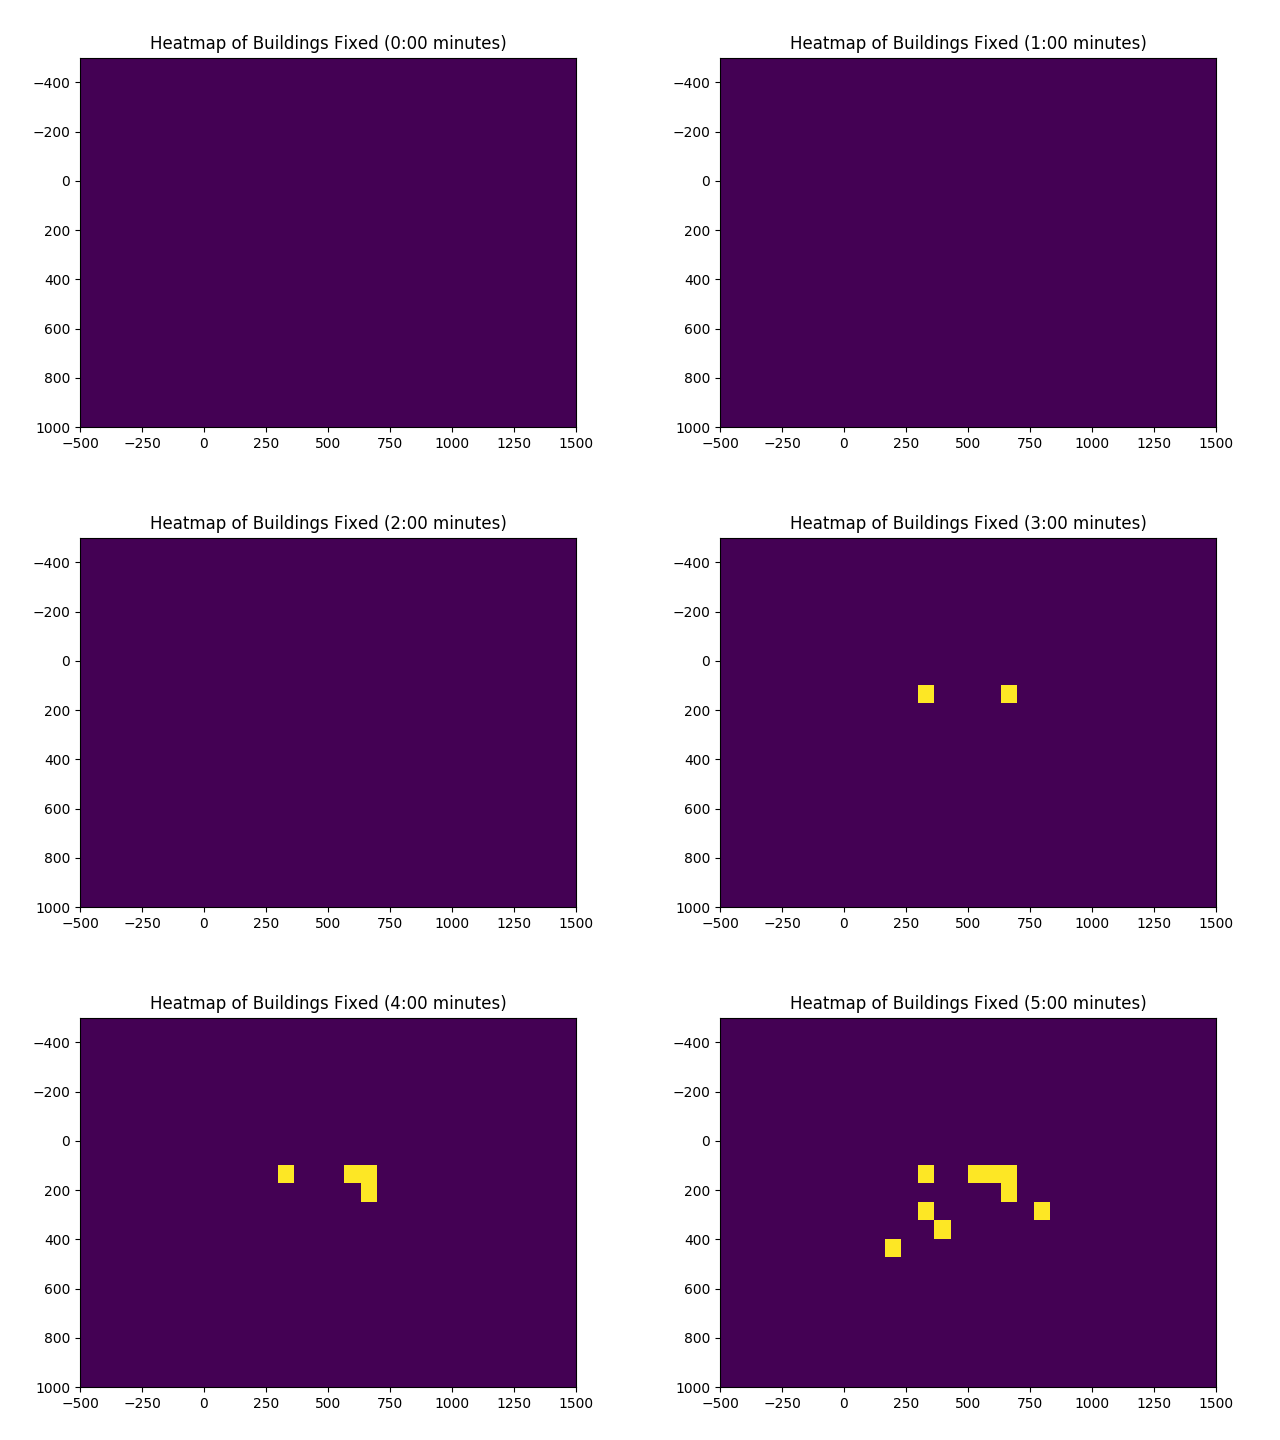
The first iteration of the experiment's codebase can be viewed under the "v1" tag, which is defined in the below visuals as test base_v1. Each other test is denoted by the format of <feature_name>_<value_change> so for instance, a test increasing player speed by 20 would be written as player_speed_+20. The animated heatmaps and histograms are only generated for base_v1 and the correlation matrices include all test results.
The second iteration of the experiment's codebase can be viewed under the "v2" tag, which is defined in the below visuals as test base_v2. It utilises the combination of features from the tests:
- dude_speed_+20
- plant_growth_rate_-5
Using this information, the plant growth rate was reduced from 15 seconds by 5 seconds and the speed of dudes was increased by 10 (only half of the amount it was increased by in the test). This resulted in the preservation of food and tree populations as well as the reduction of tree growth to under 500 instances.
The third iteration of the experiment's codebase can be viewed under the "v3" tag, which is defined in the below visuals as test base_v3. It utilises the combination of features from the tests:
- tree_spawn_+0.4
- quarry_health_-30
- food_spawn_rate_-1
An issue identified in base_v2 was that it created an overabundance of food. Using the information found, this value was greatly reduced while preserving tree growth.
The final results for the analysis are shown below, highlighting all three base versions to illustrate the changes to the game's balance over time.
