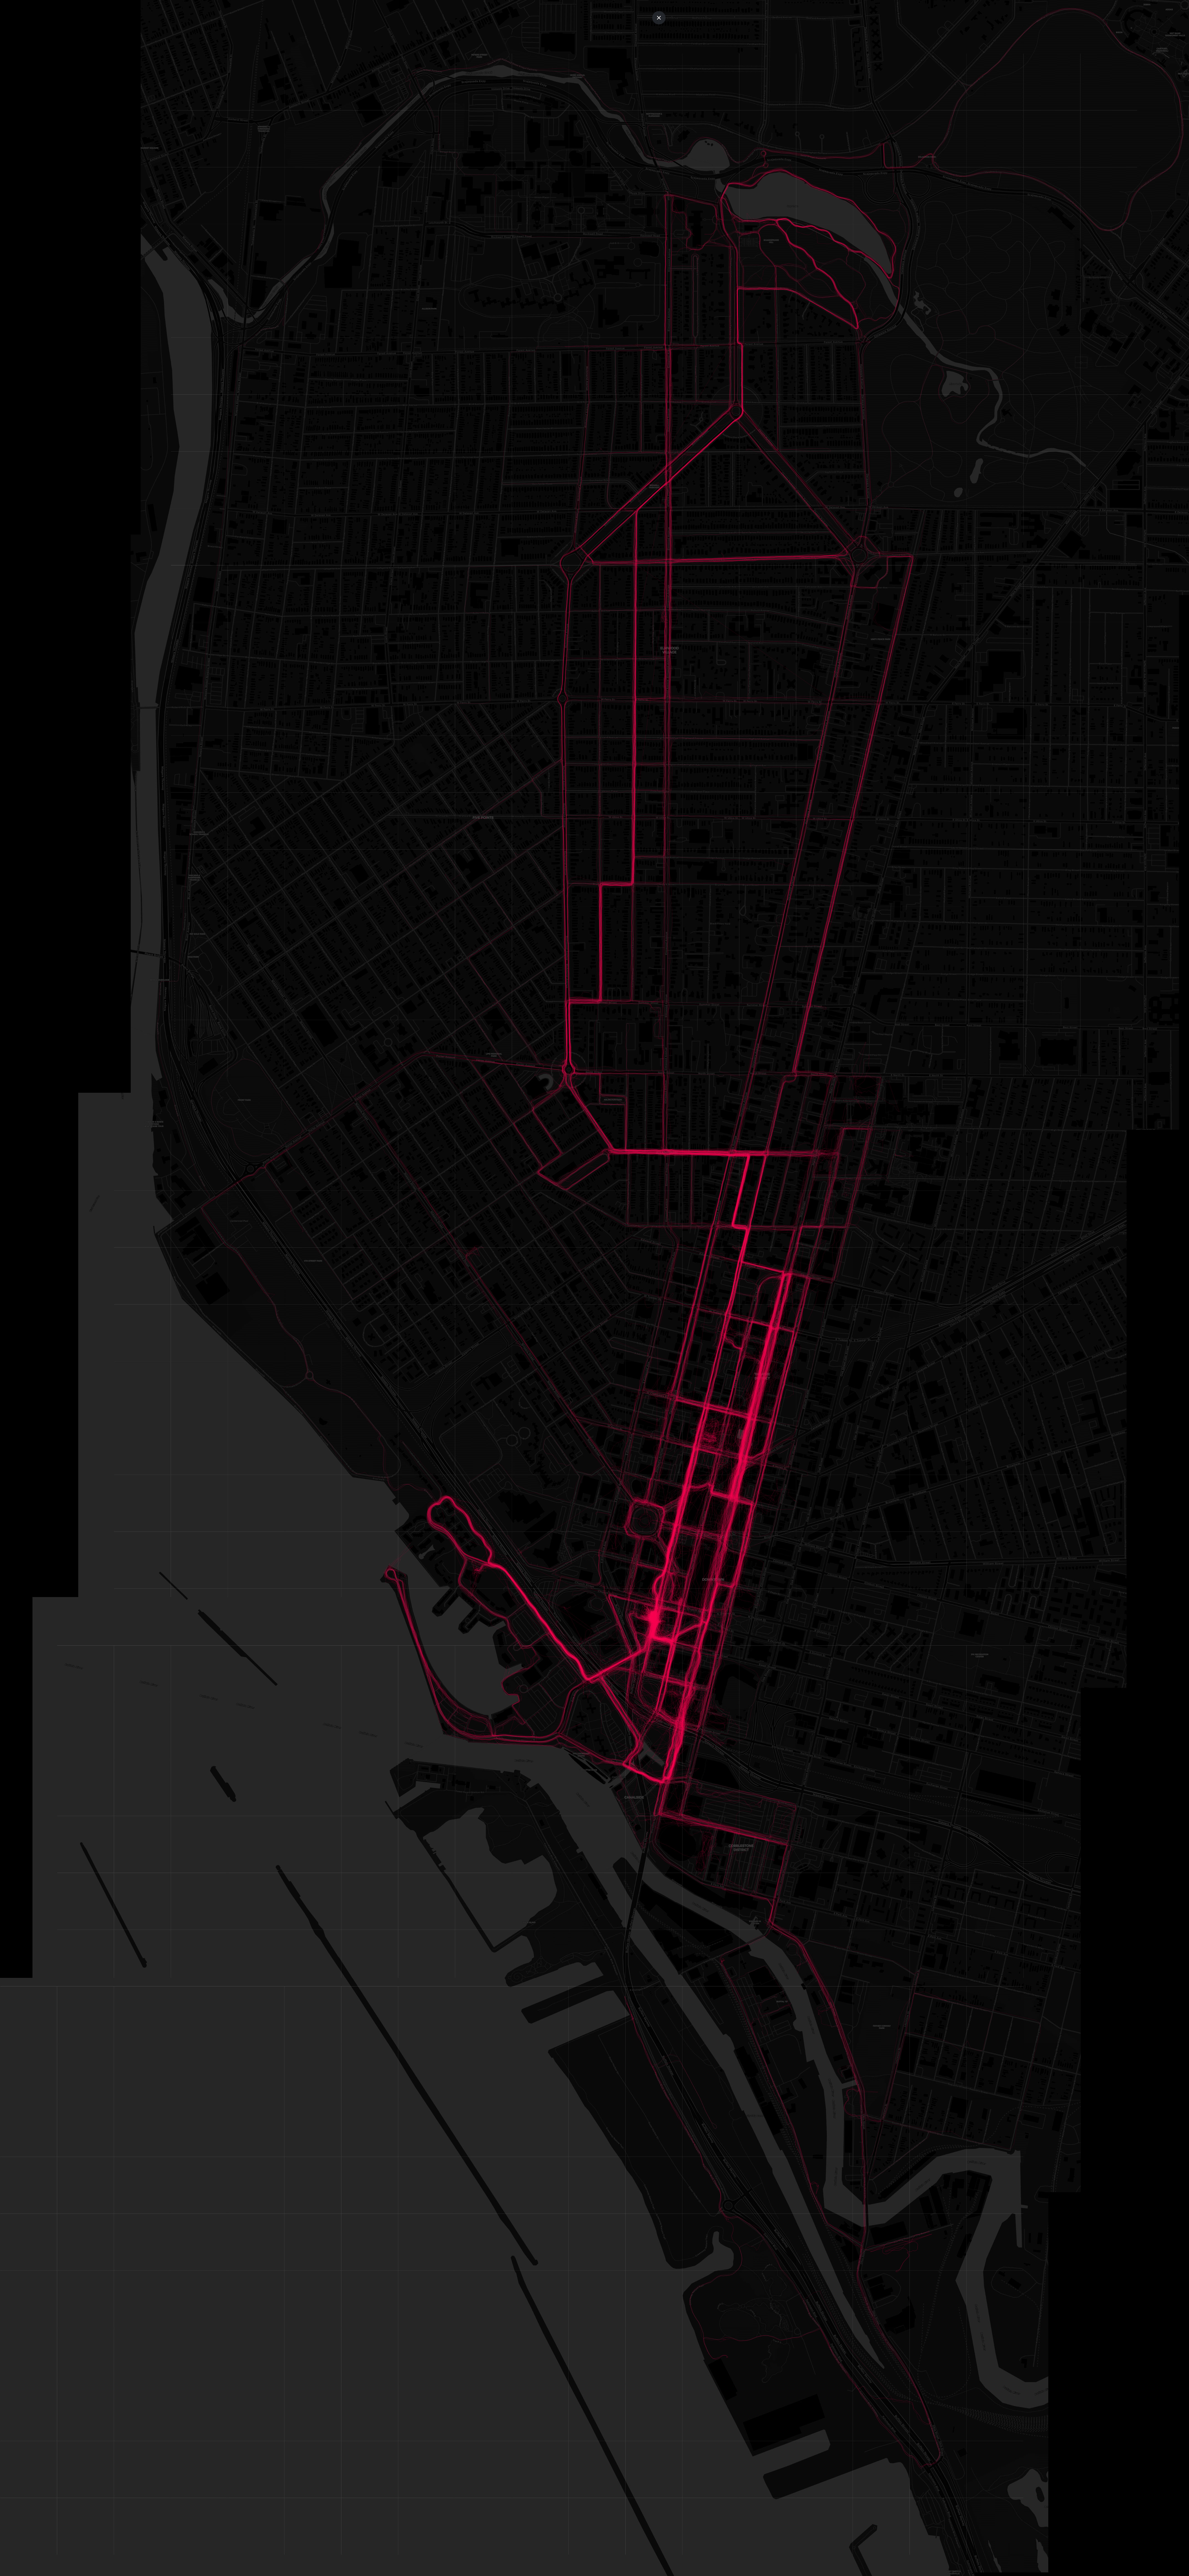
This project is designed to aggregate and visualize a user's OneWheel app rides based on a user-specified location.
NOTE: Recorded ride must be set to "public" within the OneWheel app in order to be captured and included in the aggregation.
The program starts by retrieving general ride details from the endpoint: https://app.onewheel.com/wp-json/fm/v2/trails
Initial Run:
-
If
ONEMAP_LOCATION,ONEMAP_MAX_DISTANCE, orONEMAP_NICKNAMEare not set inconfig.json, the user is prompted to provide: -
These inputs are then saved to
config.jsonfor future runs.
Subsequent Runs:
- The application uses the values stored in
config.jsonwithout prompting the user.
With the user input, the program filters rides based on the provided location using the haversine_distance function. This function calculates the distance between two latitude and longitude points and helps identify rides within the specified radius.
Before diving into the augmentation process, it's important to note that the trail and localized filter data fetched initially will include ALL rides in the specified area. The program then individually checks each ride to determine if the user matches the provided input. Due to this, if a large area is specified, the process can be time-consuming.
For each filtered ride with an ID greater than the highest existing ID in user_rides.json:
- Details are fetched from: https://app.onewheel.com/wp-json/fm/v2/trails/1?trackId={ride_id}
- If the ride matches the user's nickname, further detailed coordinates for the ride are fetched from: https://app.onewheel.com/wp-json/fm/v2/trailscoordinates/{ride_id}
This data is saved locally for further processing.
After aggregating ride data, the folium library is utilized to plot the rides on a dark-themed map. Each ride is represented as a path.
To view and explore the aggregated map:
- Navigate to the local path where
rides_map_dark.htmlis saved. - Open
rides_map_dark.htmlin your preferred web browser.
Ride stats are visualized using the combined plot_stats.py and one_stat.py functionalities integrated into the main process.
When you run the main script (run.py), it will:
- Generate individual statistical plot images in the
outdirectory. - Combine these individual plots into a single comprehensive
combined_plots.pngfile in theoutdirectory.
Example stats:
- Python 3.x
- Required Python packages:
requests,folium,geopy,matplotlib,seaborn,pandas,Pillow,calmap,setuptools
-
Clone the repository:
git clone https://github.com/jordanmalecki/onemap.git
-
Set up a virtual environment:
Navigate to the project directory and create a virtual environment:
python -m venv .venv
Activate the virtual environment:
- On Windows:
.\.venv\Scripts\activate
- On macOS and Linux:
source .venv/bin/activate
- On Windows:
-
Install required packages:
pip install -r requirements.txt
-
Initial Configuration:
The
config.jsonfile, which stores configuration details, is not included in the repository and will be automatically generated on the first run of the application.-
If
config.jsoncontains placeholder values or does not exist, you will be prompted to enter the following details:- Location: Your location (e.g., 'Buffalo, NY')
- Maximum Distance: The maximum distance in miles you'd like to search for rides.
- Nickname: Your OneWheel app nickname (display name on leaderboards).
These inputs will be saved to
config.jsonfor future runs, eliminating the need for repeated input. -
You can also manually create and set up
config.jsonwith the following structure:{ "ONEMAP_LOCATION": "Your_Location_Here", "ONEMAP_MAX_DISTANCE": 10.0, "ONEMAP_NICKNAME": "Your_Nickname_Here" }Replace
"Your_Location_Here",10.0, and"Your_Nickname_Here"with your actual location, preferred distance in miles, and OneWheel nickname respectively.
-
-
Rename
config_example.pytoconfig.py:mv config_example.py config.py
-
Update
config.pywith the necessary headers and cookies:These can be obtained by inspecting the network requests made while browsing public rides.
- Open the OneWheel browser app.
- Right-click and select 'Inspect' or press
Ctrl+Shift+I(orCmd+Option+Ion Mac). - Navigate to the 'Network' tab.
- Refresh the page or interact with the website or perform actions that trigger the relevant requests (e.g., viewing ride details).
- Filter the requests to locate the specific endpoints used in this project, such as
https://app.onewheel.com/wp-json/fm/v2/trailsand related endpoints (e.g., filtering by "v2" would work). - Once you identify a relevant request, click on it and copy the 'Request Headers' and 'Cookies' to use in the
config.pyfile.
Navigate to the project directory (ensure your virtual environment is activated) and execute:
python run.pyThis command will fetch, filter, augment, and visualize your OneWheel ride data, and generate both an interactive map and a comprehensive statistical dashboard in the out directory.
-
Fetching Trail Data: The application connects to the OneWheel app's API to retrieve trail data and saves it to
data/trails.json. -
Filtering Rides: It filters the fetched trail data to identify rides within the specified distance from your location, using a Haversine distance calculation. The results are saved to
data/filtered_rides.json. -
Augmenting Ride Data: The filtered rides are then augmented with detailed coordinates and additional ride information, if available. This augmented data is stored in
data/user_rides.jsonanddata/coordinates.json. -
Visualizing Data: The application generates several visualizations:
- Ride Maps: Visual representations of rides plotted on a map.
- Statistics: Various statistical charts and graphs related to the rides.
Pull requests are welcome. For significant changes, please open an issue first to discuss.


