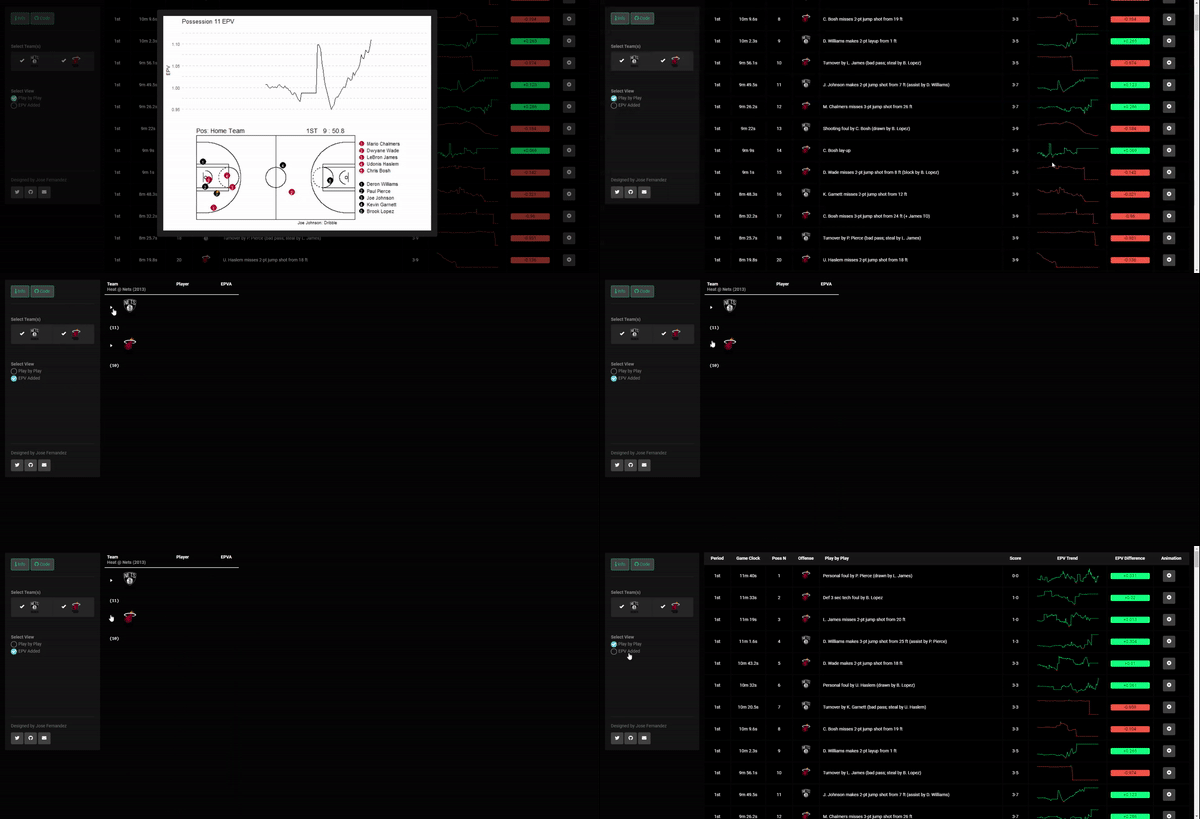
A minimal app to visualize Expected Possession Value (EPV) in the NBA.
Exploring an idea to visualize and interact with EPV in Basketball resembling a stock trading app. The dashboard provides information at a play by play level for a full game as well as the player total EPV added for that game. A dynamic play diagram alongside the EPV can be displayed for all available plays.
- Live App: Link
Cervone, D., D’Amour, A., Bornn, L., & Goldsberry, K. (2016). A multiresolution stochastic process model for predicting basketball possession outcomes. Journal of the American Statistical Association, 111(514), 585-599. Link
Cervone, D., D’Amour, A., Bornn, L., & Goldsberry, K. (2014). POINTWISE: Predicting Points and Valuing Decisions in Real Time with NBA Optical Tracking Data. Sloan Sport Analytics Conference. Link
The EPV data was sourced from https://github.com/dcervone/EPVDemo
This app is not intended to work on mobile devices and therefore some functionalities may not work on smaller screens.
