![]()
This project is a grain analysis tool developed in Python, leveraging the OpenCV library for image processing. The tool takes an image of grains as input, identify individual grains and calculate the width and height of each grain.
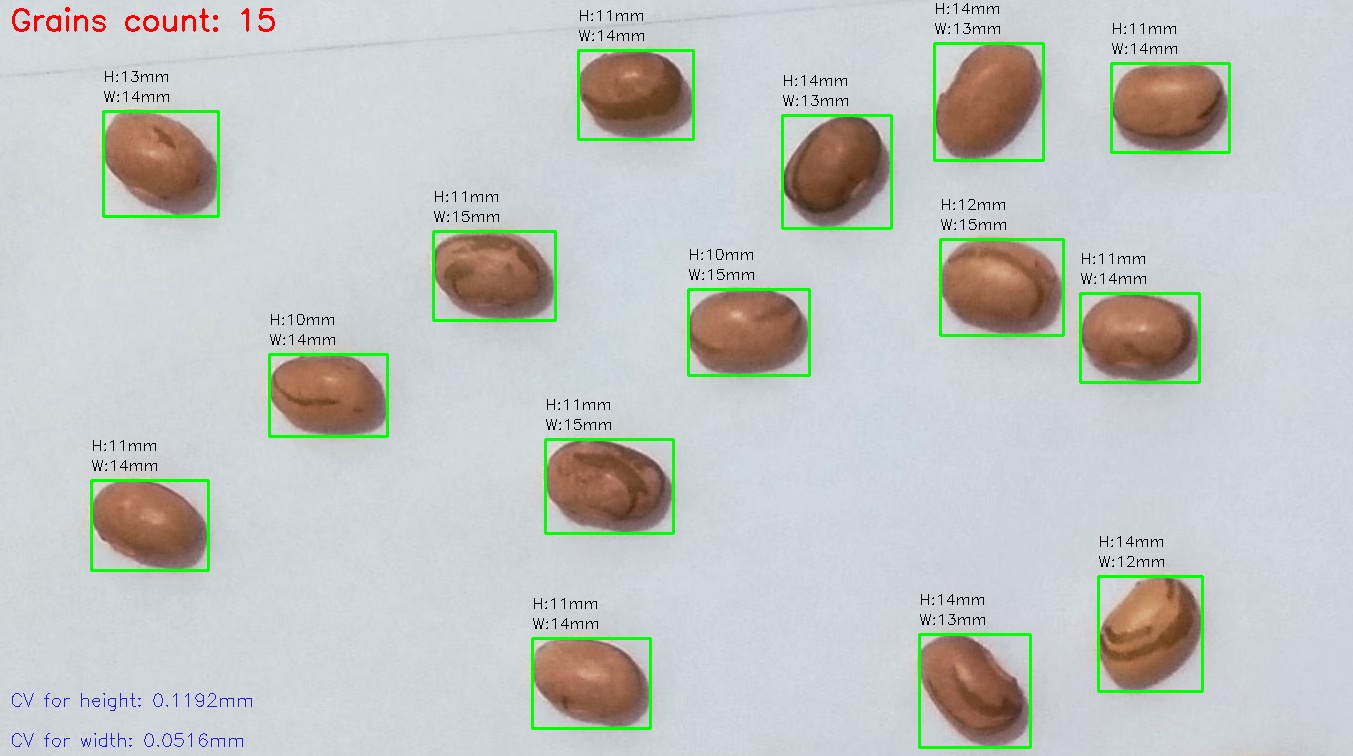
The tool also calculates the coefficient of variance for the widths and heights, providing a measure of the variability of grain size. The results are visualized directly on the image, with each grain enclosed in a rectangle and the dimensions displayed.
The output is a resized image that can be displayed and saved for further analysis. This tool is useful for researchers and professionals in agriculture, food science, and related fields who need to analyze grain size and distribution
The application follows these steps:
- Load the image.
- Convert the image to grayscale.
- Apply a binary inverse threshold to the grayscale image.
- Find contours in the thresholded image.
- Process the contours:
- For each contour, if its area is greater than a minimum contour area:
- Draw a rectangle around the contour on the image.
- Calculate the width and height of the rectangle in millimeters.
- Write the width and height on the image.
- Add the width and height to lists.
- Increment a count of the grains.
- For each contour, if its area is greater than a minimum contour area:
- Calculate the coefficient of variance for the widths and heights.
- Write the count of grains and the coefficients of variance on the image.
- Resize the image.
- Display the image and save it to an output file.
The code is organized into several functions:
load_image(image_path): Loads an image from a file.convert_to_grayscale(image): Converts an image to grayscale.apply_threshold(image): Applies a binary inverse threshold to an image.find_contours(image): Finds contours in an image.calculate_coefficient_of_variance(values): Calculates the coefficient of variance of a list of values.process_contours(contours, image, ppmm, min_contour_area): Processes contours found in an image.analyze_image(image_path, output_path, ppmm, min_contour_area): The main function that uses the above functions to analyze an image.
To use this application, run the worker.py script. For example:
python worker.pyThis will analyze the image img/beans.jpg and save the output to img/beans_output.jpg.
- 💻 José Henrique Roveda
- 📨 Contact me on LinkedIn