Welcome to OpenTrack, an open-source platform for extracting training load variables from IMU data. The initial OpenTrack release can be used with triaxial accelerometer or 9-axis IMU data, and is functional with a single central device, and/or two devices corresponding to left and right limbs.
OpenTrack is aimed at:
- Sports teams or dance companies who can’t afford commercial wearable systems but want to monitor load.
- Practitioners who want more control over the way in which their data is processed.
- Students or practitioners who want to learn to use wearable technology systems but don’t have access to commercial versions.
The current version of OpenTrack calculates impact counts and magnitudes, jump counts and heights, PlayerLoad, and other common training load variables. It will also output both raw and processed time-series for each device uploaded. OpenTrack is designed to work with either .csv or SQL databases, both of which can be edited from within the platform.
These instructions assume you have R and Rstudio installed. If you don’t, install the latest versions from here: R - https://cran.r-project.org/; Rstudio - https://www.rstudio.com/products/rstudio/download/#download.
To install OpenTrack, run the script below in Rstudio (or the ‘installation.R’ file included in this repo). This script will create a local copy of this repo, install Rtools, install the dependencies, and finally, install OpenTrack. Once OpenTrack is installed, open the ‘OpenTrack’ project file, and then run the command OpenTrack::run_app() to load the app. If you run into problems, please feel free to contact me.
Please note that OpenTrack requires version 0.7.5 of shinydashboardPlus. If you update shinydashboardPlus to 2.0.0 the app won’t work.
## OpenTrack Installation Script
#
## This script is designed to install OpenTrack from a brand new R/Rstudio
## install. After this script has finished, navigate to the 'OpenTrack'
## project in the 'R/OpenTrack' folder, and run the command:
## OpenTrack::run_app()
#
## -------------------------------------------------------------------------
#
## find the filepath to R
#install.packages("stringr", type = "binary")
#r.path <- paste0(stringr::str_split(getwd(), "/R/")[[1]][1], "/R/")
#
## set the R folder as the wd
#setwd(r.path)
#
## download a copy of the repo
#utils::download.file(
#    url = "https://github.com/joseph-shaw/OpenTrack/archive/refs/heads/main.zip",
#    destfile = "OpenTrack.zip"
#    )
#
## unzip the .zip file
#utils::unzip(zipfile = "OpenTrack.zip")
#
## rename
#file.rename("OpenTrack-main", "OpenTrack")
#
## set OpenTrack as the wd
#setwd(paste0(r.path, "OpenTrack"))
#
## install devtools
#install.packages("devtools")
#
## install rtools
#install.packages("installr")
#installr::install.rtools()
#
## install specific version of shinydashboardPlus
#devtools::install_version(
#    "shinydashboardPlus",
#    version = "0.7.5",
#    repos = "http://cran.us.r-project.org",
#    type = "source")
#
## install other dependencies
#install.packages(
#   c('config', 'golem', 'gdtools', 'attempt', 'DT', 'dplyr', 'DBI',
#     'DescTools', 'caTools', 'chron', 'dashboardthemes', 'data.table',
#     'dygraphs', 'extrafont', 'fmsb', 'ggiraph', 'ggplot2', 'gridExtra',
#     'lubridate', 'odbc', 'plotly', 'png', 'pool', 'rowr', 'shinyFiles',
#     'shinyWidgets', 'shinycssloaders', 'shinyjs', 'tidyr', 'xts', 'zoo',
#     'formattable', 'signal'),
#   type = "binary"
#)
#devtools::install_github("cvarrichio/rowr")
#
## install OpenTrack
##devtools::install_github("joseph-shaw/OpenTrack")
#install.packages(paste0(r.path, "OpenTrack"),
#                 repos = NULL,
#                 type = "source", dependencies = T)
#
#
## -------------------------------------------------------------------------
## At this point, navigate to the 'OpenTrack' project in the 'R/OpenTrack'
## folder, and run the command: OpenTrack::run_app()Before you begin you’ll need to alter several files within the ‘settings’ folder (“~R/OpenTrack/settings”) - if you don’t do this then OpenTrack won’t run properly. You’ll also need to decide whether you want to database using SQL or csv. If you want to use SQL then there’s a script to recreate the “Athlete_Database” SQL database required in this repo (create_sql), which you can set up on your own server.
Here are the settings files you’ll need to edit.
-
athletes.csv: This file houses data about each athlete. You can edit to this directly, or do so through the ‘Add athlete’ tab in the “Analyse Data” page in the app.
-
sql.csv: This file is used to create a SQL connection (set the ‘csv’ cell to 0), or tell the app to use csv files (set the ‘csv’ cell to 1). To set up a SQL connection, add in the database information in each cell. You’ll be prompted to enter the password each time you open the app (entry box in the r studio window; nothing will work until this is entered correctly). You can add a password permanently in the ‘app_server.R’ file instead where the SQL connection is made (you will need to rebuild the app).
-
lists.csv: You can use this file to change the session type options in the drop down on the ‘Analyse Data’ page.
-
filepaths.csv: You will need to change these if you want to edit where the app can look for files. Simply enter the required file paths and a name for the location you want to use. For example, to add your documents folder, add ‘Documents’ in the name column, and “C:/Users/yourname_/Documents” in the location column. You can set any number of custom locations.
-
export.csv: This file can be used to change the data that is exported. Simply delete a column to remove it from the export.
Once you’ve configured these settings, you can run the app with:
#library(OpenTrack)
#run_app()
#or
#OpenTrack::run_app()
When you open the app you’ll start at the data upload page. Here you will need to upload the data from your IMU(s). There are upload tabs for central/left/right devices for a single athlete (multiple athletes coming soon). If you click these upload buttons and the file browser isn’t populating, you either haven’t set the filepaths in ‘filepaths.csv’ or you’re using SQL and you haven’t entered the password. Here you will also need to set the date/time the devices were turned on, the units of time that your device outputs, and if your vertical axis is flipped.
A couple of things to note here: - There’s not currently a function to sync the three devices, so if the times are out of sync, the data will be out of sync - The time unit is currently ‘time since turned on’, and not a date-time unit. Using a date-time unit should be fairly simple to add, and should be included in the next release.
The data you’re uploading has to be in a specific format, 4 or 7 named columns (names don’t matter) providing:
- Column 1: The time since the device was turned on
- Columns 2:4: X, Y, and Z linear acceleration (i.e., accelerometer data) - Z should be up/down
- Columns 5:7: (optional). X, Y, and Z angular acceleration (i.e., gyroscope data)
You can see examples in the files called ‘example_upload.csv’ or ‘example_upload_acc_only.csv’ in this repo.
Once you’ve uploaded the data and changed your settings, hit the ‘Process’ button and move to the ‘Analyse Data’ tab.
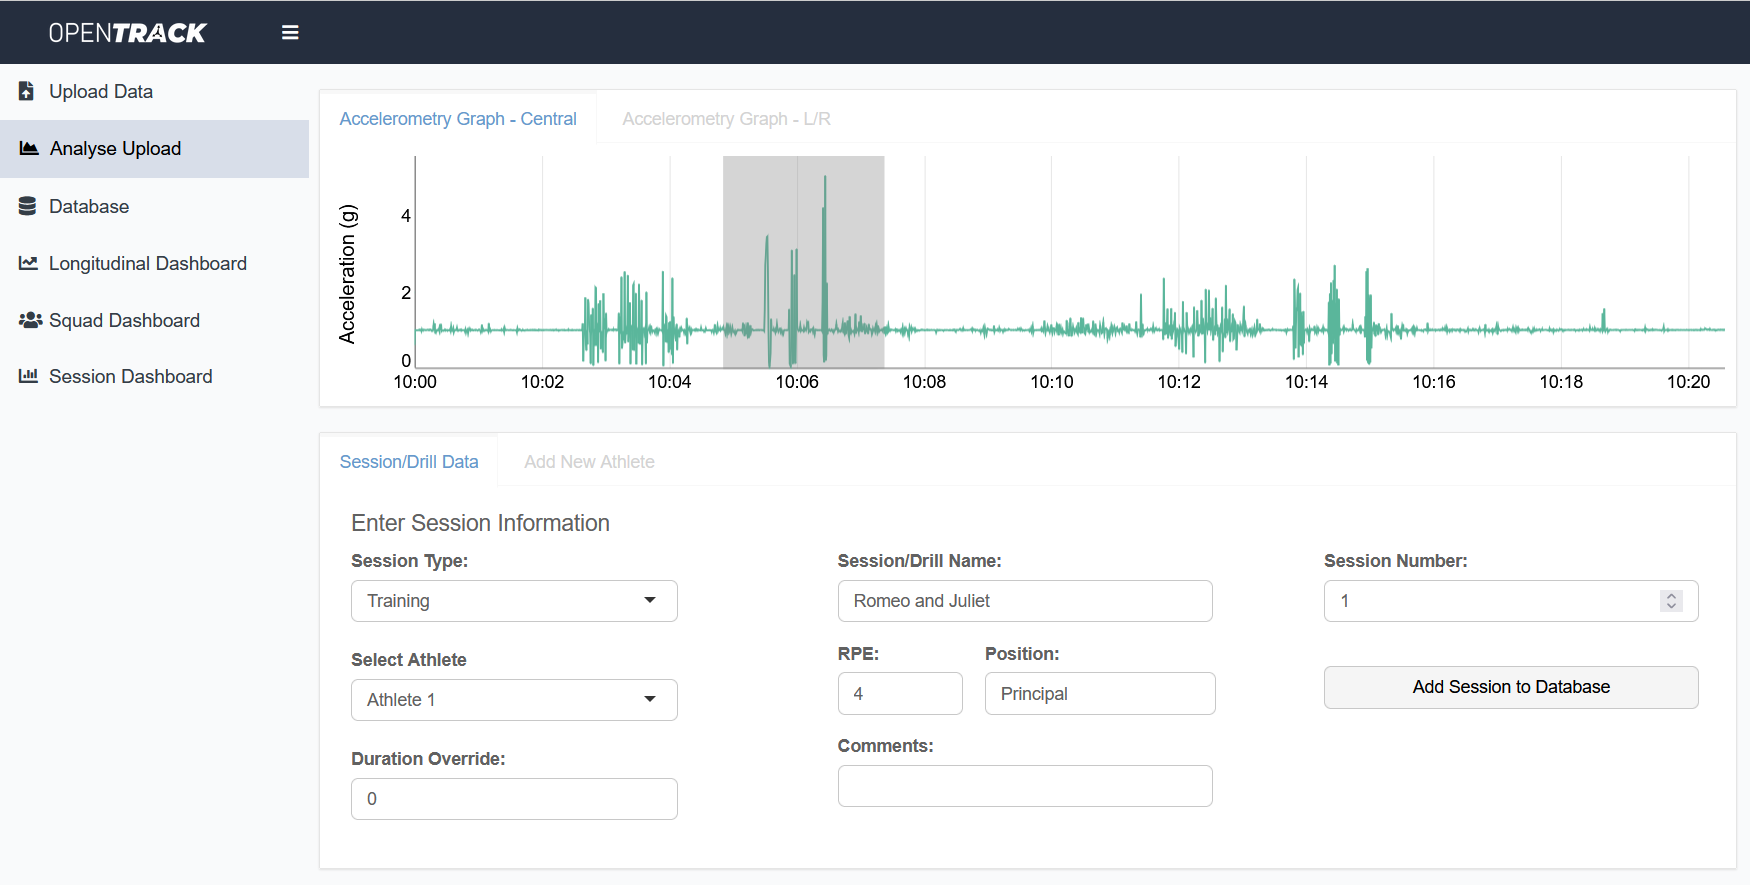
Once your data uploads you’ll find plots of the central device (plot tab 1 ) and L/R devices (plot tab 2 ). You’ll also find data inputs for details about the session, or space to add a new athlete to the database.
Click and drag over the central plot to clip a session. This will change the summary row in the ‘Database’ tab, or the data output in the dashboard at the bottom of the upload page. Double-click the plot to zoom back out. Add the session to the database by clicking the ‘Add session to database’ button. This will add a new row with the selected session to the database and create a copy of the processed time-series in the ‘Opentrack/clipped-sessions’ folder. Make sure you don’t have the database open elsewhere (e.g., in Excel) when you do this.
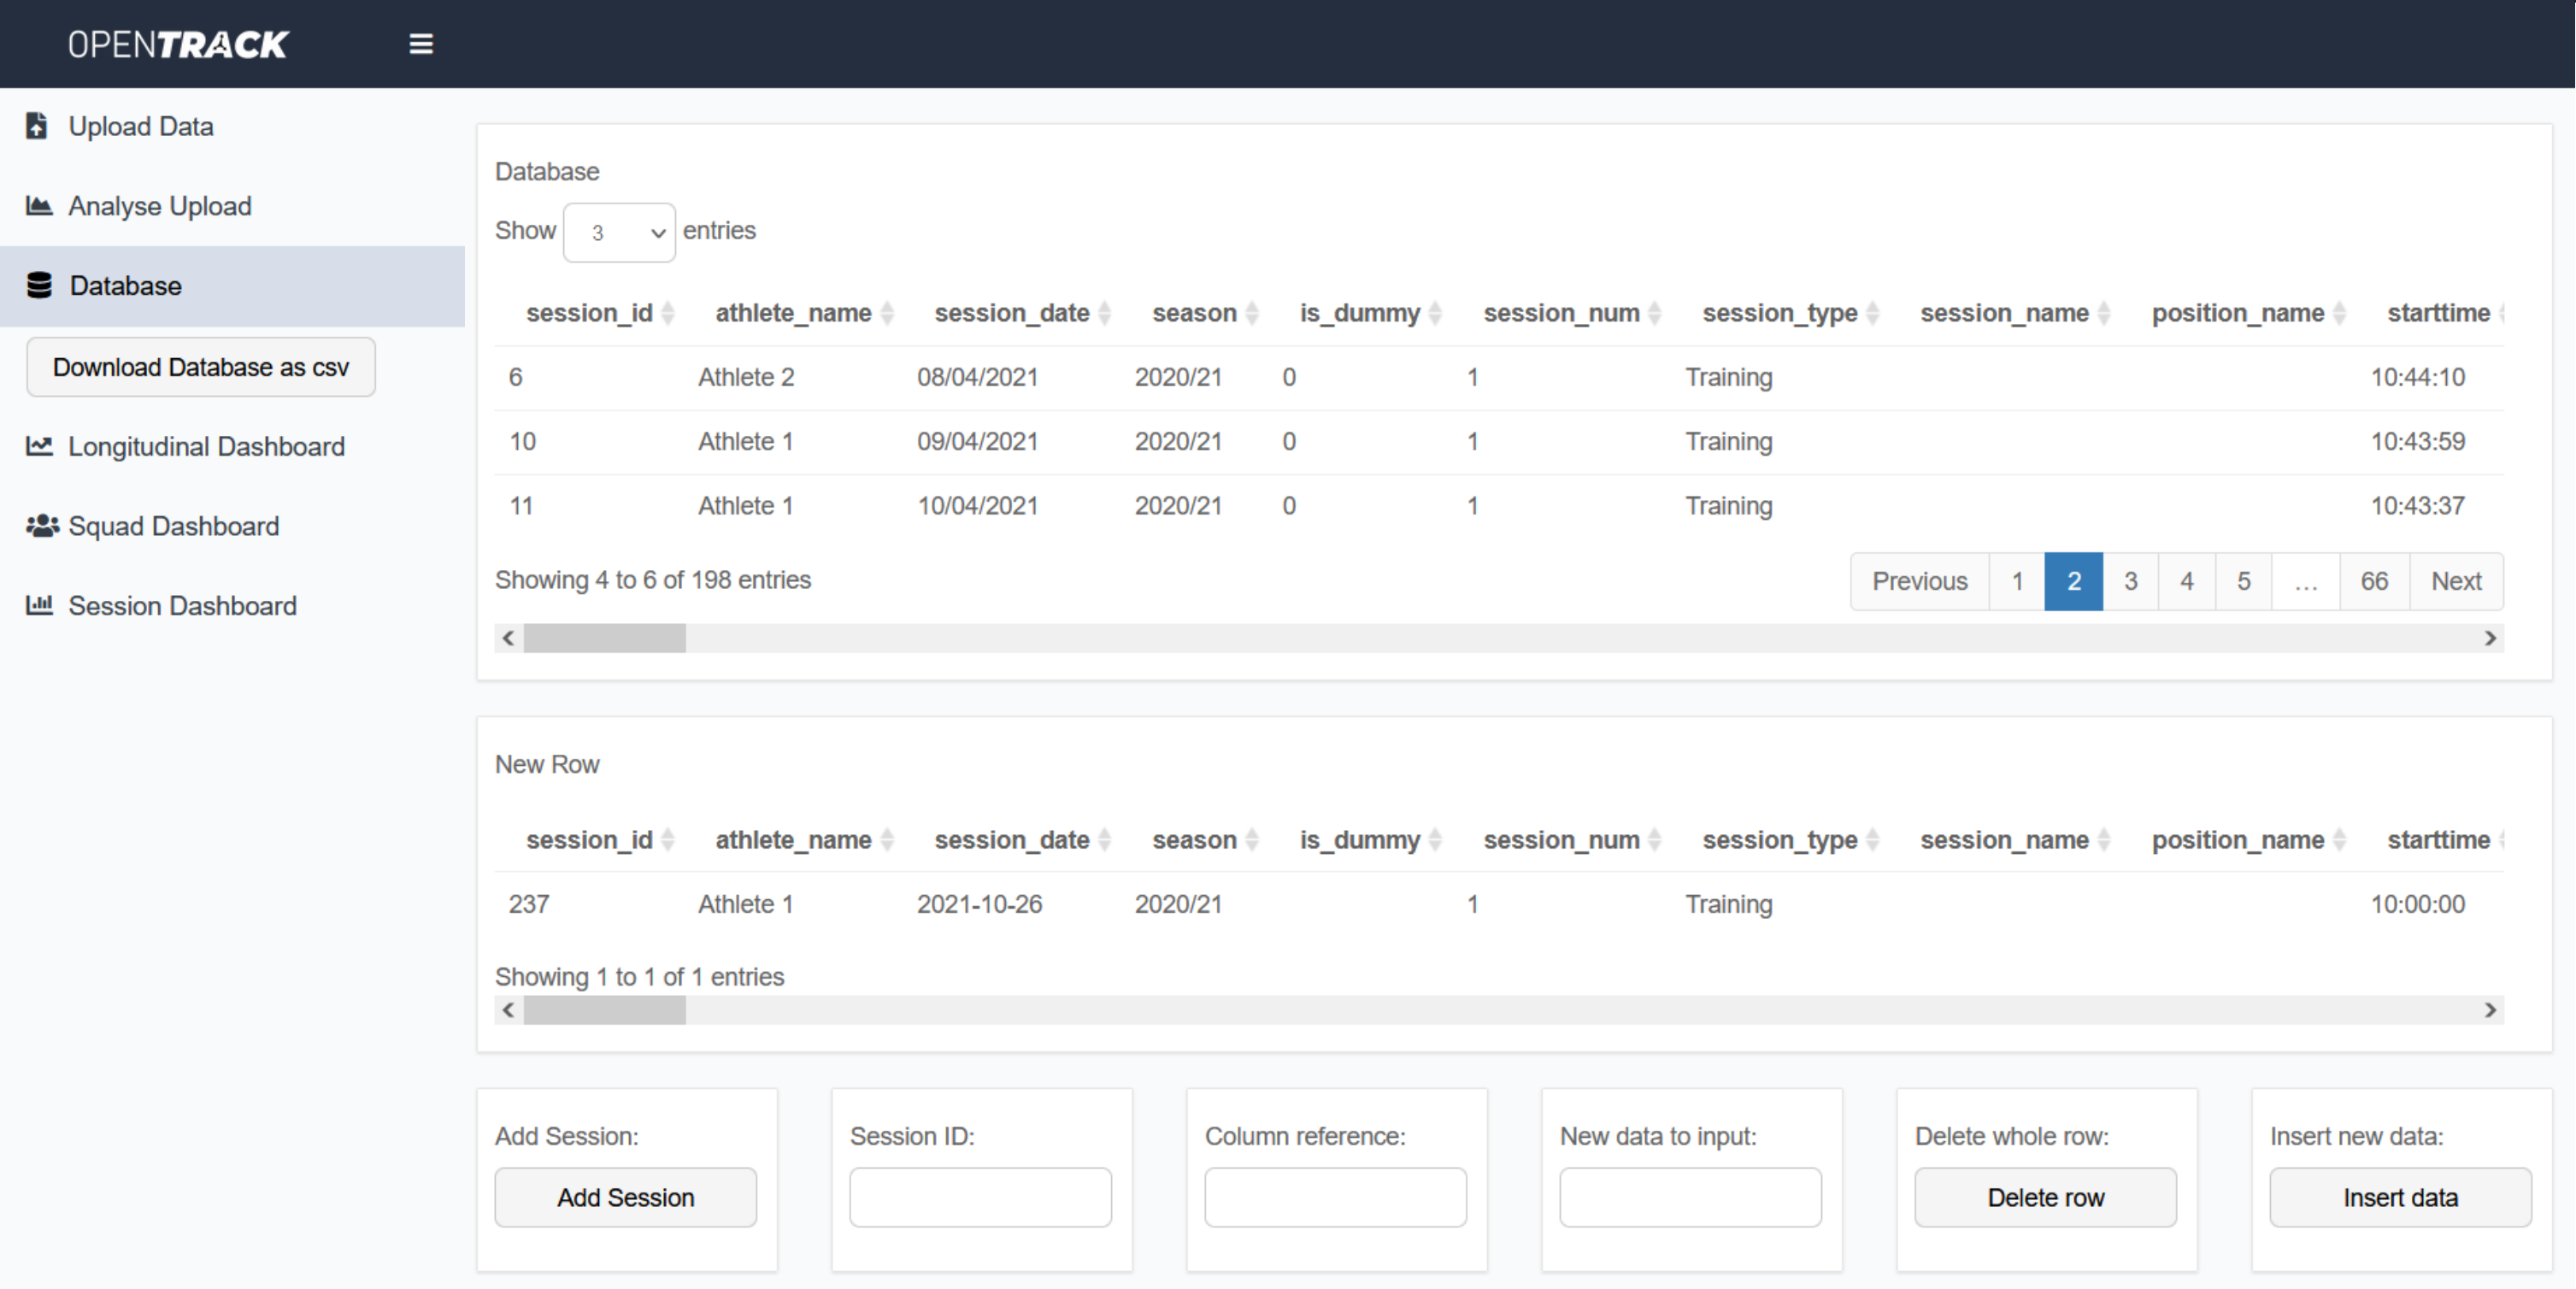
The ‘Database’ tab shows data currently saved, the new row of data to be added (when you press ‘add session’), and buttons you can use to edit the database. The ‘Session ID and ’Column reference’ boxes can be used to select the cell or row you want to edit, and the ‘delete row’ and ‘insert new data’ can be used to edit existing data. Alternatively, you can edit the database outside of OpenTrack. You can click the button in the sidebar to download a csv of the database, which can be found in the ‘R/OpenTrack’ folder.
For dashboards to populate they require data to be saved. The database files are empty on installation, but you can add the data from the file ‘dummy_database.csv’ if you want to see what they should look like.
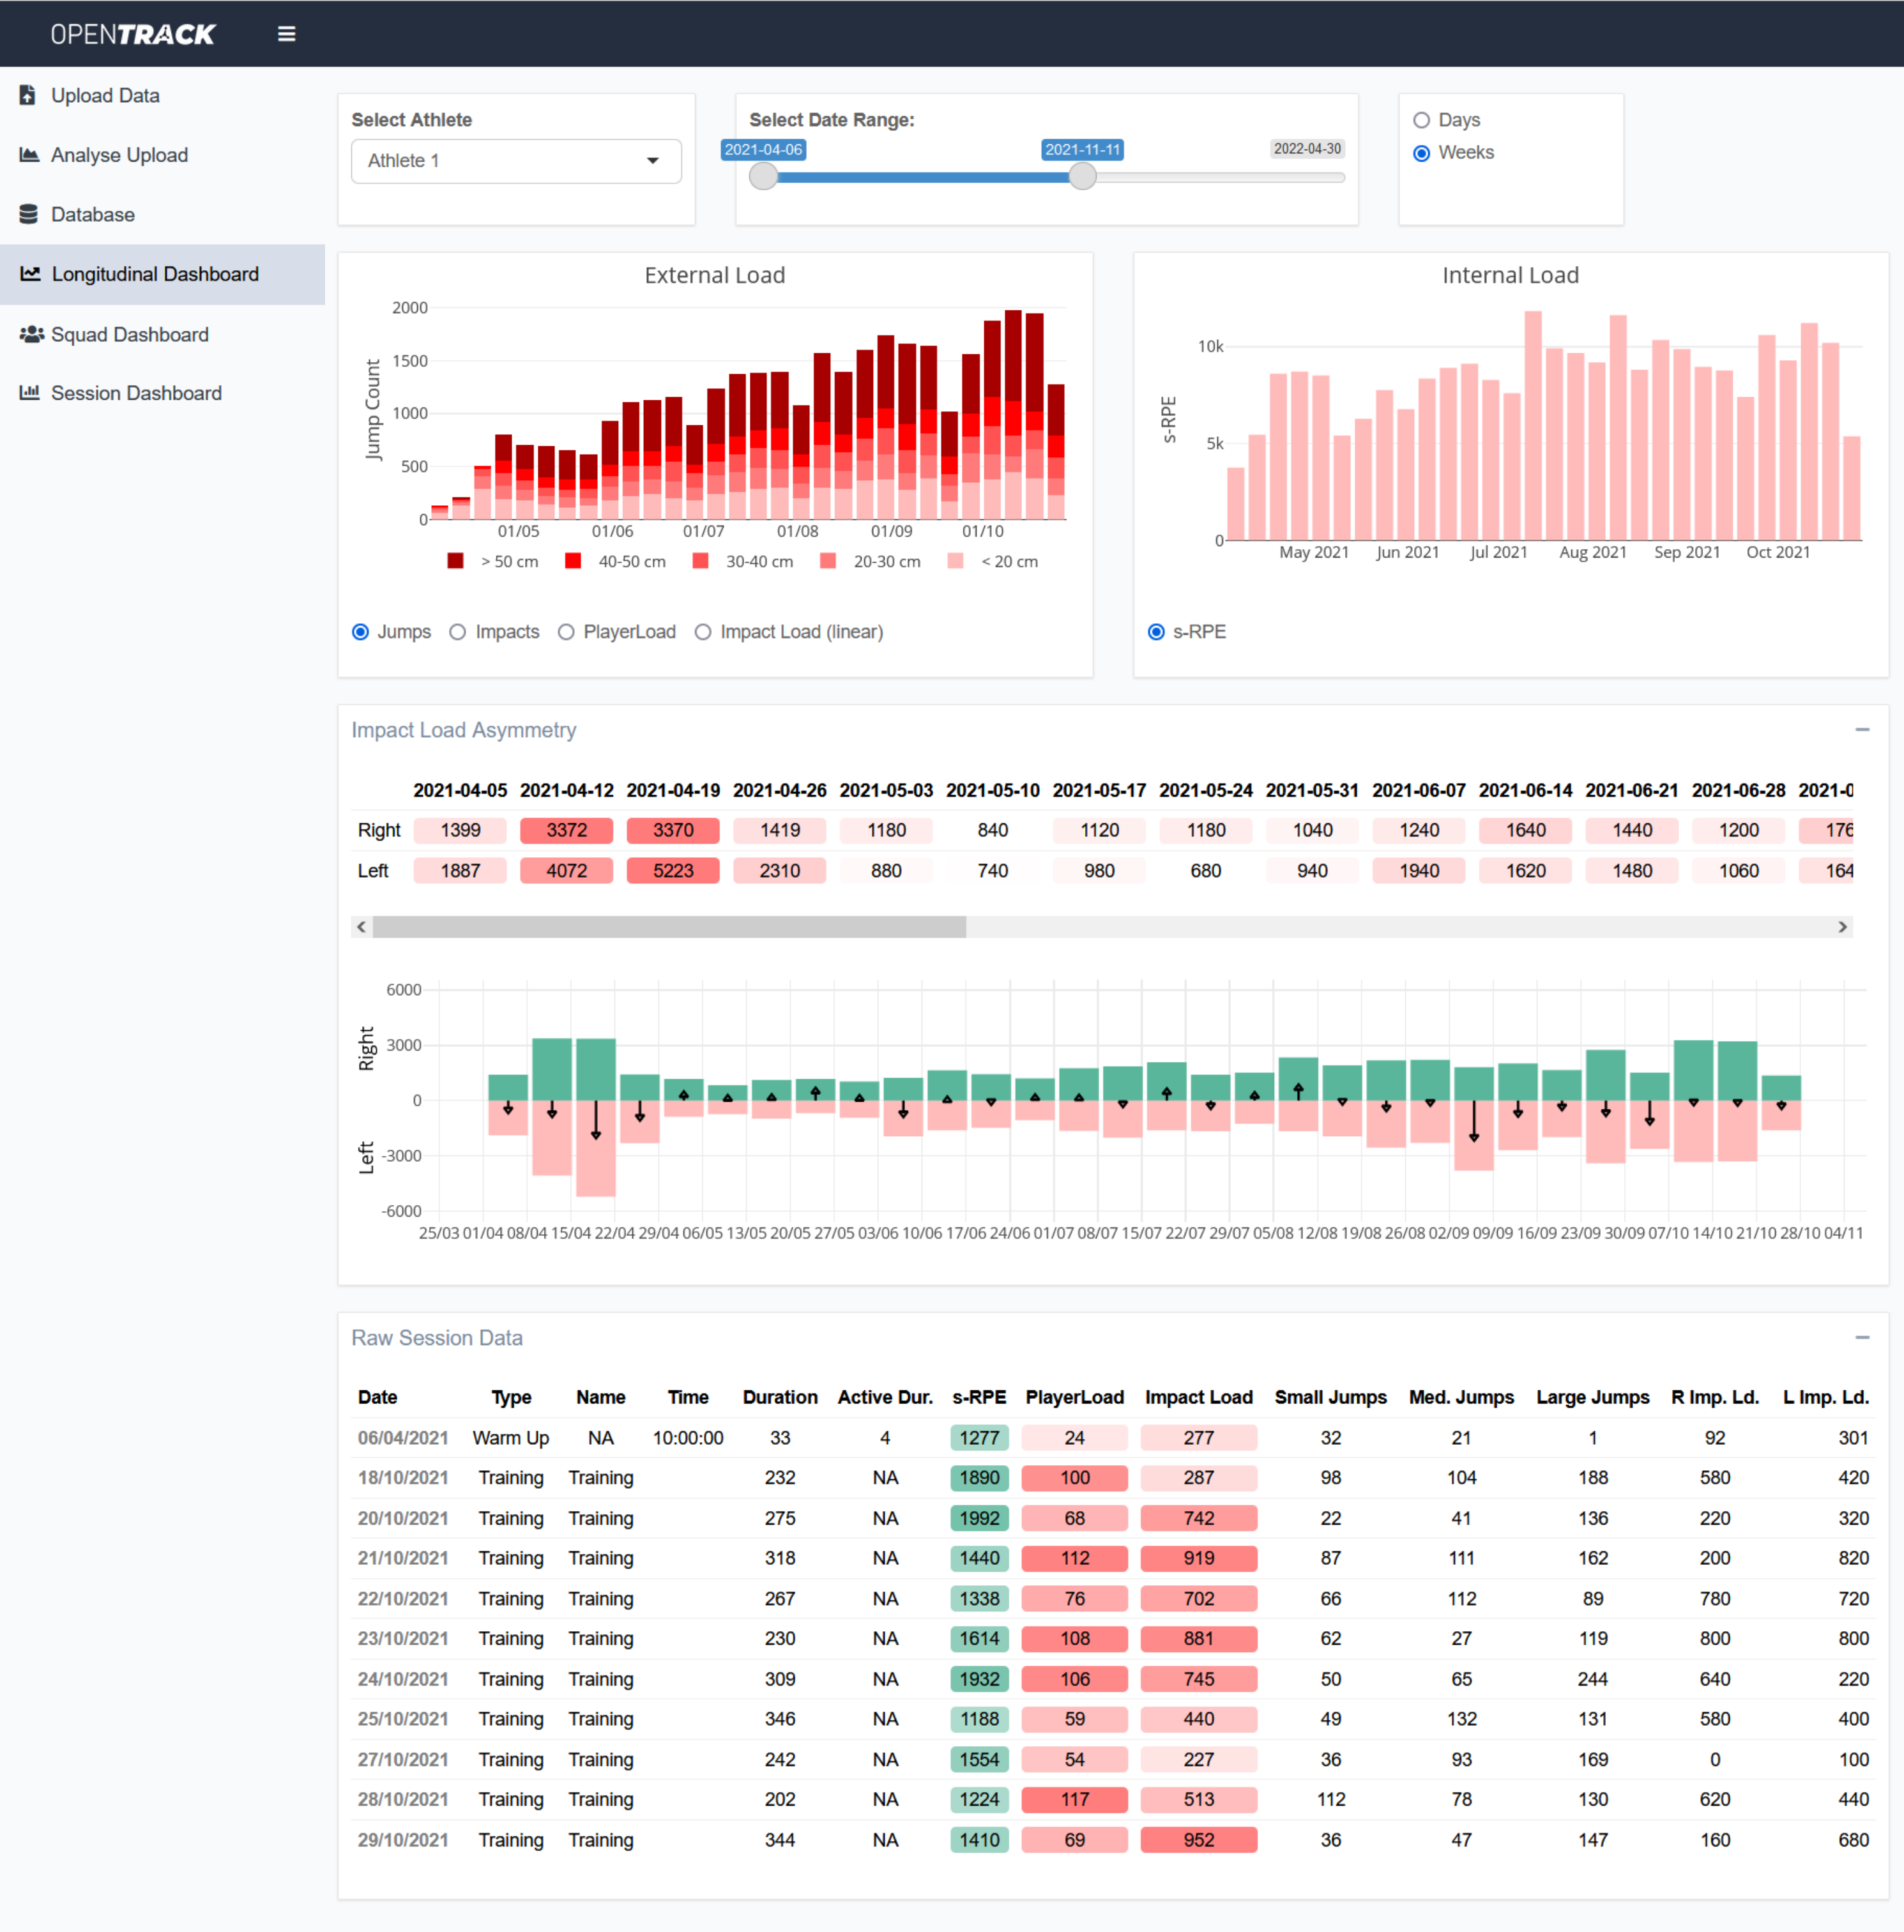
The Longitudinal Dashboard tab can be used to look at a single athlete’s training load data. Select the athlete you want using the dropdown, and the date range you’re interested in. You can then also choose if you want to group data by days or weeks. The external load graph will also let you select the variable you’re interested in.
Below, you will also find boxes containing information on external load symmetry, and session-by-session data.
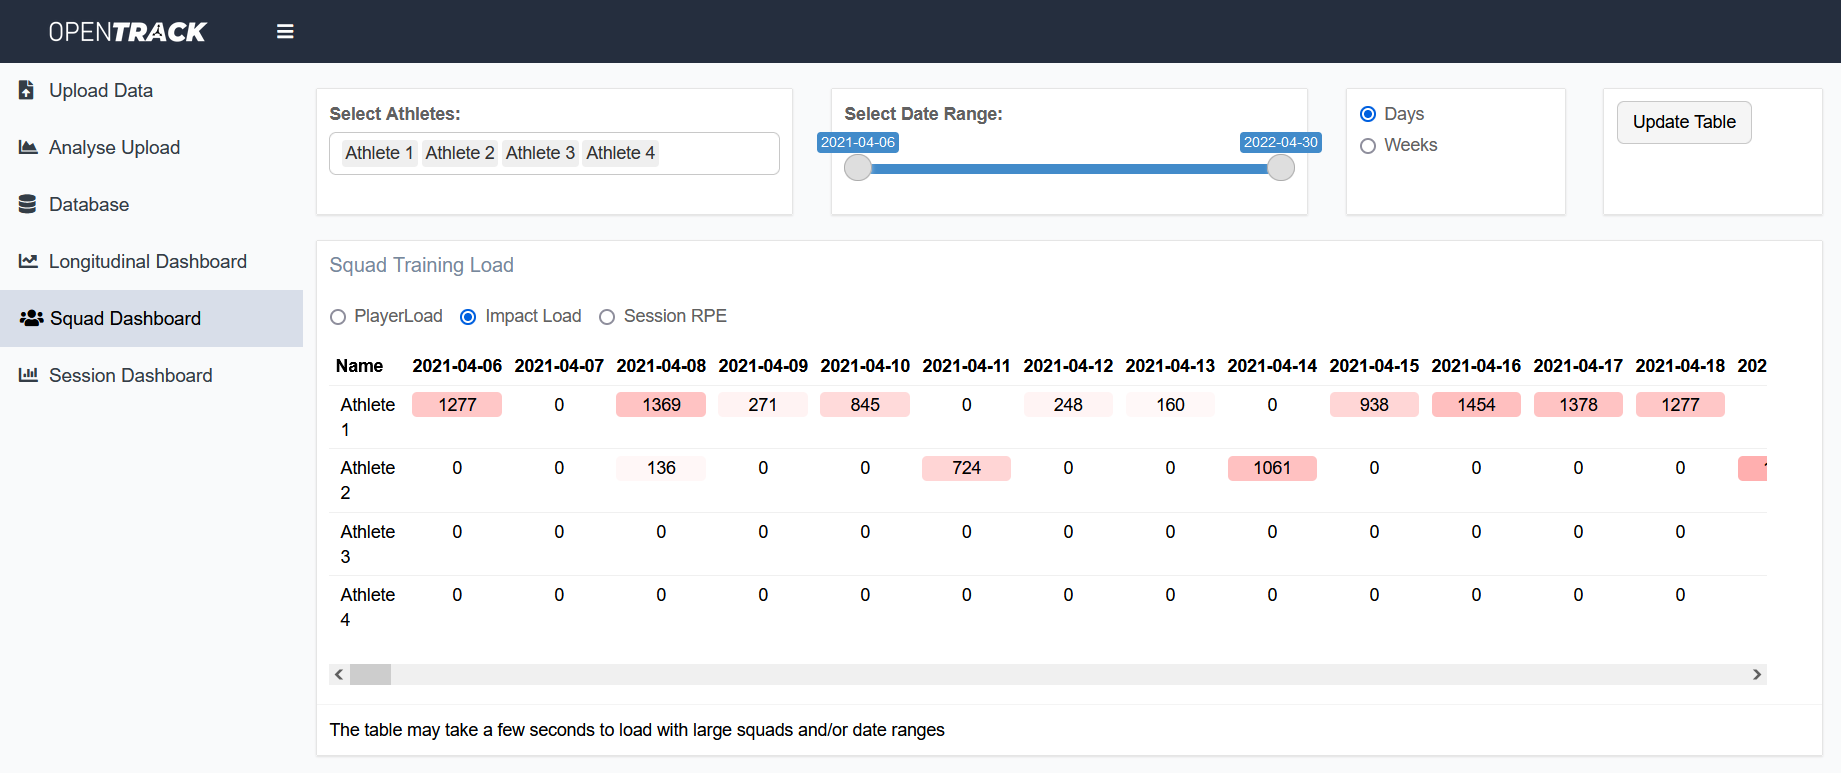
In this dashboard you can view longitudinal training load data for multiple athletes. Select the athletes you’re interested in, and the date range, and hit ‘Update Table’. Large date ranges will take a while to load.
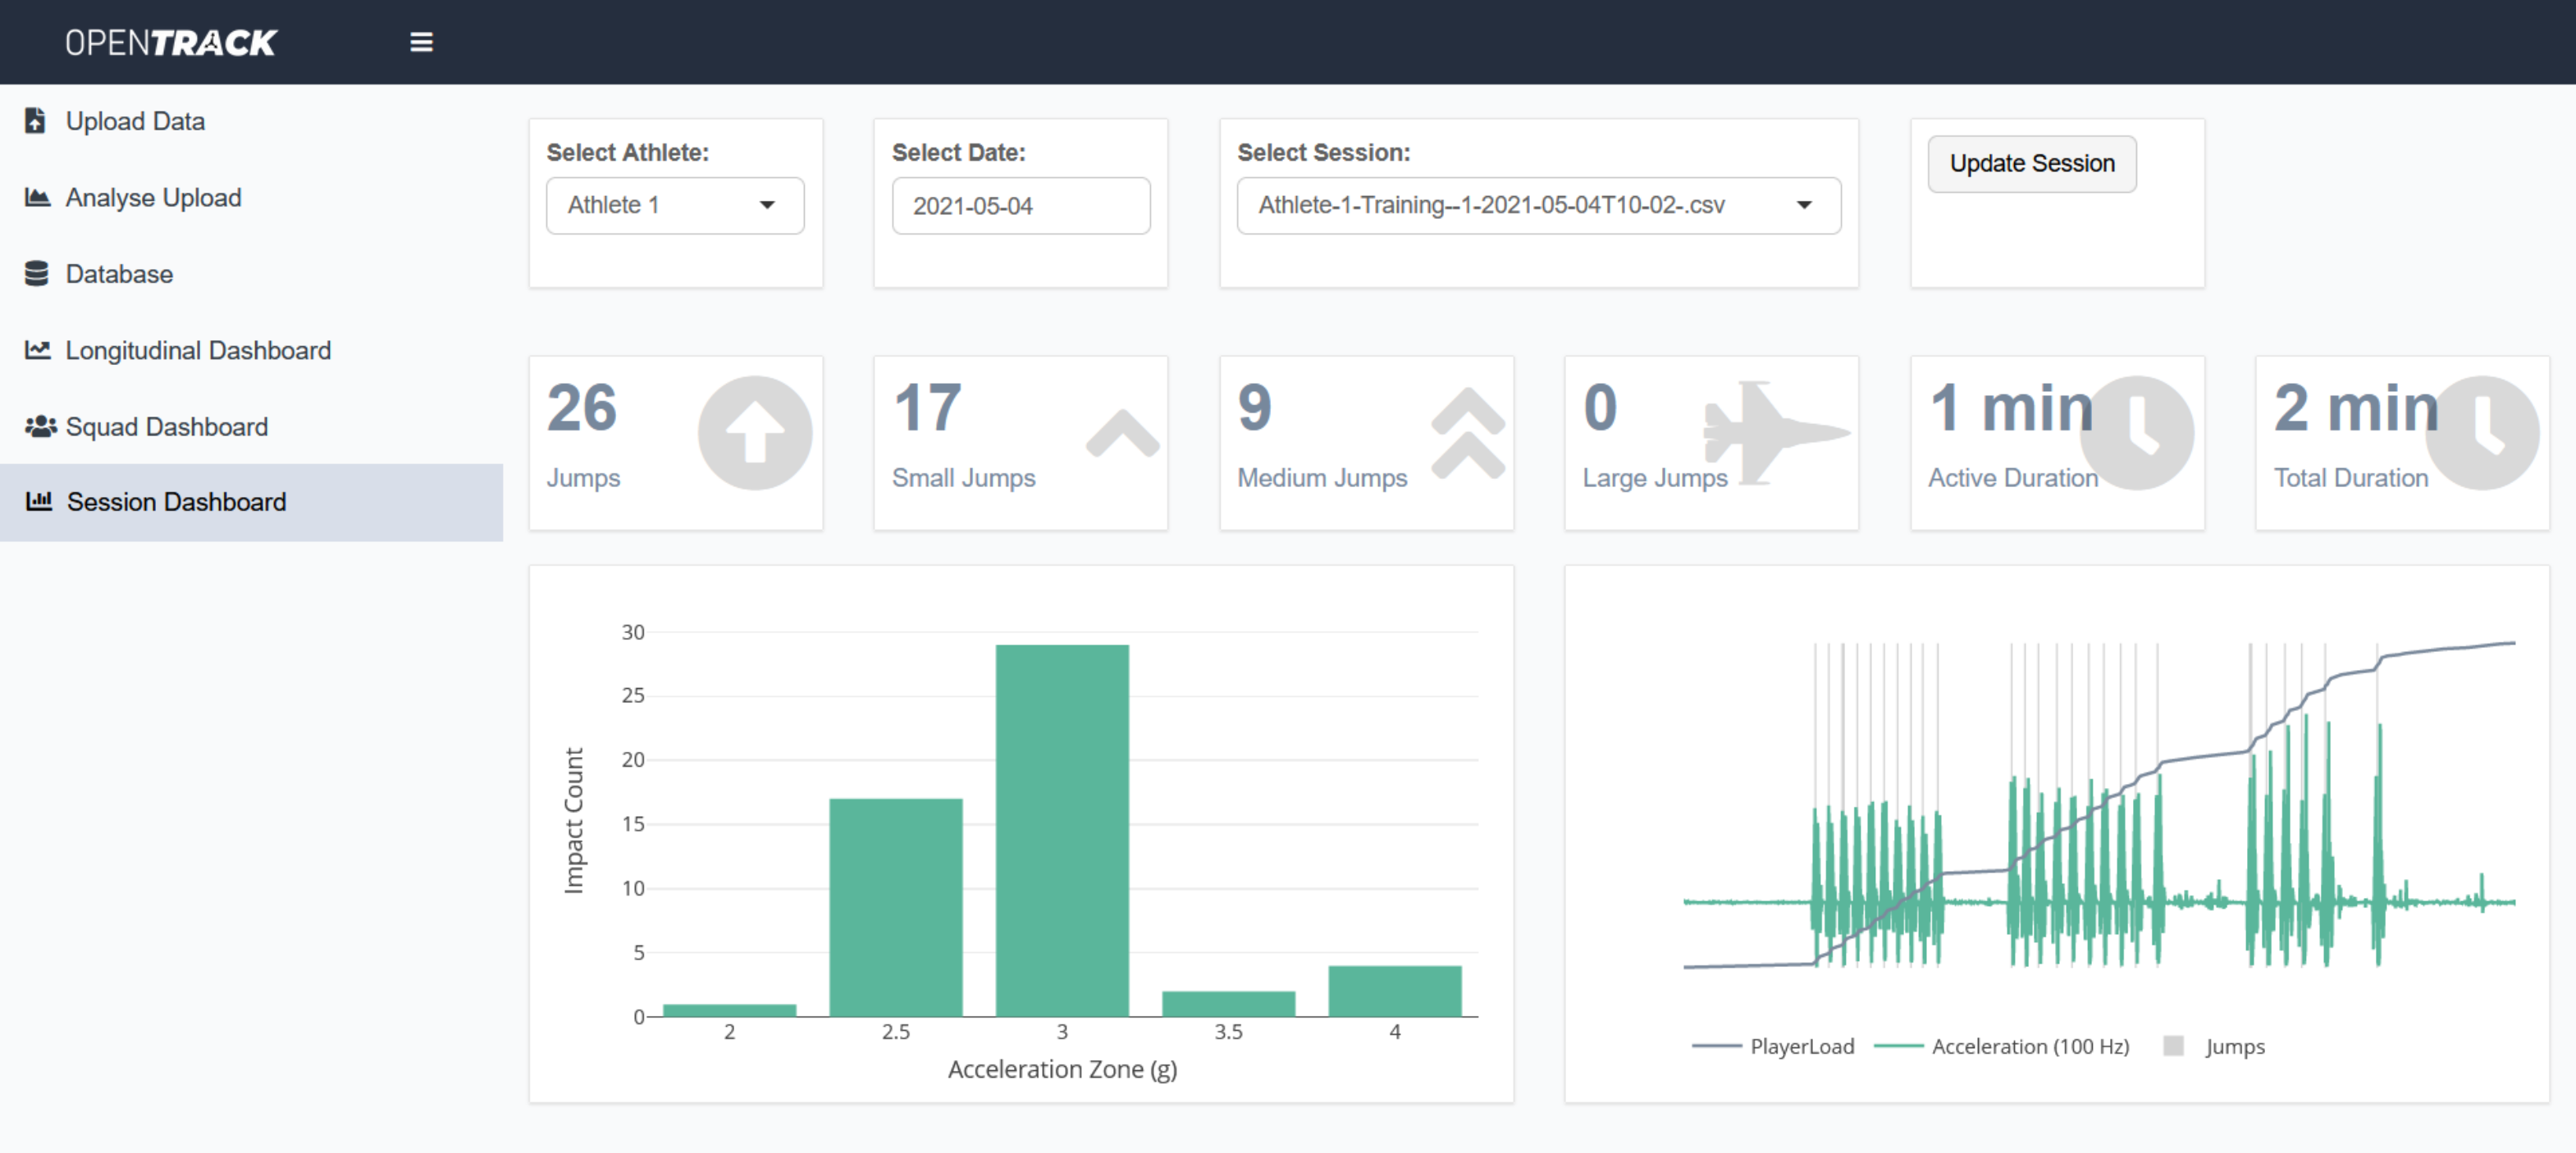
This tab will let you review specific sessions you’ve previously saved. Select the athlete and date, and then the sessions completed that day should populate. Click ‘Update Session’ and the dashboard from that session should update.
If you’re using three nine axis IMUs (Waist/L Shank/R Shank) you can also calculate tissue forces. To do this, select one of the options on the upload page. This will result in a tissue force time series added to the exported file in the ‘clipped sessions’ subfolder of the OpenTrack folder. Please note this will take much longer to run.
I will try and put up some instructions for building your own at some point, but If I haven’t done that by the time you read this then feel free to contact me and I’ll point you in the right direction.
Contact me via twitter (@josephshaw_)

