Code for blog at Data Engineering Best Practices - #2. Metadata & Logging
This is part of a series of posts about data engineering best practices:
- Data Engineering Best Practices - #1. Data flow & Code
- Data Engineering Best Practices - #2. Metadata & Logging
For project overview and architecture refer to this Data flow & code repo.
If you'd like to code along, you'll need
Prerequisite:
- git version >= 2.37.1
- Docker version >= 20.10.17 and Docker compose v2 version >= v2.10.2. Make sure that docker is running using
docker ps - pgcli
Run the following commands via the terminal. If you are using Windows, use WSL to set up Ubuntu and run the following commands via that terminal.
git clone https://github.com/josephmachado/data_engineering_best_practices_log.git
cd data_engineering_best_practices_log
make up # Spin up containers
make ddl # Create tables & views
make ci # Run checks & tests
make etl # Run etl
make spark-sh # Spark shell to check created tablesspark.sql("select partition from adventureworks.sales_mart group by 1").show() // should be the number of times you ran `make etl`
spark.sql("select count(*) from businessintelligence.sales_mart").show() // 59
spark.sql("select count(*) from adventureworks.dim_customer").show() // 1000 * num of etl runs
spark.sql("select count(*) from adventureworks.fct_orders").show() // 10000 * num of etl runs
:q // Quit scala shellYou can see the results of DQ checks and metadata as shown below. Open the metadata cli using make meta
select * from ge_validations_store limit 1;
select * from run_metadata limit 2;
exit
Use make down to spin down containers.
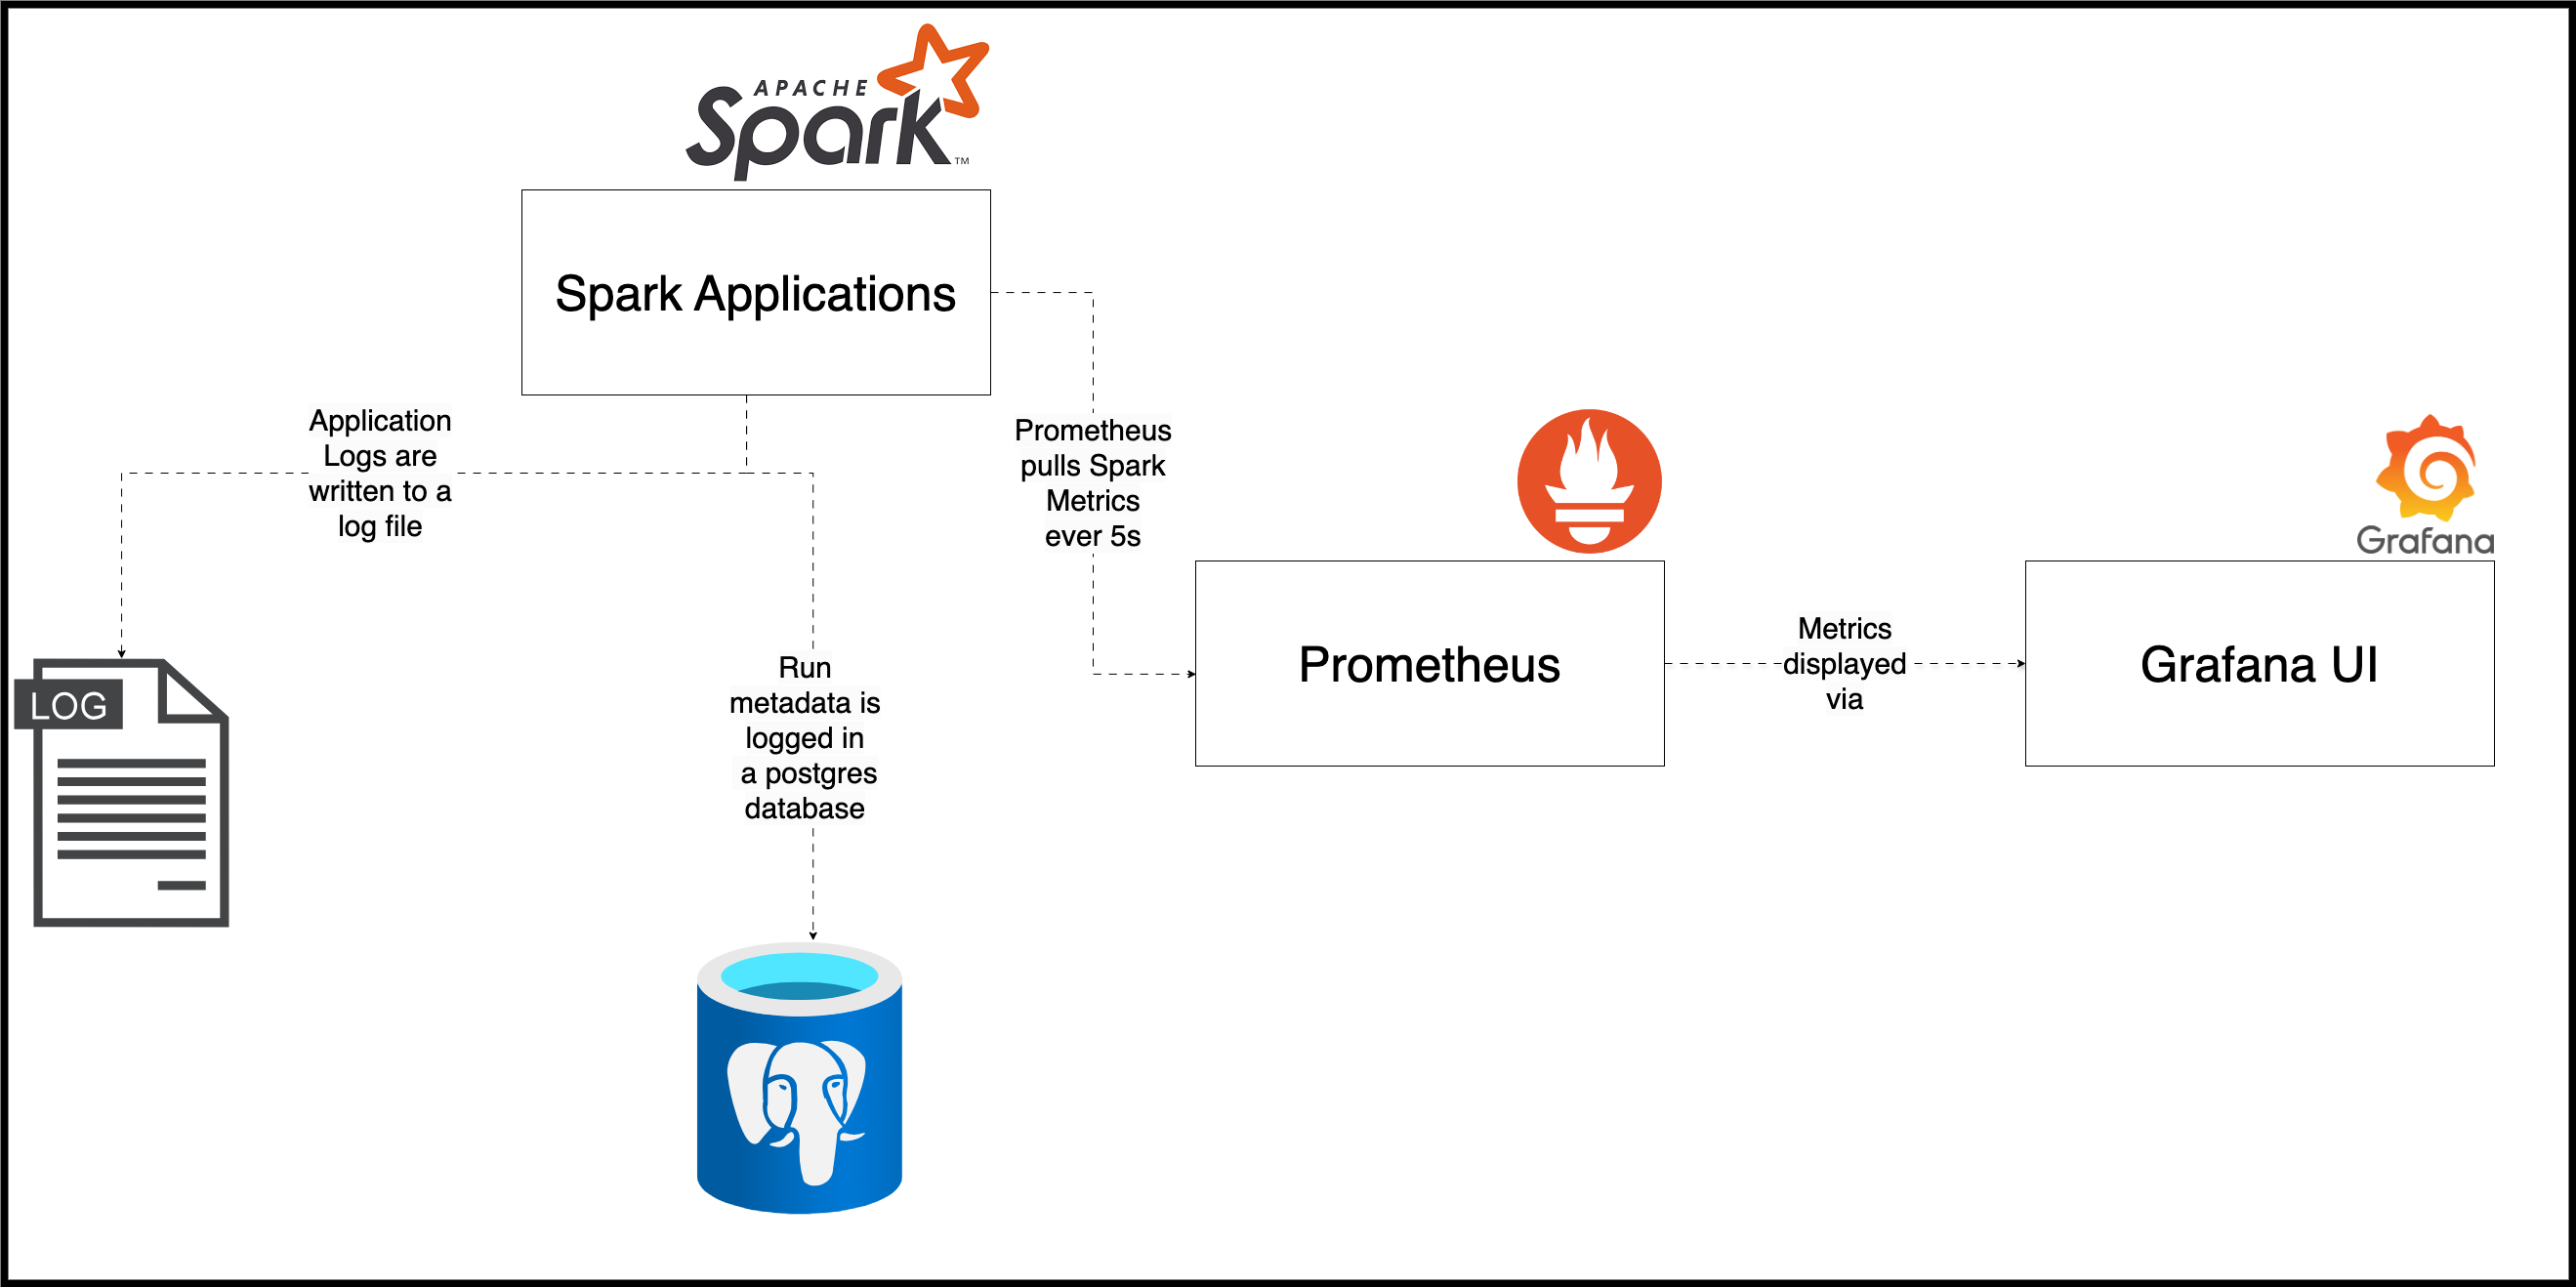
- Spark applications: We have spark standalone cluster. When we submit a spark job a new spark application will be created and its UI will be available at localhost:4040
- Metadata DB: We have a postgres container that is used to store results of data quality checks (run by Great Expectations) and we store run information (table: run_metadata) in this database as well. You can access the metadata db using the
make metacommand. - Prometheus: We have a Prometheus server running, and we have a Prometheus job that runs ever 5s (configured here) to pull spark metrics (via Spark PrometheusServlet). Prometheus is available at localhost:9090.
- Grafana: We have a Grafana service running as the UI for prometheus data. Grafana is available at localhost:3000, with username admin and password spark.
- Setup Dashboard configuration for Grafana to display Spark metrics.
- Move log storage from local filesystem to a service like Grafana Loki.
- Display metadata and Data quality results in Grafana UI.
- Add type information or make the metadata into a JSON.
