Understanding and analysing the memory usage of Haskell programs is a notoriously difficult yet important problem. Recent improvements to GHC's profiling capabilities, along with better tooling, has made it much easier to deeply and precisely analyse the memory usage characteristics of even large Haskell programs.
This workshop aims to present three such tools that allow high and low level
memory usage analysis of Haskell programs: eventlog2html, nothunks, and
ghc-debug. We will learn how to set up and use eventlog2html to generate
high-level visuals and statistics of our program's execution. We will also learn
how to set up and use ghc-debug to precisely and programmatically explore our
program's low-level memory usage profile.
We will examine these tools by using them on several pre-prepared Haskell programs. The workshop aims to be beneficial to Haskell programmers of all levels. Beginner Haskell programmers can expect to gain a deeper understanding of lazy evaluation and the impacts it can have on program performance. Experienced Haskell programmers can expect to gain an understanding of exactly what these tools have to offer and the skills necessary to use these tools on their own Haskell programs.
Make sure you have the tools installed and built. You need to use GHC 9.2.4 or greater. After that, in the root of this repository, run:
cabal build all
cabal install eventlog2html
cabal install ghc-debug-brick
And everything should be ready to go.
The primary goal of this workshop is for participants to gain experience and
familiarity with the eventlog2html and ghc-debug memory profiling tools, and
to observe how these tools complement one another in their features and use
cases.
A crucial step towards understanding the memory usage of Haskell programs is understanding Haskell's semantics as a lazy programming language. While thorough coverage of such semantics is outside the scope of this workshop, I do hope that much of what we cover will be approachable and enlightening to Haskell beginners and experts alike.
The ghc-debug style of debugging is, like Haskell, somewhat unique. In this
style, we have a debuggee and a debugger. The debuggee is the application
whose heap profile we would like to analyse. The debugger is the application
which will actually execute the analysis.
Communication between the debuggee and debugger happens over a socket, where the
debuggee simply responds to requests sent by the debugger. Crucially, it is
incredibly simple to turn a Haskell application into a debuggee for analysis
using ghc-debug debuggers, as we will see later.
With the above in mind, we can introduce ghc-debug as a set of libraries and
tools:
ghc-debug-stub: A library containing the functions you should include in your program to perform analysis withghc-debugdebuggers.ghc-debug-client: A library containing useful functions for writing your own heap analysis scripts.ghc-debug-brick: An executable terminal user interface application that can connect to any debuggee.
These aren't all of the packages involved, but they are the big three that we
care about as users of ghc-debug.
To get started in the workshop, we will be examining the example heap-shapes
application as a debuggee using ghc-debug-brick as our debugger. This will
serve as an introduction to the ghc-debug style of debugging, and it will
cover some examples of evaluation scenarios that will be important later in the
workshop.
The HIOBE Index server (in hiobe-index/server) is the application we would
like to profile with the eventlog2html, nothunks, and ghc-debug tools. It
is a simple scotty web server
application that serves data from a sqlite database on various endpoints. The
database is already populated with over 70000 rows. We will generate fake
traffic for the application which will cause interesting objects to build up on
the heap.
For a full description of the HIOBE Index, see its README.
We will spend the rest of the workshop analysing, understanding, and tuning the memory profile of the HIOBE Index server.
If you want to give it a try, run the server with:
cabal run hiobe-server
You should see the classic scotty Setting phasers to stun... output if
everything is okay.
Then run the traffic with:
cabal run hiobe-traffic
Some output should start scrolling by reporting various requests to the server.
We know this program has bad space behavior, because I wanted it to. However, we
don't know how bad it is. We'll try to get a very high-level view of its
profile by using the -s RTS flag, which prints memory usage statistics on
program termination. This is usually a great place to start when profiling a
Haskell program's space usage.
In our case, we will find that the reported memory usage of the HIOBE server is a little high. Indeed, if we run the application for longer or shorter periods of time, the reported memory usage grows and shrinks! This indicates a non-constant space complexity that we should probably be concerned about.
We can dig deeper by having our program emit an
eventlog
using the -l RTS option. However, to make the eventlog useful for
eventlog2html, we need to supply another flag that enables heap profiling! To
start, we'll use the
-hT
flag to tell the RTS to break down the heap profile by closure type.
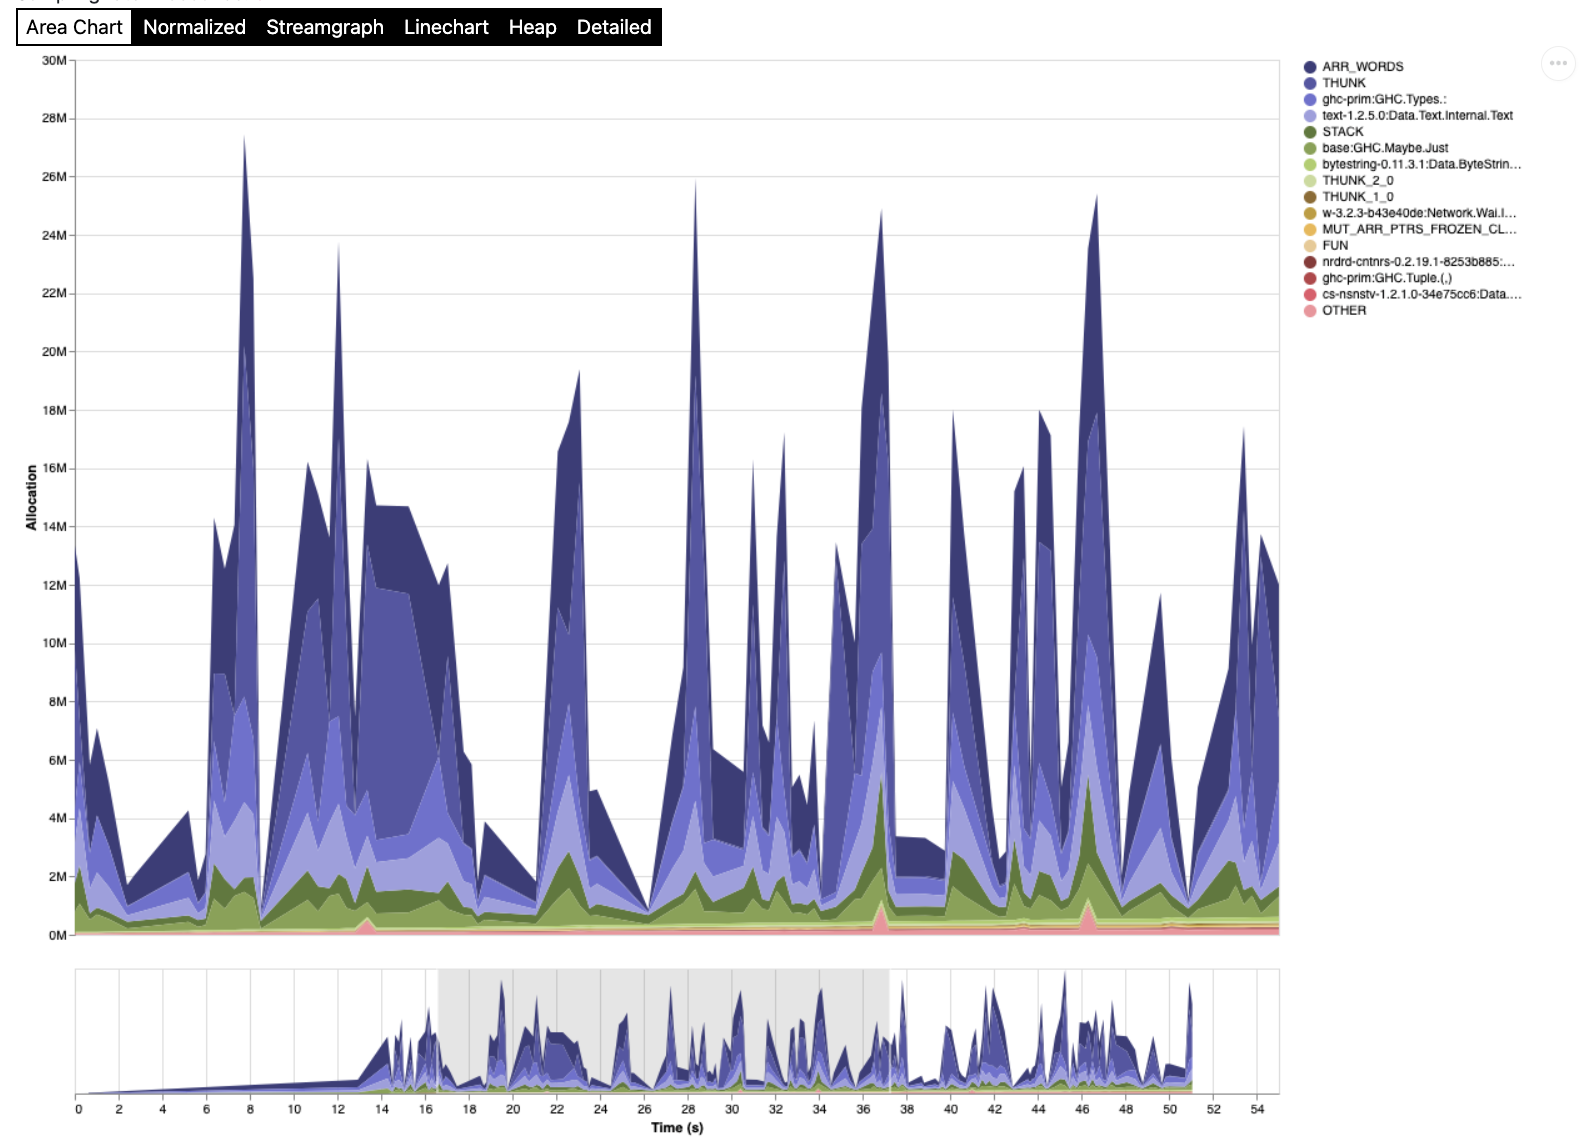
In the resulting profile, we see big spikes of allocations happening with
ARR_WORDS, THUNK, and : closures:

For the rest of the workshop, we will use eventlog2html and ghc-debug to
answer some very precise questions about the HIOBE server's memory profile.