Creating xaringan slides using the useR! theme

Welcome to useR, in this repository you will find a template that shows the use of the "useR" xaringan theme.

Installation

I you have not installed the xaringan package, run this command in your RStudio session:

if (!requireNamespace("remotes", quietly = TRUE))
    install.packages("remotes")

remotes::install_github("yihui/xaringan")

Creating a presentation

Use the template.Rmd file with the 'useR' and 'useR-fonts' theme to start writing your conference presentation.

Alternatively, use File > New file > Rmarkdown > From template > Ninja Presentation to start editing a new xaringan presentation.

Add "css: [useR, useR-fonts]" in the YAML header to specify that you want to use the useR and useR-fonts in your presentation.

Here are some captions of how your presentation would looks like:

We start with a title slide

An example of a title slide including the useR conference logo in the top left corner and the presentation's title and presenter's name in the bottom left corner

We have provided font sizes that can be seen even from small screens.

An example slide showing the appropiate font size of the headers included in the xaringan theme configuration, as well as the font size of some R code

You can use the chapter slide to separate different sections in your presentation

A slide of class "chapter" with blue background and the word "Chapter" in light grey color at the left center of the slide

Also, you can include some code and results:

In the left column: An example histogram created with the default ggplot2 color scale, showing three curves in pink, green and blue. In the right column: four panels showing how the histogram curves look with four different color-vision-deficiencies

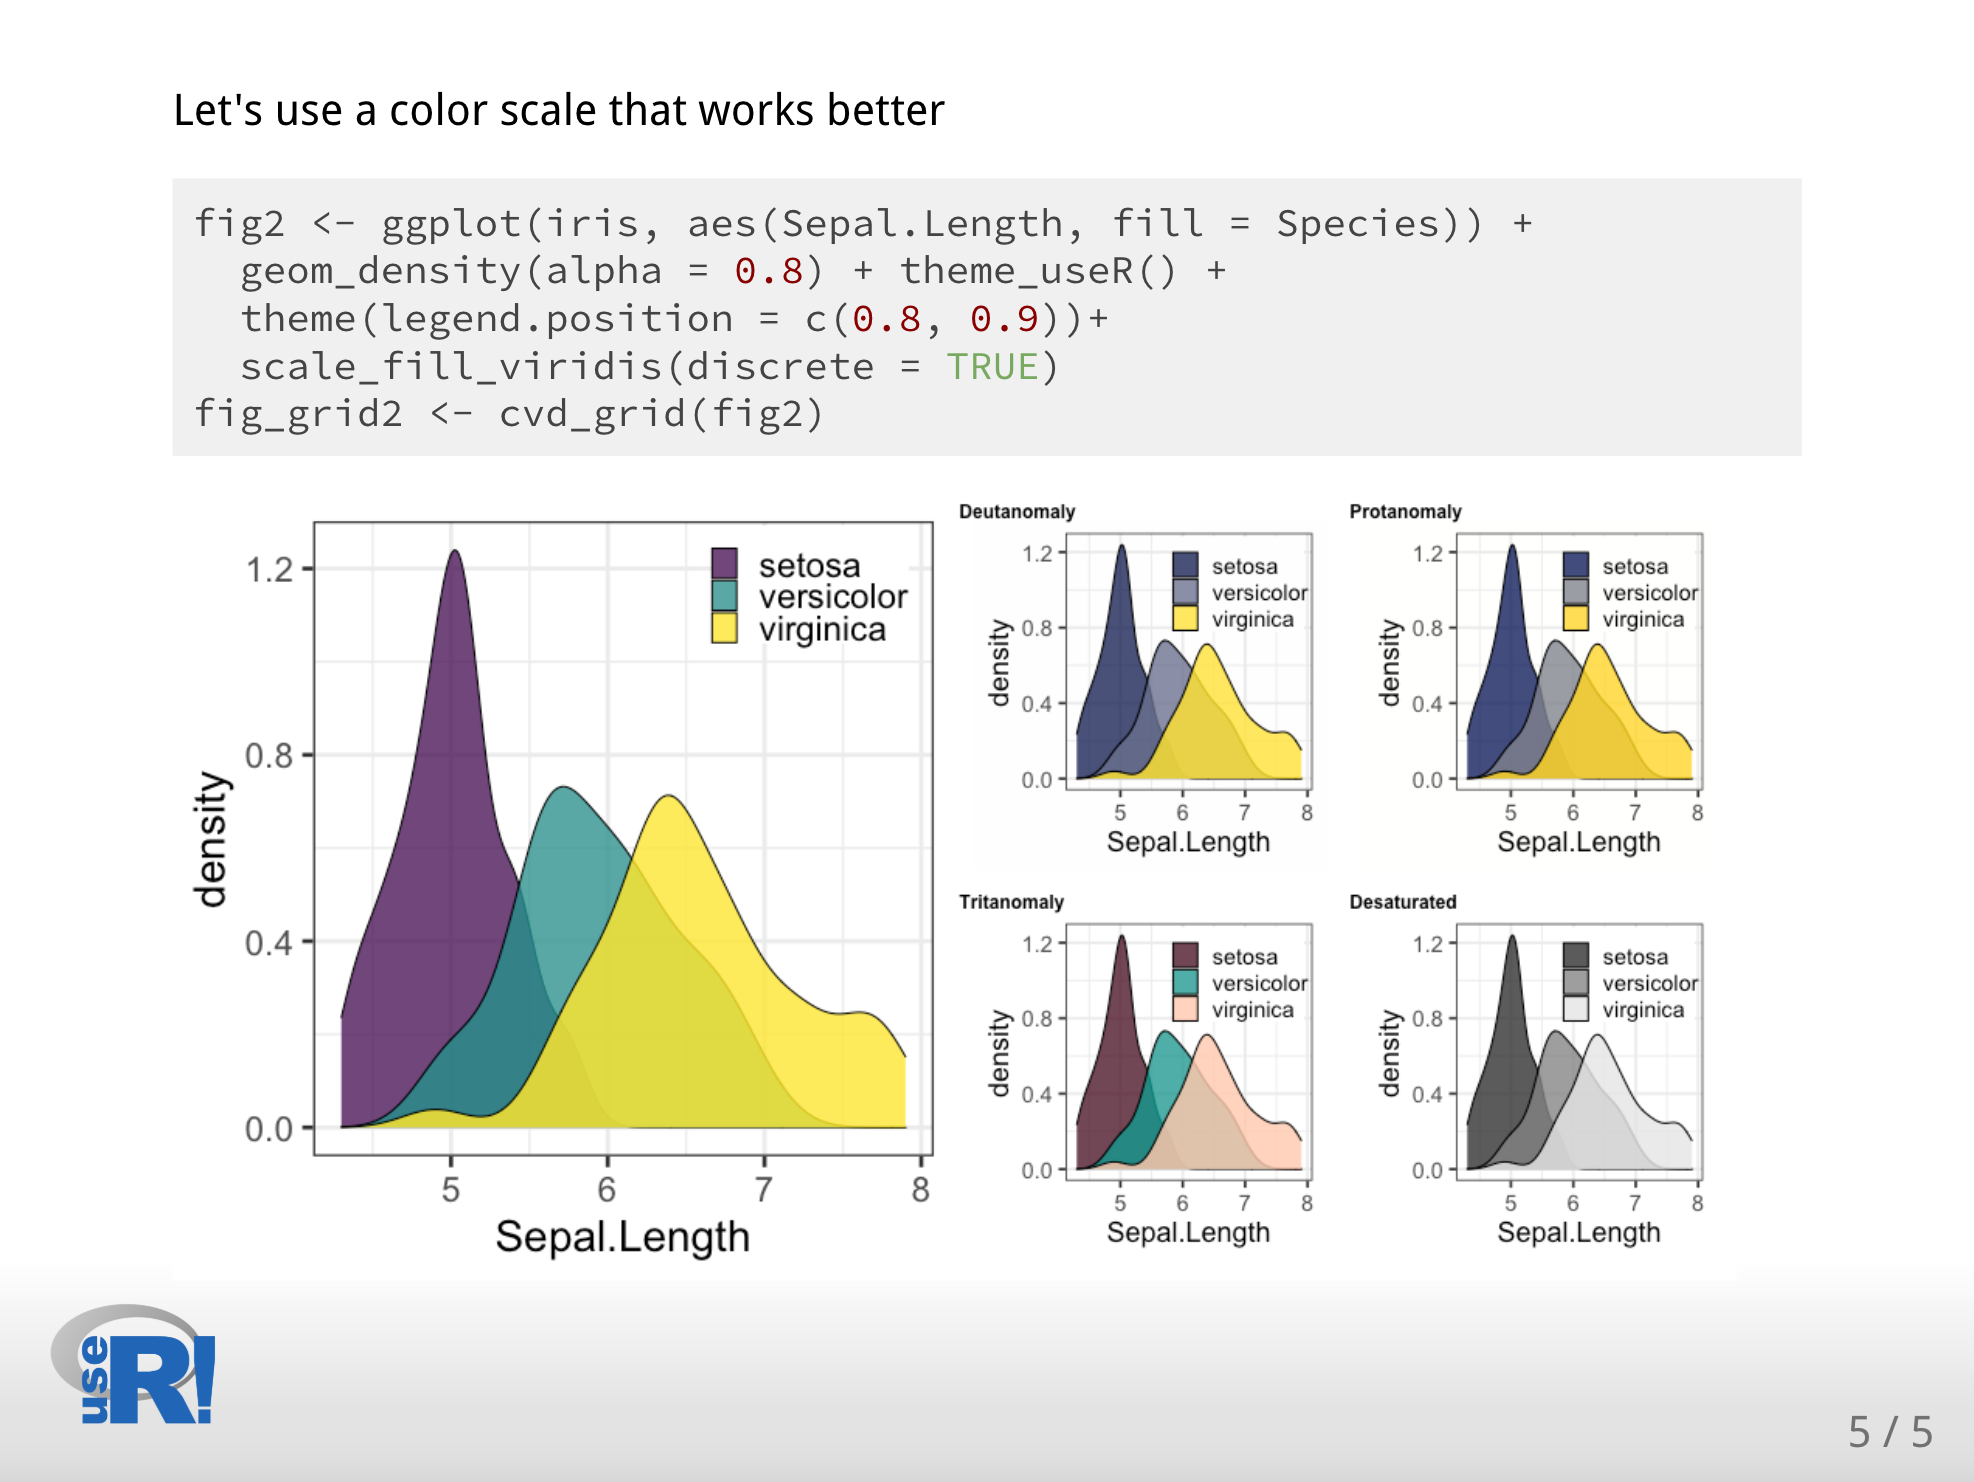
If you are showing ggplot2 plots, we recommend to use the viridis package to set colorblind-friendly scales:

In the left column: The histogram created with ggplot2 now includes a colorblind-friendly scale, showing three curves in purple, green and yellow. In the right column: four panels showing how the histogram curves look with four different color-vision-deficiencies

Please, include Alternative text in your figures to facilitate their interpretation using screen readers.

If this is your first time using alternative text, this article could be helpful. Also, if you want to ensure that your alt-text is clear, this article will guide you to activate the VoiceOver screen reader and listen how your alternative text will sound.