Prince uses pandas to manipulate dataframes, as such it expects an initial dataframe to work with. In the following example, a Principal Component Analysis (PCA) is applied to the iris dataset. Under the hood Prince decomposes the dataframe into two eigenvector matrices and one eigenvalue array thanks to a Singular Value Decomposition (SVD). The eigenvectors can then be used to project the initial dataset onto lower dimensions.
import matplotlib.pyplot as plt
import pandas as pd

import prince


df = pd.read_csv('data/iris.csv')

pca = prince.PCA(df, n_components=4)

fig1, ax1 = pca.plot_cumulative_inertia()
fig2, ax2 = pca.plot_rows(color_by='class', ellipse_fill=True)

plt.show()
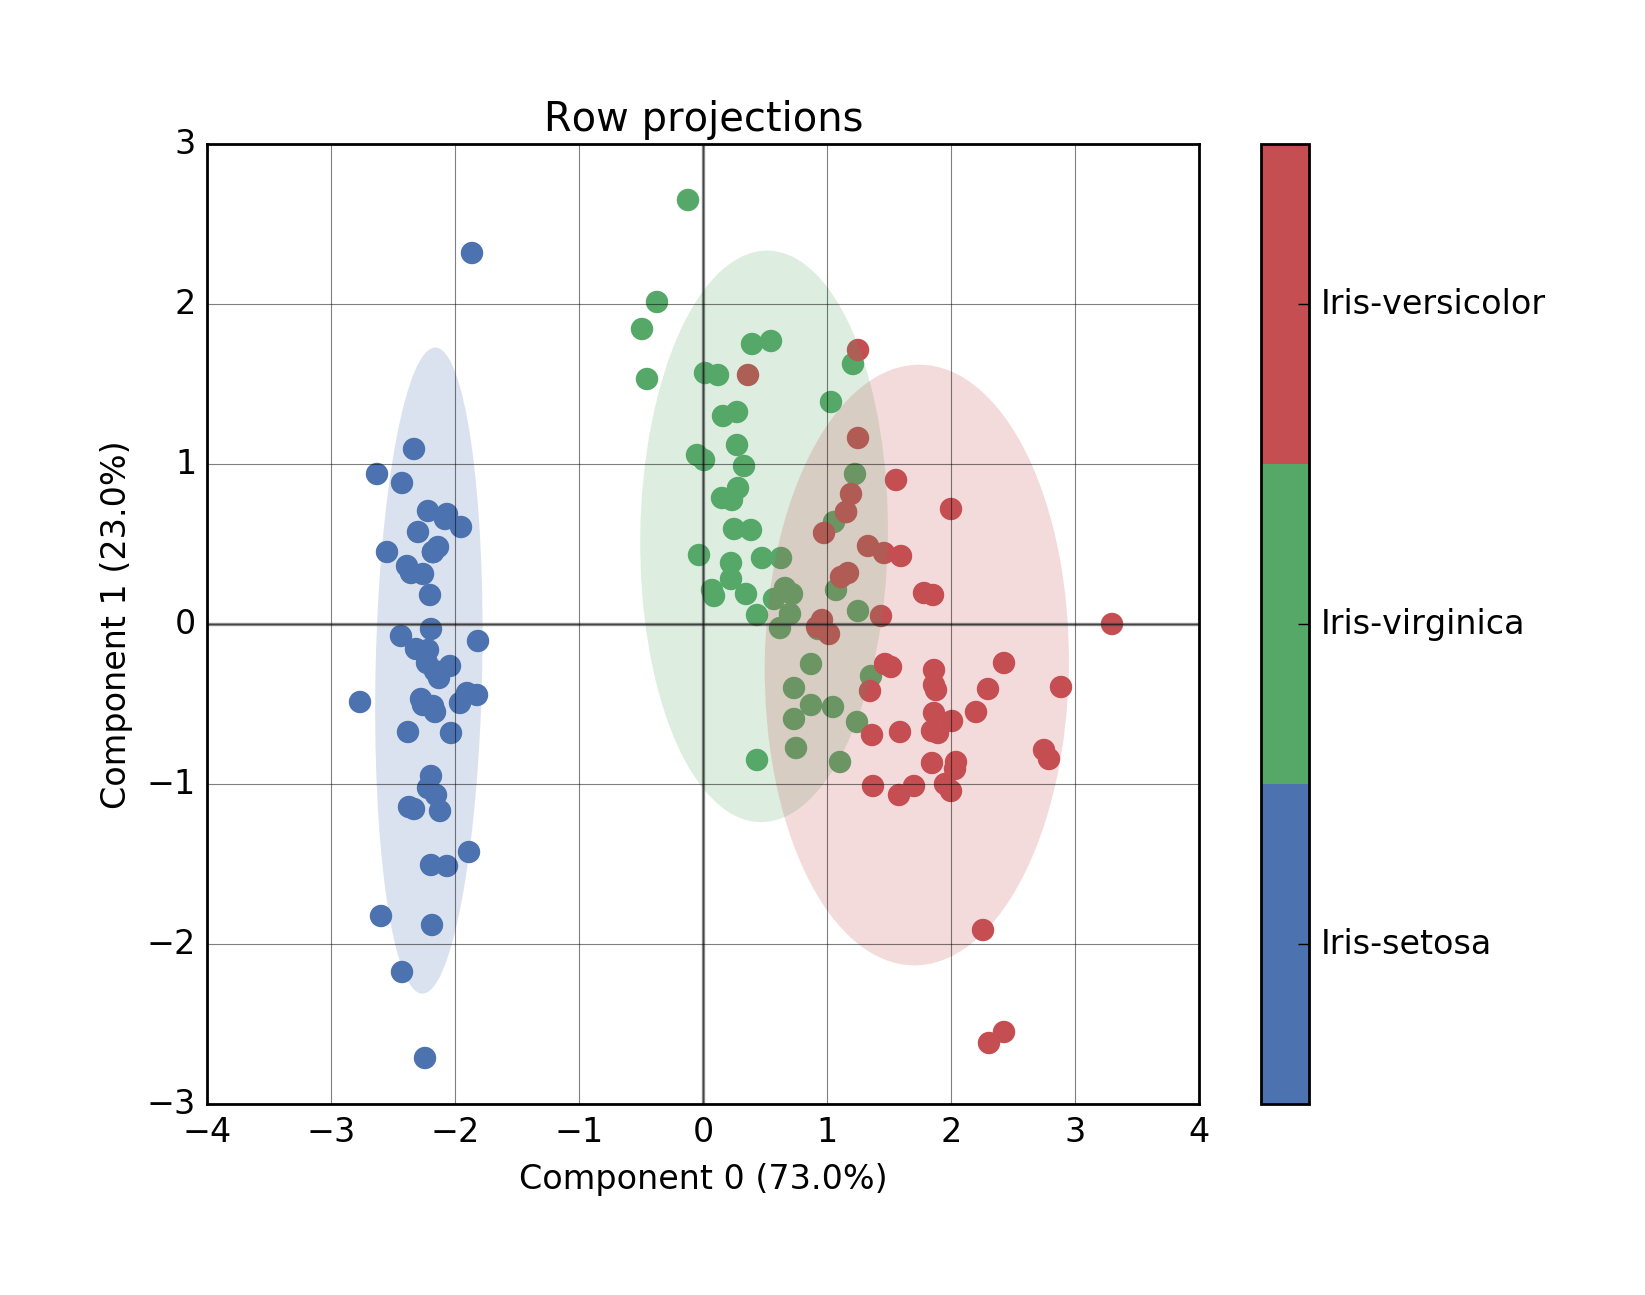
The first plot displays the rows in the initial dataset projected on to the two first right eigenvectors (the obtained projections are called principal coordinates). The ellipses are 90% confidence intervals.
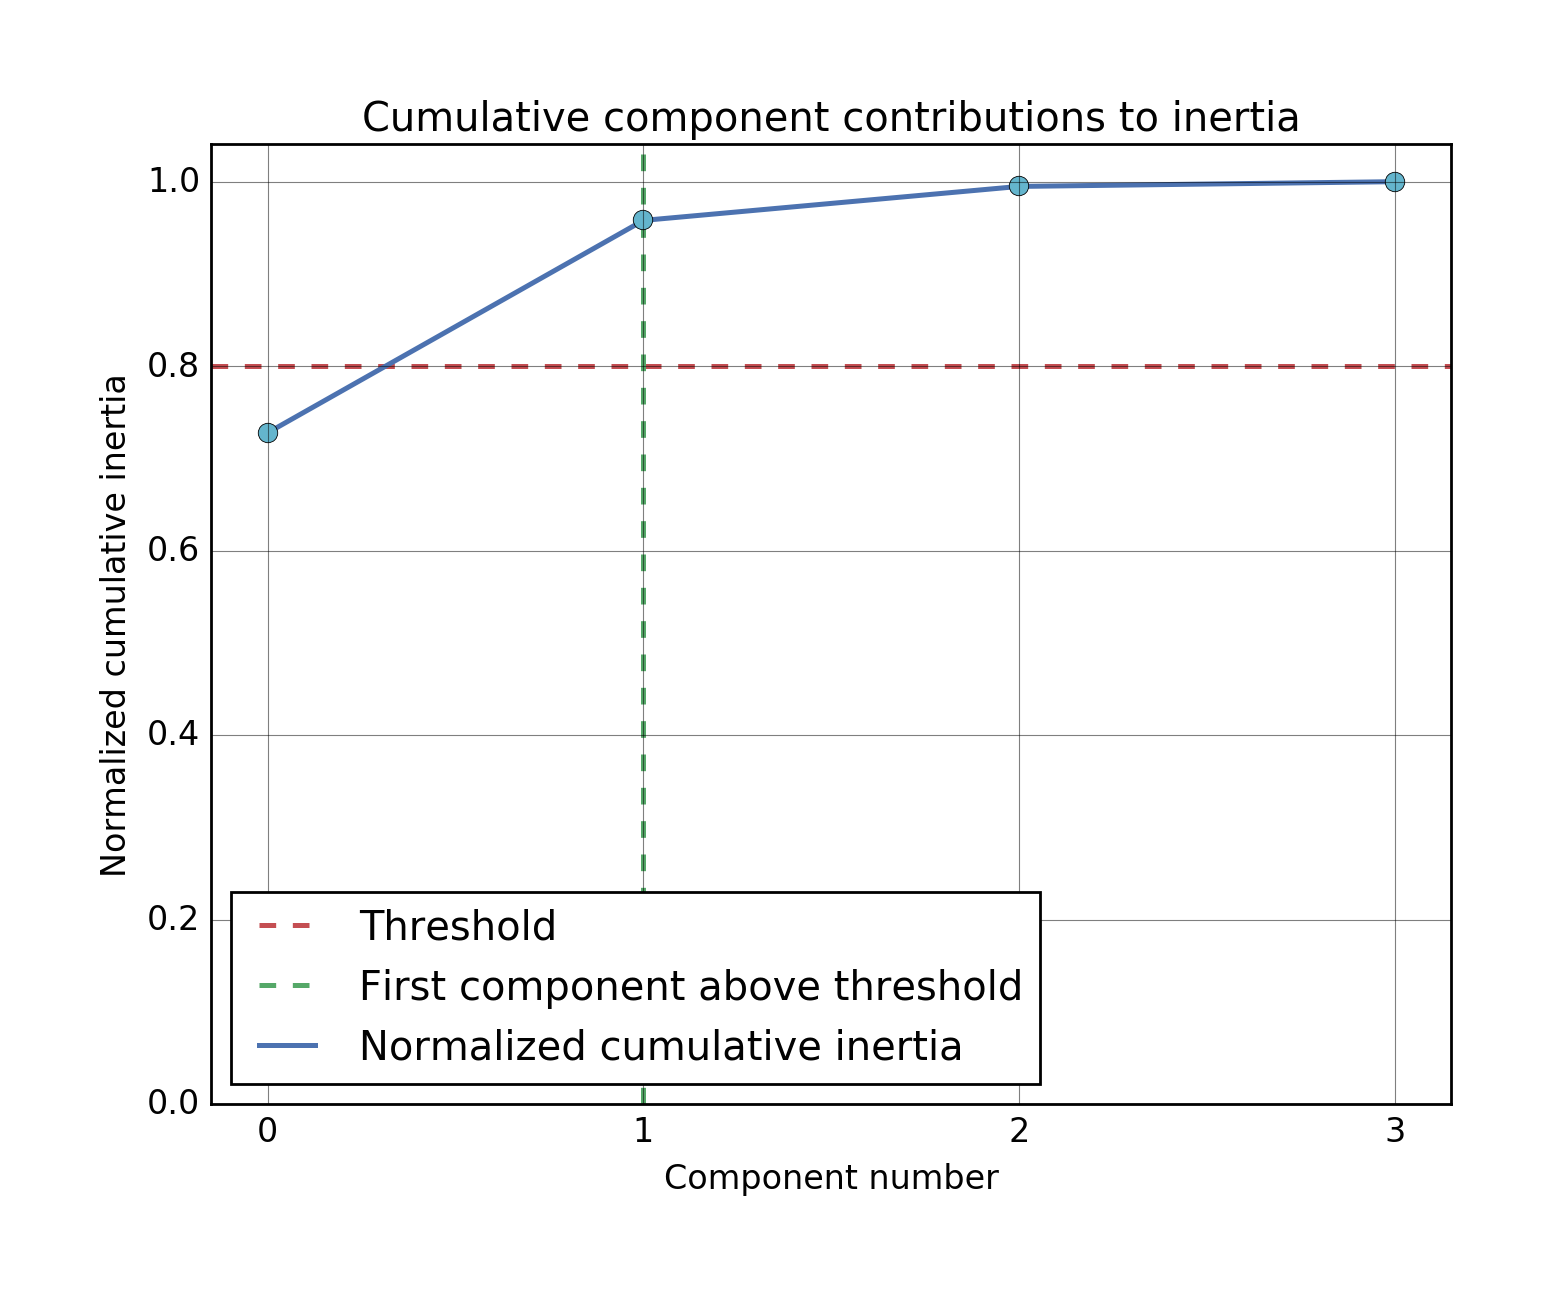
The second plot displays the cumulative contributions of each eigenvector (by looking at the corresponding eigenvalues). In this case the total contribution is above 95% while only considering the two first eigenvectors.
Although it isn't a requirement, using Anaconda is a good idea in general for doing data science in Python.
Via PyPI
$ pip install princeVia GitHub for the latest development version
$ pip install git+https://github.com/MaxHalford/PrincePrince has the following dependencies:
- pandas for manipulating dataframes
- matplotlib as a default plotting backend
- fbpca, Facebook's randomized SVD implementation
Please check out the documentation for a list of available methods.


