Interface to d3.format JavaScript library to format numbers for human consumption. The goal is to use the same way to format numbers in different htmlwidget packages such as highcharter, apexcharter, echarts4r and more.
You can install the development version from GitHub with:
# install.packages("devtools")
devtools::install_github("dreamRs/d3.format")Format numbers like in d3 :
library(d3.format)

# thousand separator
d3_format(",")(1e9)
#> [1] "1,000,000,000"

# Percentage
d3_format("%")(0.12)
#> [1] "12.000000%"

# SI prefix
d3_format(".1s")(c(1e-3, 0, 1e3, 1e6, 1e9, 1e12))
#> [1] "1m" "0"  "1k" "1M" "1G" "1T"

# Currency
d3_format("$")(100)
#> [1] "$100"

# Fixed width and centered
d3_format("^20")(42)
#> [1] "         42         "

# Use local
d3_format(",", locale = "fr-FR")(c(1e-3, 0, 1e3, 1e6, 1e9))
#> [1] "0,001"         "0"             "1 000"         "1 000 000"
#> [5] "1 000 000 000"
More examples here.
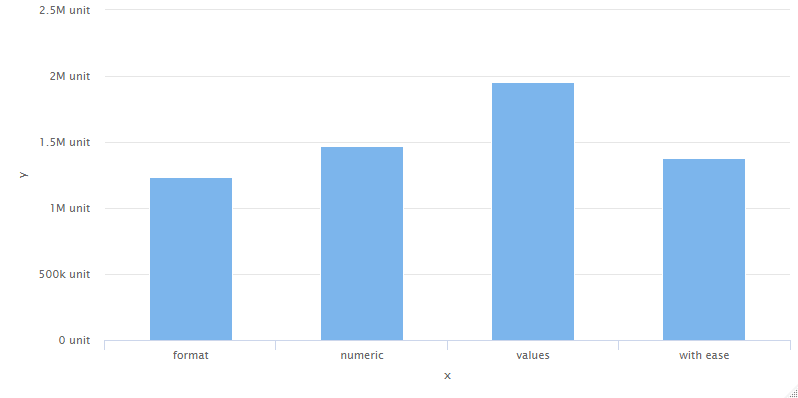
With highcharter :
library(d3.format)
dat <- data.frame(
  x = c("format", "numeric", "values", "with ease"),
  y = c(1233172L, 1467863L, 1953877L, 1382088L)
)

library(highcharter)
hchart(dat, mapping = hcaes(x, y), type = "column") %>%
  use_d3_format() %>%
  hc_yAxis(labels = list(
    formatter = d3_format_js(",.3~s", suffix = " unit")
  ))
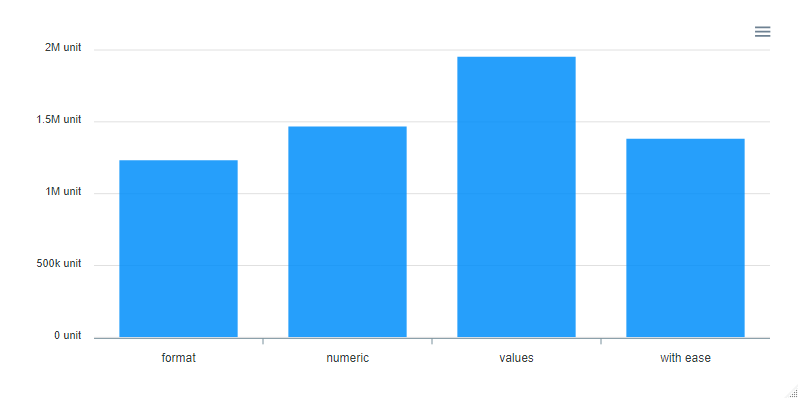
With apexcharter :
library(apexcharter)
apex(dat, aes(x, y), "column") %>%
  use_d3_format() %>%
  ax_yaxis(labels = list(
    formatter =  d3_format_js(",.3~s", suffix = " unit")
  ))
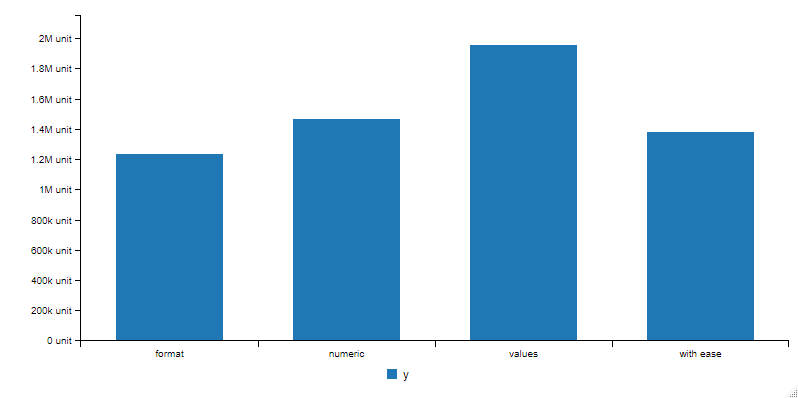
With billboarder :
library(billboarder)
billboarder(data = dat) %>%
  bb_aes(x = x, y = y) %>%
  bb_barchart() %>%
  use_d3_format() %>%
  bb_y_axis(
    tick = list(
      format = d3_format_js(",.3~s", suffix = " unit")
    )
  )
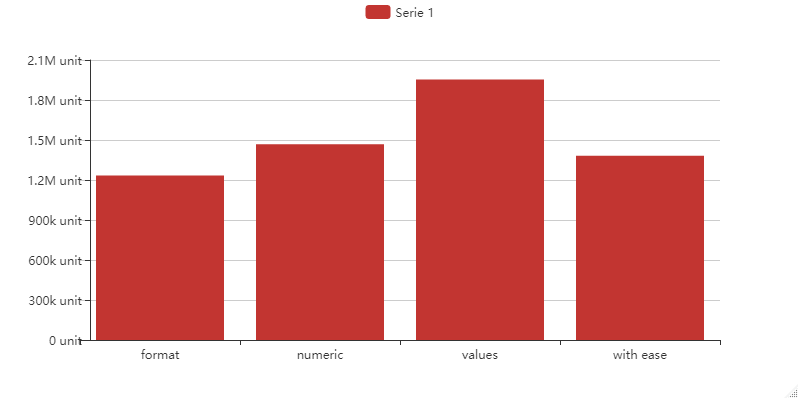
With echarts4r :
library(echarts4r)
dat %>%
  e_charts(x) %>%
  use_d3_format() %>%
  e_bar(y, name = "Serie 1") %>%
  e_y_axis(
    formatter = d3_format_js(",.3~s", suffix = " unit"),
    offset = -10
  )
You can also use it with ggplot2 :
library(ggplot2)
ggplot(dat) +
  geom_col(aes(x, y)) +
  scale_y_continuous(labels = d3_format("$,.3~s"))


