The goal of TMPM2 is to provide an update to the R package tmpm: Trauma Mortality Prediction Model.
The core function of the package, tmpm2, calculates probability of
death (pDeath) based on the Trauma Mortality Prediction Model created
by Turner Osler, MD, MSc and Laurent Glance, MD. tmpm2 uses injuries
recorded in AIS, ICD-9-CM, or ICD-10-CM and computes the probability of
death for each patient in the dataset. tmpm2 can accommodate datasets
arranged in wide format (one row per patient with one or more injuries
per row) or the long format (one or more rows per patient, with one
injury per row).
TMPM2 offers several improvements over its predecessor. Most notably,
TMPM2 offers more accurate calculations of pDeath by using equations
that are specific to each diagnosis lexicon (AIS, ICD-9-CM, and
ICD-10-CM). In contrast, tmpm relies on approximate crosswalks of
diagnosis codes so that the same set of equations can be used for all
three diagnosis lexicons. See the Details section in
help("tmpm2", TMPM2) for more information. Additionally, by utilizing
vectorized code, TMPM2 is much faster than tmpm for datasets of even
moderate size. Finally, and more subjectively, TMPM2 offers ease-of-use
improvements over tmpm by: automatically detecting the diagnosis lexicon
in use, being more flexible in the structure of the dataset, and having
easier to understand syntax and argument names.
You can install the development version of TMPM2 from GitHub with:
# install.packages("devtools")
devtools::install_github("jrf1111/TMPM")This is a basic example that shows you how to use the package:
library(TMPM2)

test = tibble::tribble(
~id , ~dx,
1, "S36114A",
1, "S27321A",
1, "S301XXA",
1, "S40022A",
1, "S7001XA",
2, "S20212A",
2, "S301XXA",
2, "S42032A",
3, "S82031A",
4, "S72012A")

tmpm2(data = test, id = id, long = TRUE)
#>
#> icd10 diagnosis codes detected
#> # A tibble: 10 × 2
#>       id  pDeath
#>    <dbl>   <dbl>
#>  1     1 0.0178
#>  2     1 0.0178
#>  3     1 0.0178
#>  4     1 0.0178
#>  5     1 0.0178
#>  6     2 0.0128
#>  7     2 0.0128
#>  8     2 0.0128
#>  9     3 0.00186
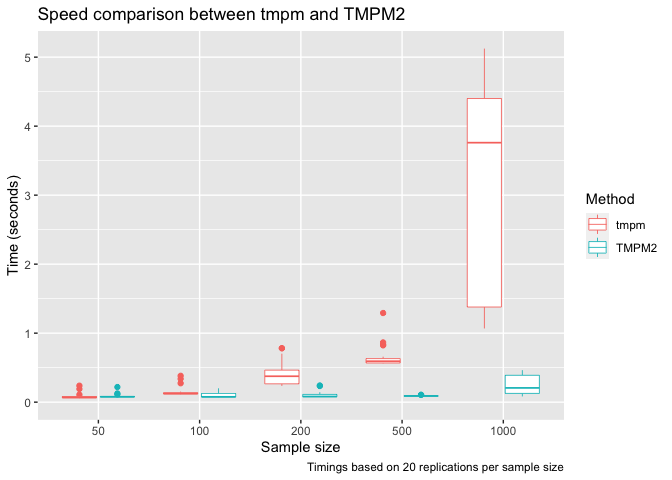
#> 10 4 0.0208TMPM2 is much faster than tmpm for datasets of even moderate size.
Click to see code
library(tmpm)
#> Loading required package: reshape2
library(TMPM2)
suppressPackageStartupMessages(library(tidyverse))
ns = c(50, 100, 200, 500, 1000) #number of "patients"
reps = 20 #number of replications
results = data.frame(
n = rep(ns, each = reps),
tmpm = NA,
TMPM2 = NA
)
for(i in 1:nrow(results)){
#make some fake ICD-9 injury diagnosis data
set.seed(i)
dat = data.frame(
replicate(
n = 10, #10 columns of diagnoses
round(runif(n = results$n[i], #number of "patients"
min = 800, max = 959.9),
digits = 2)))
dat$ID = 1:nrow(dat)
#put ID column first (required for tmpm)
dat = dat[, c("ID", paste0("X", 1:10) )]
results$tmpm[i] = system.time(tmpm(Pdat = dat, ILex = 9, Long = FALSE))["elapsed"]
results$TMPM2[i] = system.time(tmpm2(data = dat, id = ID, lex = "icd9",
long = FALSE, legacy = TRUE))["elapsed"]
}tab = results %>%
group_by(n) %>%
summarise(
`tmpm duration` = median(tmpm),
`TMPM2 duration` = median(TMPM2),
Ratio = median(tmpm)/median(TMPM2)
) %>%
knitr::kable(digits = 2,
caption = "Median durations in seconds",
format = "html"
)
p = results %>%
pivot_longer(
cols = -n
) %>%
ggplot(aes(x = as.factor(n), y = value, color = name)) +
geom_boxplot(size = 0.3) +
scale_y_continuous(limits = c(0, NA))+
labs(
title = "Speed comparison between tmpm and TMPM2",
caption = paste("Timings based on", reps, "replications per sample size"),
x = "Sample size",
y = "Time (seconds)",
color = "Method"
)| n | tmpm duration | TMPM2 duration | Ratio |
|---|---|---|---|
| 50 | 0.07 | 0.08 | 0.87 |
| 100 | 0.12 | 0.08 | 1.61 |
| 200 | 0.38 | 0.08 | 4.55 |
| 500 | 0.59 | 0.09 | 6.59 |
| 1000 | 3.76 | 0.21 | 18.21 |
all.equal(
    tmpm(Pdat = dat, ILex = 9, Long = FALSE)[, "pDeath"],
    tmpm2(data = dat, id = ID, lex = "icd9",
                long = FALSE, legacy = TRUE)[, "pDeath"]
)
#> Initializing ICD-9 Mortality Model Prediction
#> Mortality Model Prediction Complete
#> [1] TRUE

benchmarkme::get_cpu()
#> $vendor_id
#> [1] "GenuineIntel"
#>
#> $model_name
#> [1] "Intel(R) Core(TM) i7-7920HQ CPU @ 3.10GHz"
#>
#> $no_of_cores
#> [1] 8
benchmarkme::get_ram()
#> 17.2 GB
sessionInfo()
#> R version 4.2.1 (2022-06-23)
#> Platform: x86_64-apple-darwin17.0 (64-bit)
#> Running under: macOS Big Sur ... 10.16
#>
#> Matrix products: default
#> BLAS:   /Library/Frameworks/R.framework/Versions/4.2/Resources/lib/libRblas.0.dylib
#> LAPACK: /Library/Frameworks/R.framework/Versions/4.2/Resources/lib/libRlapack.dylib
#>
#> locale:
#> [1] en_US.UTF-8/en_US.UTF-8/en_US.UTF-8/C/en_US.UTF-8/en_US.UTF-8
#>
#> attached base packages:
#> [1] stats     graphics  grDevices utils     datasets  methods   base
#>
#> other attached packages:
#>  [1] forcats_0.5.1    stringr_1.4.0    dplyr_1.0.9      purrr_0.3.4
#>  [5] readr_2.1.2      tidyr_1.2.0      tibble_3.1.8     ggplot2_3.3.6
#>  [9] tidyverse_1.3.2  tmpm_1.0.3       reshape2_1.4.4   TMPM2_0.0.0.9100
#>
#> loaded via a namespace (and not attached):
#>  [1] httr_1.4.3            jsonlite_1.8.0        foreach_1.5.2
#>  [4] modelr_0.1.8          assertthat_0.2.1      highr_0.9
#>  [7] googlesheets4_1.0.0   cellranger_1.1.0      yaml_2.3.5
#> [10] pillar_1.8.0          backports_1.4.1       lattice_0.20-45
#> [13] glue_1.6.2            digest_0.6.29         rvest_1.0.2
#> [16] colorspace_2.0-3      htmltools_0.5.2       Matrix_1.4-1
#> [19] plyr_1.8.7            pkgconfig_2.0.3       broom_1.0.0
#> [22] haven_2.5.0           scales_1.2.0          tzdb_0.3.0
#> [25] googledrive_2.0.0     generics_0.1.3        farver_2.1.1
#> [28] tidytable_0.8.0       ellipsis_0.3.2        withr_2.5.0
#> [31] cli_3.3.0             magrittr_2.0.3        crayon_1.5.1
#> [34] readxl_1.4.0          evaluate_0.15         fs_1.5.2
#> [37] fansi_1.0.3           doParallel_1.0.17     xml2_1.3.3
#> [40] benchmarkme_1.0.8     tools_4.2.1           data.table_1.14.2
#> [43] hms_1.1.1             gargle_1.2.0          lifecycle_1.0.1
#> [46] munsell_0.5.0         reprex_2.0.1          compiler_4.2.1
#> [49] rlang_1.0.4           grid_4.2.1            iterators_1.0.14
#> [52] rstudioapi_0.13       labeling_0.4.2        rmarkdown_2.14
#> [55] gtable_0.3.0          codetools_0.2-18      DBI_1.1.3
#> [58] benchmarkmeData_1.0.4 R6_2.5.1              lubridate_1.8.0
#> [61] knitr_1.39            fastmap_1.1.0         utf8_1.2.2
#> [64] stringi_1.7.8         parallel_4.2.1        Rcpp_1.0.9
#> [67] vctrs_0.4.1           dbplyr_2.2.1          tidyselect_1.1.2
#> [70] xfun_0.31