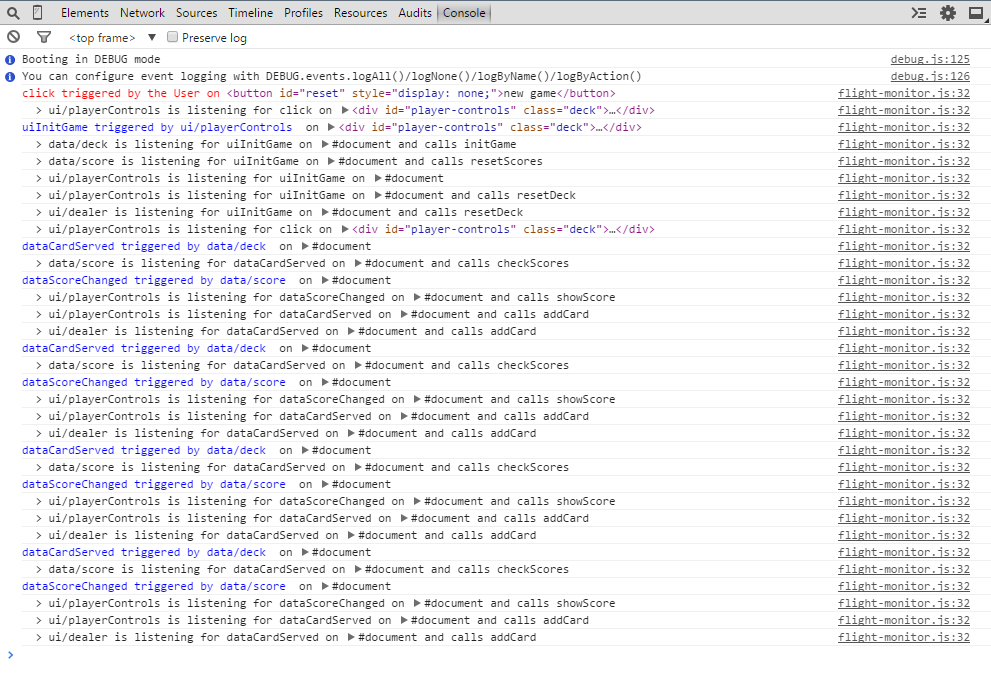
A useful library for FlightJS to monitor and debug event flows. Provides more information than the basic flight debug tool and gives you the ability to break/step/continue execution of your event flow. The library cannot be used together with the default flight debug tool, as it is overwriting some parts of it.
To install you can just use bower:
bower install flight-monitor
In order to use the library, please make sure you have the following rule in your requireJS paths config:
flight: 'bower_components/flight'
Use require to load the library before setting up your flight components. This way it can hook into the event listeners.
var flightMonitor = require('bower_components/flight-monitor/flight-monitor');
flightMonitor.config.showMethodInfo = false; // overwrite some default options

// components to track
require('data/myDataComponent').attachTo(document);
...
Logging flags
- showElementInfo :: shows the associated element [default true]
- showMethodInfo :: shows the method name (or method body for anonym functions) [default true]
- showDataInfo :: shows the data sent with the event [default false]
- showEventId :: shows the #id number for the event so you can identify them easier [default false]
- showMixins :: displays all mixins with the component name [default false]
- showStopped :: when you step your flow this option will log you all stopped events and callbacks as they are queued up [default false]
And your logging is already in operation. Flight-monitor logs all events triggered on the site and shows all components reacting to that event. It can show the method used in the component (if the method is named) and it is able to generate a data structure representing the event flow.
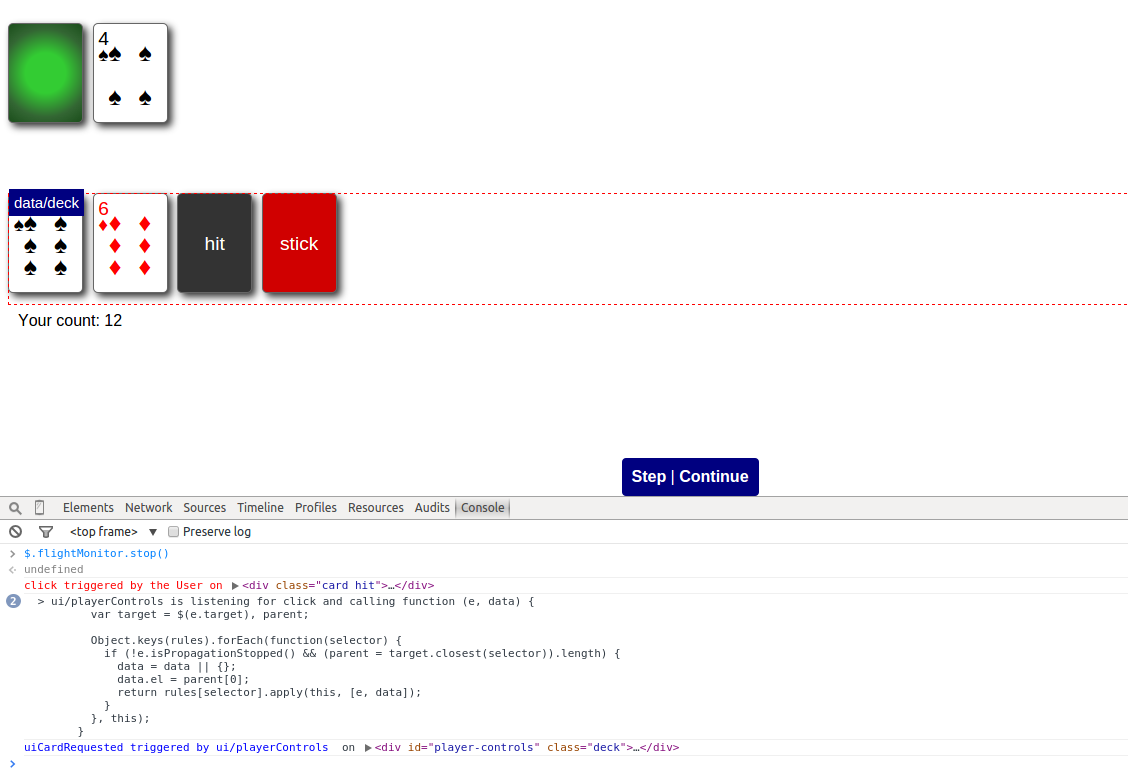
With flightMonitor you can stop your flight app's event flow and continue step by step. The library can stop all event triggers and callbacks as it is hooked into jQuery's trigger and has control over all callback calls.
$.flightMonitor.stop();

$.flightMonitor.step();
/* console:
  > ui/yourComponent is listening for uiSomeEventWasTriggered and calling function (ev, data) {
  ...
  }
*/
...

$.flightMonitor.run();
There is a nice debug GUI which shows the active component on the page and the associated DOM element as well. The Step/Continue buttons appear on the bottom of the page and you can click through your application flow easily.
Development in progress:
- setting watch for component attributes and alert when they change
- trying to access callbacks from the flight this.on({ selector: callback }) method
- visualization for the event flow - the data is already being collected in a processable format but the visualization is only in an alpha phase

