Microservices Status Page. Monitors a distributed infrastructure and sends alerts (Slack, SMS, etc.).
Vigil is an open-source Status Page you can host on your infrastructure, used to monitor all your servers and apps, and visible to your users (on a domain of your choice, eg. status.example.com).
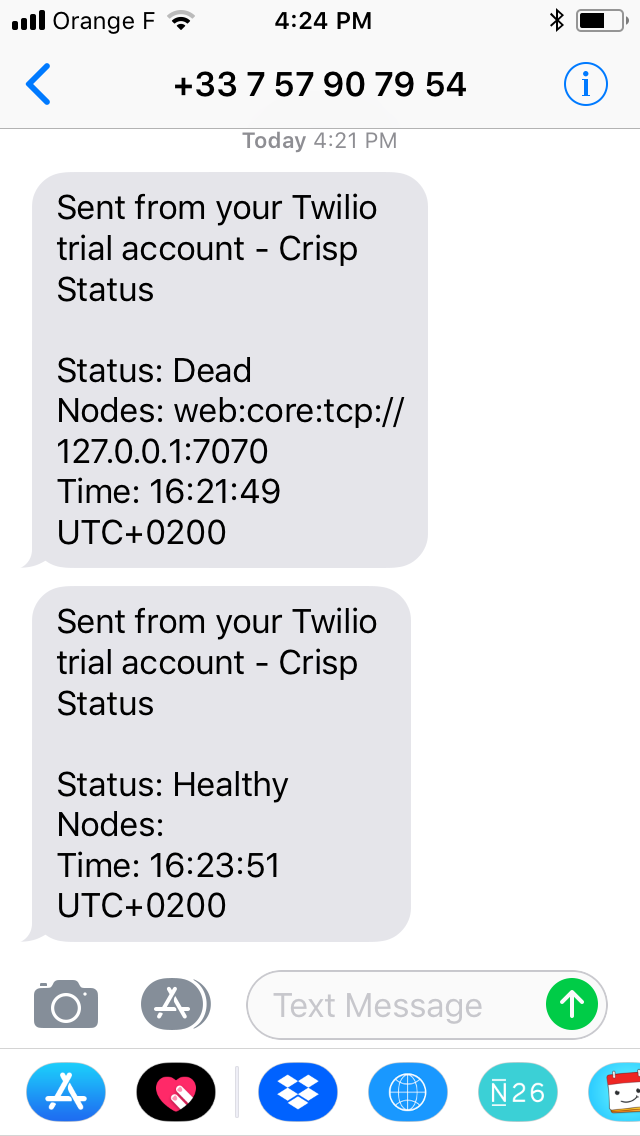
It is useful in microservices contexts to monitor both apps and backends. If a node goes down in your infrastructure, you receive a status change notification in a Slack channel, Email, Twilio SMS or/and XMPP.
Tested at Rust version: rustc 1.48.0-nightly (7f7a1cbfd 2020-09-27)
🇭🇺 Crafted in Budapest, Hungary.
👉 See a live demo of Vigil on Crisp Status Page.
📰 The Vigil project was announced in a post on my personal journal.
| Crisp | Meili | miragespace | Redsmin | Image-Charts |
👋 You use Vigil and you want to be listed there? Contact me.
- Monitors your infrastructure services automatically
- Notifies you when a service gets down or gets back up via a configured channel:
- Twilio (SMS)
- Slack
- Telegram
- Pushover
- XMPP
- Webhook
- Generates a status page, that you can host on your domain for your public users (eg.
https://status.example.com)
Vigil monitors all your infrastructure services. You first need to configure target services to be monitored, and then Vigil does the rest for you.
There are three kinds of services Vigil can monitor:
- HTTP / TCP / ICMP services: Vigil frequently probes an HTTP, TCP or ICMP target and checks for reachability
- Application services: Install the Vigil Reporter library eg. on your NodeJS app and get reports when your app gets down, as well as when the host server system is overloaded
- Local services: Install a slave Vigil Local daemon to monitor services that cannot be reached by the Vigil master server (eg. services that are on a different LAN)
It is recommended to configure Vigil, Vigil Reporter or Vigil Local to send frequent probe checks, as to ensure you are quickly notified when a service gets down (thus to reduce unexpected downtime on your services).
Vigil needs to be hosted on your own systems, and maintained on your end. If you do not feel like managing yet another service, you may use Crisp Status instead.
Crisp Status is a direct port of Vigil to the Crisp customer support platform.
Crisp Status hosts your status page on Crisp systems, and is able to do what Vigil does (and even more!). Crisp Status is integrated to other Crisp products (eg. Crisp Chatbox & Crisp Helpdesk). It warns your users over chatbox and helpdesk if your status page reports as dead for an extended period of time.
As an example of a status page running Crisp Status, check out Enrich Status Page.
Vigil is built in Rust. To install it, either download a version from the Vigil releases page, use cargo install or pull the source code from master.
Install from Cargo:
If you prefer managing vigil via Rust's Cargo, install it directly via cargo install:
cargo install vigil-serverEnsure that your $PATH is properly configured to source the Crates binaries, and then run Vigil using the vigil command.
Install from source:
The last option is to pull the source code from Git and compile Vigil via cargo:
cargo build --releaseYou can find the built binaries in the ./target/release directory.
Install libssl-dev (ie. OpenSSL headers) and libstrophe-dev (ie. XMPP library headers; only if you need the XMPP notifier) before you compile Vigil. SSL dependencies are required for the HTTPS probes and email notifications.
Install from Docker Hub:
You might find it convenient to run Vigil via Docker. You can find the pre-built Vigil image on Docker Hub as valeriansaliou/vigil.
Pre-built Docker version may not be the latest version of Vigil available.
First, pull the valeriansaliou/vigil image:
docker pull valeriansaliou/vigil:v1.18.0Then, seed it a configuration file and run it (replace /path/to/your/vigil/config.cfg with the path to your configuration file):
docker run -p 8080:8080 -v /path/to/your/vigil/config.cfg:/etc/vigil.cfg valeriansaliou/vigil:v1.18.0In the configuration file, ensure that:
server.inetis set to0.0.0.0:8080(this lets Vigil be reached from outside the container)assets.pathis set to./res/assets/(this refers to an internal path in the container, as the assets are contained there)
Vigil will be reachable from http://localhost:8080.
Use the sample config.cfg configuration file and adjust it to your own environment.
Available configuration options are commented below, with allowed values:
[server]
log_level(type: string, allowed:debug,info,warn,error, default:error) — Verbosity of logging, set it toerrorin productioninet(type: string, allowed: IPv4 / IPv6 + port, default:[::1]:8080) — Host and TCP port the Vigil public status page should listen onworkers(type: integer, allowed: any number, default:4) — Number of workers for the Vigil public status page to run onreporter_token(type: string, allowed: secret token, default: no default) — Reporter secret token (ie. secret password)
[assets]
path(type: string, allowed: UNIX path, default:./res/assets/) — Path to Vigil assets directory
[branding]
page_title(type: string, allowed: any string, default:Status Page) — Status page titlepage_url(type: string, allowed: URL, no default) — Status page URLcompany_name(type: string, allowed: any string, no default) — Company name (ie. your company)icon_color(type: string, allowed: hexadecimal color code, no default) — Icon color (ie. your icon background color)icon_url(type: string, allowed: URL, no default) — Icon URL, the icon should be your squared logo, used as status page favicon (PNG format recommended)logo_color(type: string, allowed: hexadecimal color code, no default) — Logo color (ie. your logo primary color)logo_url(type: string, allowed: URL, no default) — Logo URL, the logo should be your full-width logo, used as status page header logo (SVG format recommended)website_url(type: string, allowed: URL, no default) — Website URL to be used in status page headersupport_url(type: string, allowed: URL, no default) — Support URL to be used in status page header (ie. where users can contact you if something is wrong)custom_html(type: string, allowed: HTML, default: empty) — Custom HTML to include in status pagehead(optional)
[metrics]
poll_interval(type: integer, allowed: seconds, default:120) — Interval for which to probe nodes inpollmodepoll_retry(type: integer, allowed: seconds, default:2) — Interval after which to try probe for a second time nodes inpollmode (only when the first check fails)poll_http_status_healthy_above(type: integer, allowed: HTTP status code, default:200) — HTTP status above whichpollchecks to HTTP replicas reports ashealthypoll_http_status_healthy_below(type: integer, allowed: HTTP status code, default:400) — HTTP status under whichpollchecks to HTTP replicas reports ashealthypoll_delay_dead(type: integer, allowed: seconds, default:30) — Delay after which a node inpollmode is to be considereddead(ie. check response delay)poll_delay_sick(type: integer, allowed: seconds, default:10) — Delay after which a node inpollmode is to be consideredsick(ie. check response delay)push_delay_dead(type: integer, allowed: seconds, default:20) — Delay after which a node inpushmode is to be considereddead(ie. time after which the node did not report)push_system_cpu_sick_above(type: float, allowed: system CPU loads, default:0.90) — System load indice for CPU above which to consider a node inpushmodesick(ie. UNIX system load)push_system_ram_sick_above(type: float, allowed: system RAM loads, default:0.90) — System load indice for RAM above which to consider a node inpushmodesick(ie. percent RAM used)script_interval(type: integer, allowed: seconds, default:300) — Interval for which to probe nodes inscriptmodelocal_delay_dead(type: integer, allowed: seconds, default:40) — Delay after which a node inlocalmode is to be considereddead(ie. time after which the node did not report)
[plugins]
[plugins.rabbitmq]
api_url(type: string, allowed: URL, no default) — RabbitMQ API URL (ie.http://127.0.0.1:15672)auth_username(type: string, allowed: username, no default) — RabbitMQ API authentication usernameauth_password(type: string, allowed: password, no default) — RabbitMQ API authentication passwordvirtualhost(type: string, allowed: virtual host, no default) — RabbitMQ virtual host hosting the queues to be monitoredqueue_ready_healthy_below(type: integer, allowed: any number, no default) — Maximum number of payloads in RabbitMQ queue with statusreadyto consider nodehealthy.queue_nack_healthy_below(type: integer, allowed: any number, no default) — Maximum number of payloads in RabbitMQ queue with statusnackto consider nodehealthy.queue_ready_dead_above(type: integer, allowed: any number, no default) — Threshold on the number of payloads in RabbitMQ queue with statusreadyabove which node should be considereddead(stalled queue).queue_nack_dead_above(type: integer, allowed: any number, no default) — Threshold on the number of payloads in RabbitMQ queue with statusnackabove which node should be considereddead(stalled queue).queue_loaded_retry_delay(type: integer, allowed: milliseconds, no default) — Re-check queue if it reports as loaded after delay; this avoids false-positives if your systems usually take a bit of time to process pending queue payloads (if any)
[notify]
startup_notification(type: boolean, allowed:true,false, default:true) — Whether to send startup notification or not (stating that systems arehealthy)reminder_interval(type: integer, allowed: seconds, no default) — Interval at which downtime reminder notifications should be sent (if any)
[notify.email]
to(type: string, allowed: email address, no default) — Email address to which to send emailsfrom(type: string, allowed: email address, no default) — Email address from which to send emailssmtp_host(type: string, allowed: hostname, IPv4, IPv6, default:localhost) — SMTP host to connect tosmtp_port(type: integer, allowed: TCP port, default:587) — SMTP TCP port to connect tosmtp_username(type: string, allowed: any string, no default) — SMTP username to use for authentication (if any)smtp_password(type: string, allowed: any string, no default) — SMTP password to use for authentication (if any)smtp_encrypt(type: boolean, allowed:true,false, default:true) — Whether to encrypt SMTP connection withSTARTTLSor notreminders_only(type: boolean, allowed:true,false, default:false) — Whether to send emails only for downtime reminders or everytime
[notify.twilio]
to(type: array[string], allowed: phone numbers, no default) — List of phone numbers to which to send text messagesservice_sid(type: string, allowed: any string, no default) — Twilio service identifier (ie.Service Sid)account_sid(type: string, allowed: any string, no default) — Twilio account identifier (ie.Account Sid)auth_token(type: string, allowed: any string, no default) — Twilio authentication token (ie.Auth Token)reminders_only(type: boolean, allowed:true,false, default:false) — Whether to send text messages only for downtime reminders or everytime
[notify.slack]
hook_url(type: string, allowed: URL, no default) — Slack hook URL (ie.https://hooks.slack.com/[..])mention_channel(type: boolean, allowed:true,false, default:false) — Whether to mention channel when sending Slack messages (using @channel, which is handy to receive a high-priority notification)reminders_only(type: boolean, allowed:true,false, default:false) — Whether to send Slack messages only for downtime reminders or everytime
[notify.telegram]
bot_token(type: string, allowed: any strings, no default) — Telegram bot tokenchat_id(type: string, allowed: any strings, no default) — Chat identifier where you want Vigil to send messages. Can be group chat identifier (eg."@foo") or user chat identifier (eg."123456789")
[notify.pushover]
app_token(type: string, allowed: any string, no default) — Pushover application token (you need to create a dedicated Pushover application to get one)user_keys(type: array[string], allowed: any strings, no default) — List of Pushover user keys (ie. the keys of your Pushover target users for notifications)reminders_only(type: boolean, allowed:true,false, default:false) — Whether to send Pushover notifications only for downtime reminders or everytime
[notify.xmpp]
Notice: the XMPP notifier requires libstrophe (libstrophe-dev package on Debian) to be available when compiling Vigil, with the feature notifier-xmpp enabled upon Cargo build.
to(type: string, allowed: Jabber ID, no default) — Jabber ID (JID) to which to send messagesfrom(type: string, allowed: Jabber ID, no default) — Jabber ID (JID) from which to send messagesxmpp_password(type: string, allowed: any string, no default) — XMPP account password to use for authenticationreminders_only(type: boolean, allowed:true,false, default:false) — Whether to send messages only for downtime reminders or everytime
[notify.webhook]
hook_url(type: string, allowed: URL, no default) — Web Hook URL (eg.https://domain.com/webhooks/[..])
[probe]
[[probe.service]]
id(type: string, allowed: any unique lowercase string, no default) — Unique identifier of the probed service (not visible on the status page)label(type: string, allowed: any string, no default) — Name of the probed service (visible on the status page)
[[probe.service.node]]
id(type: string, allowed: any unique lowercase string, no default) — Unique identifier of the probed service node (not visible on the status page)label(type: string, allowed: any string, no default) — Name of the probed service node (visible on the status page)mode(type: string, allowed:poll,push,script,local, no default) — Probe mode for this node (ie.pollis direct HTTP, TCP or ICMP poll to the URLs set inreplicas, whilepushis for Vigil Reporter nodes,scriptis used to execute a shell script andlocalis for Vigil Local nodes)replicas(type: array[string], allowed: TCP, ICMP or HTTP URLs, default: empty) — Node replica URLs to be probed (only used ifmodeispoll)scripts(type: array[string], allowed: shell scripts as source code, default: empty) — Shell scripts to be executed on the system as a Vigil sub-process; they are handy to build custom probes (only used ifmodeisscript)http_body_healthy_match(type: string, allowed: regular expressions, no default) — HTTP response body for which to report node replica ashealthy(if the body does not match, the replica will be reported asdead, even if the status code check passes; the check uses aGETrather than the usualHEADif this option is set)rabbitmq_queue(type: string, allowed: RabbitMQ queue names, no default) — RabbitMQ queue associated to node, which to check against for pending payloads via RabbitMQ API (this helps monitor unacked payloads accumulating in the queue)
Vigil can be run as such:
./vigil -c /path/to/config.cfg
Consider the following recommendations when using Vigil:
- Vigil should be hosted on a safe, separate server. This server should run on a different physical machine and network than your monitored infrastructure servers.
- Make sure to whitelist the Vigil server public IP (both IPv4 and IPv6) on your monitored HTTP services; this applies if you use a bot protection service that challenges bot IPs, eg. Distil Networks or Cloudflare. Vigil will see the HTTP service as down if a bot challenge is raised.
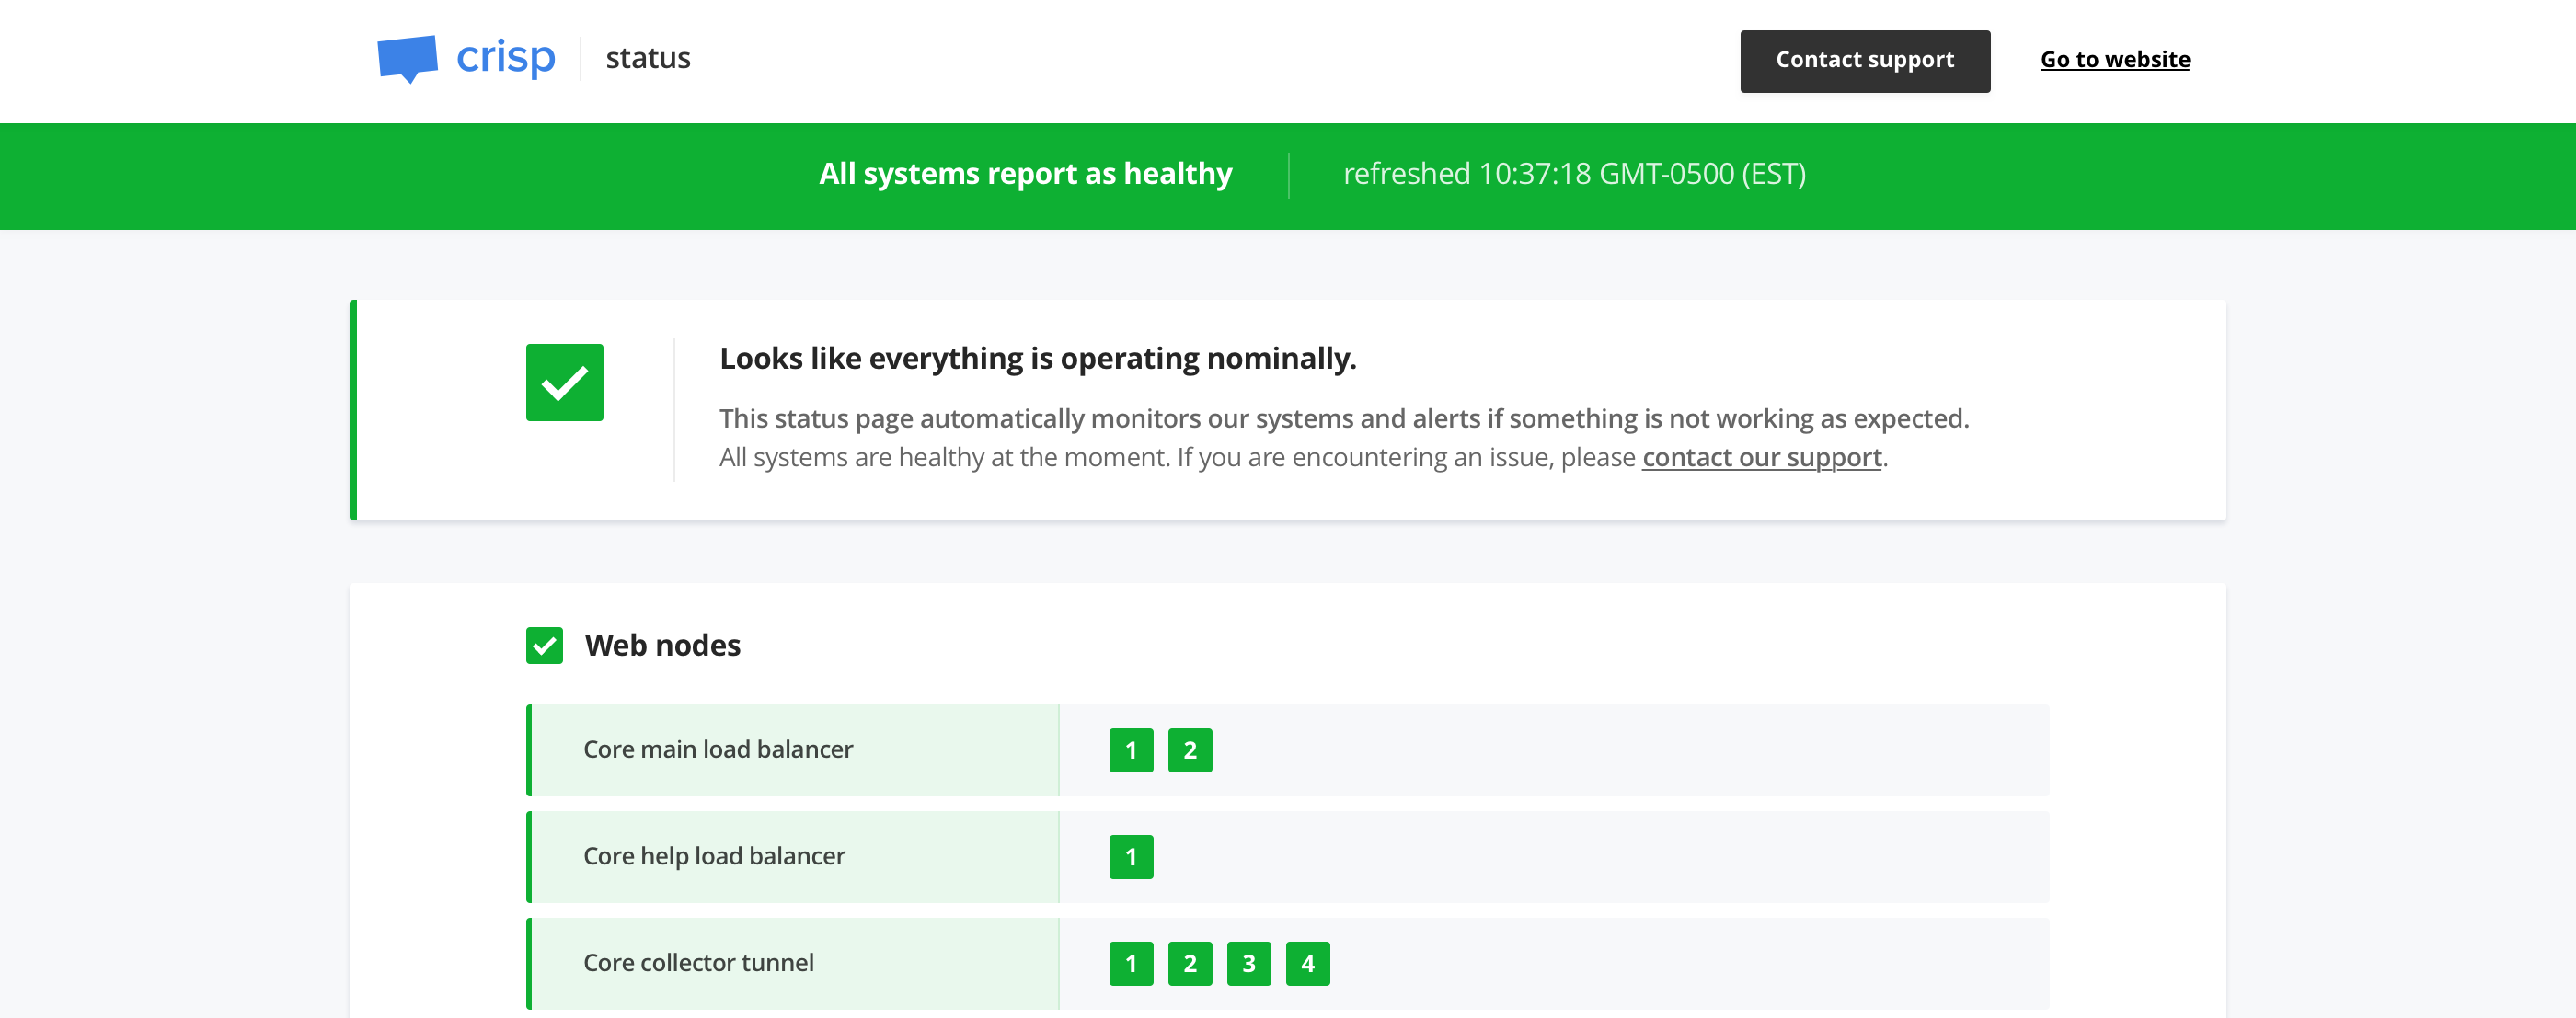
Vigil has 3 status variants, either healthy (no issue ongoing), sick (services under high load) or dead (outage):
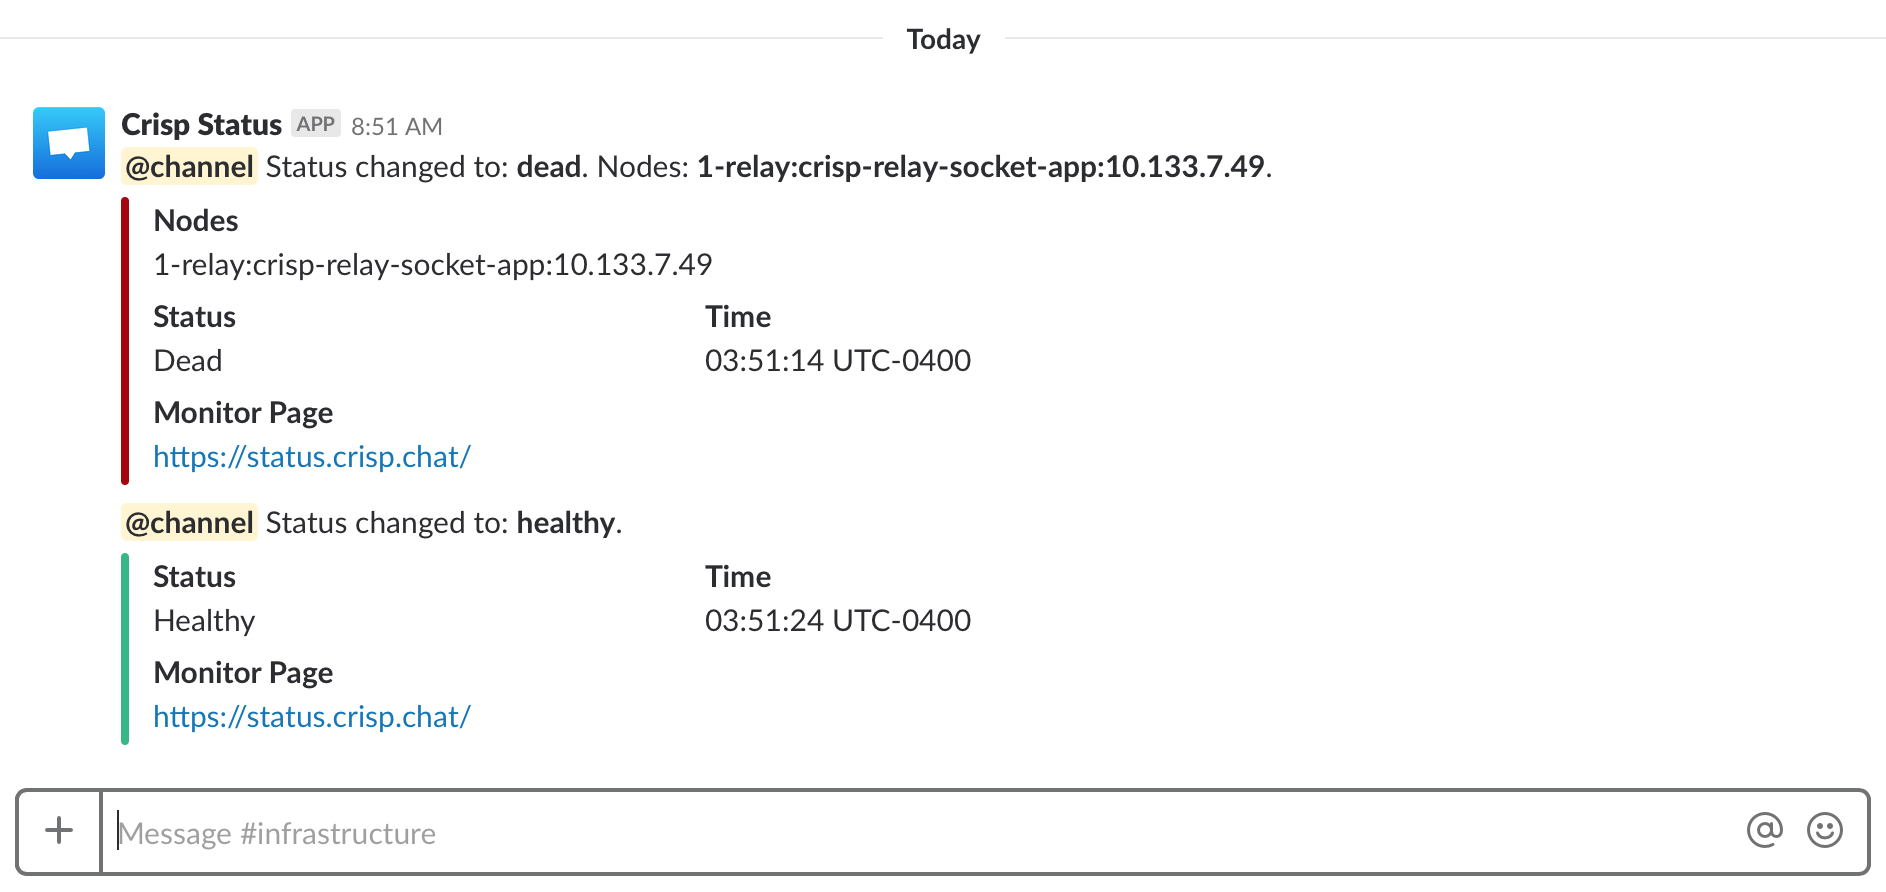
When a monitored backend or app goes down in your infrastructure, Vigil can let you know by Slack, Twilio SMS, Email and XMPP:
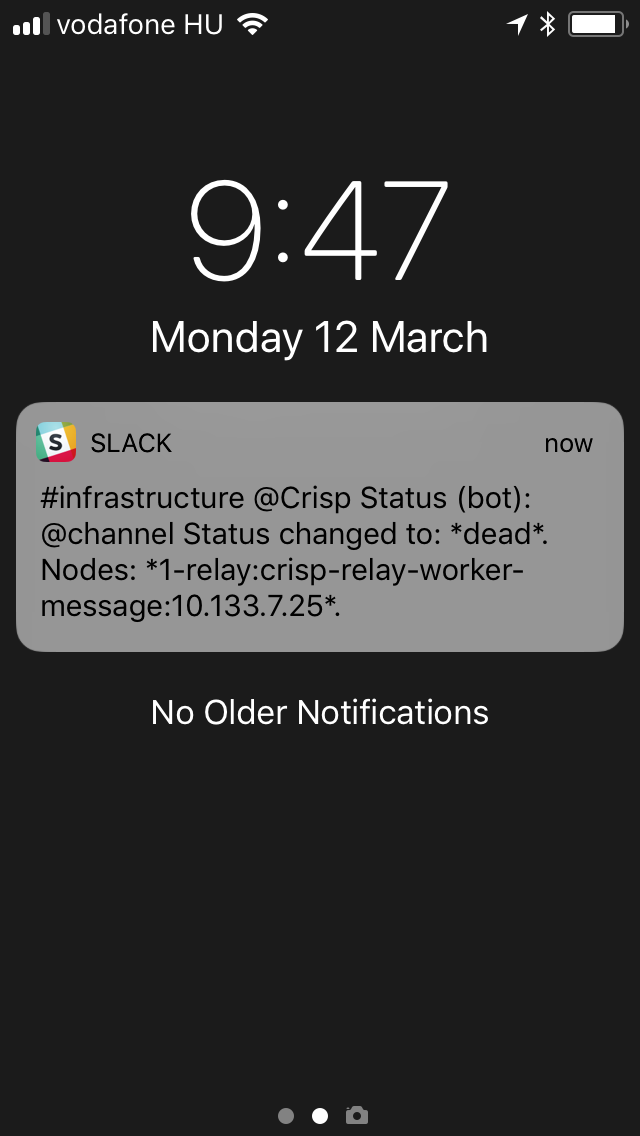
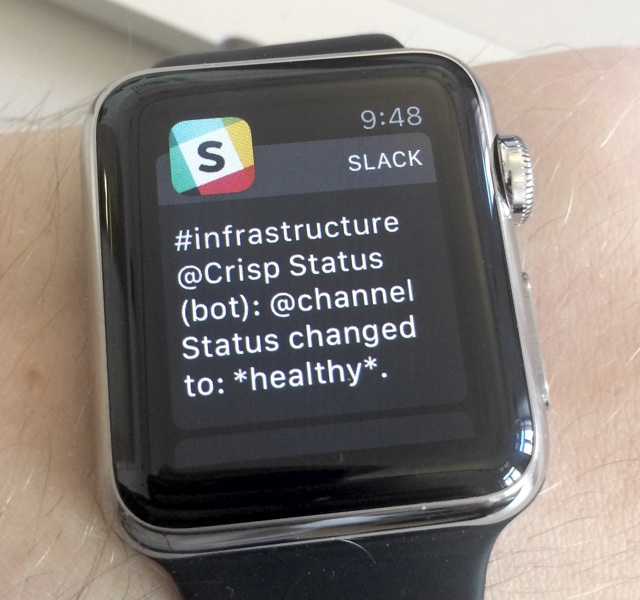
You can also get nice realtime down and up alerts on your eg. iPhone and Apple Watch:
If you are using the Webhook notifier in Vigil, you will receive a JSON-formatted payload with alert details upon any status change; plus reminders if notify.reminder_interval is configured.
Here is an example of a Webhook payload:
{
  "type": "changed",
  "status": "dead",
  "time": "08:58:28 UTC+0200",

  "replicas": [
    "web:core:tcp://edge-3.pool.net.crisp.chat:80"
  ],

  "page": {
    "title": "Crisp Status",
    "url": "https://status.crisp.chat/"
  }
}
Webhook notifications can be tested with eg. Webhook.site, before you integrate them to your custom endpoint.
You can use those Webhook payloads to create custom notifiers to anywhere. For instance, if you are using Microsoft Teams but not Slack, you may write a tiny PHP script that receives Webhooks from Vigil and forwards a notification to Microsoft Teams. This can be handy; while Vigil only implements convenience notifiers for some selected channels, the Webhook notifier allows you to extend beyond that.
Vigil lets you create custom probes written as shell scripts, passed in the Vigil configuration as a list of scripts to be executed for a given node.
Those scripts can be used by advanced Vigil users when their monitoring use case requires scripting, ie. when push and poll probes are not enough.
The replica health should be returned by the script shell as return codes, where:
rc=0:healthyrc=1:sickrc=2and higher:dead
As scripts are usually multi-line, script contents can be passed as a literal string, enclosed between '''.
As an example, the following script configuration always return as sick:
scripts = [
  '''
  # Do some work...
  exit 1
  '''
]
Note that scripts are executed in a system shell ran by a Vigil-owned sub-process. Make sure that Vigil runs on an UNIX user with limited privileges. Running Vigil as root would let any configured script perform root-level actions on the machine, which is not recommended.
Vigil Reporter is used to actively submit health information to Vigil from your apps. Apps are best monitored via application probes, which are able to report detailed system information such as CPU and RAM load. This lets Vigil show if an application host system is under high load.
- NodeJS: node-vigil-reporter
- Python: py-vigil-reporter
- Golang: go-vigil-reporter
- Rust: rs-vigil-reporter
👉 Cannot find the library for your programming language? Build your own and be referenced here! (contact me)
In case you need to manually report node metrics to the Vigil endpoint, use the following HTTP configuration (adjust it to yours):
Endpoint URL:
HTTP POST https://status.example.com/reporter/<probe_id>/<node_id>/
Where:
node_id: The parent node of the reporting replicaprobe_id: The parent probe of the node
Request headers:
- Add an
Authorizationheader with aBasicauthentication where the password is your configuredreporter_token. - Set the
Content-Typetoapplication/json; charset=utf-8, and ensure you submit the request data as UTF-8.
Request data:
Adjust the request data to your replica context and send it as HTTP POST:
{
  "replica": "<replica_id>",
  "interval": 30,

  "load": {
    "cpu": 0.30,
    "ram": 0.80
  }
}
Where:
replica: The replica unique identifier (eg. the server LAN IP)interval: The push interval (in seconds)load.cpu: The general CPU load, from0.00to1.00(can be more than1.00if the CPU is overloaded)load.ram: The general RAM load, from0.00to1.00
Vigil Local is an (optional) slave daemon that you can use to report internal service health to your Vigil-powered status page master server. It is designed to be used behind a firewall, and to monitor hosts bound to a local loop or LAN network, that are not available to your main Vigil status page.
Vigil Local monitors local poll and script replicas, and reports their status to Vigil on a periodic basis.
You can read more on Vigil Local on its repository, and follow the setup instructions.
On Linux systems, non-priviledge users cannot create raw sockets, which Vigil ICMP probing system requires. It means that, by default, all ICMP probe attempts will fail silently, as if the host being probed was always down.
This can easily be fixed by allowing Vigil to create raw sockets:
setcap 'cap_net_raw+ep' /bin/vigilNote that HTTP and TCP probes do not require those raw socket capabilities.
If you find a vulnerability in Vigil, you are more than welcome to report it directly to @valeriansaliou by sending an encrypted email to valerian@valeriansaliou.name. Do not report vulnerabilities in public GitHub issues, as they may be exploited by malicious people to target production servers running an unpatched Vigil server.
🎁 Based on the severity of the vulnerability, I may offer a $100 (US) bounty to whomever reported it.

