Exporter for metrics from devices running JunOS (via SSH) https://prometheus.io/
This project is an alternative approach for collecting metrics from Juniper devices. The set of metrics is minimal to increase performance. We (a few friends from the Freifunk community and myself) used the generic snmp_exporter before. Since snmp_exporter is highly generic it comes with a lot of complexity at the cost of performance. We wanted to have an KIS and vendor specific exporter instead. This approach should allow us to scrape our metrics in a very time efficient way. For this reason this project was started.
In version 0.7 a typo in the prefix of all BGP related metrics was fixed. Please update your queries accordingly.
In version 0.5 SNMP was replaced by SSH. This is was a breaking change (metric names were kept). All SNMP related parameters were removed at this point. Please have a look on the new SSH related parameters and update your service units accordingly.
The following metrics are supported by now:
- Interfaces (bytes transmitted/received, errors, drops, speed)
- Routes (per table, by protocol)
- Alarms (count)
- BGP (message count, prefix counts per peer, session state)
- OSPFv2, OSPFv3 (number of neighbors)
- Interface diagnostics (optical signals)
- ISIS (number of adjacencies, total number of routers)
- NAT (all available statistics from services nat)
- Environment (temperatures)
- Routing engine statistics
- Storage (total, available and used blocks, used percentage)
- Firewall filters (counters and policers) - needs explicit rights beyond read-only
- Statistics about l2circuits (tunnel state, number of tunnels)
- Interface queue statistics
0:EI -- encapsulation invalid
1:MM -- mtu mismatch
2:EM -- encapsulation mismatch
3:CM -- control-word mismatch
4:VM -- vlan id mismatch
5:OL -- no outgoing label
6:NC -- intf encaps not CCC/TCC
7:BK -- Backup Connection
8:CB -- rcvd cell-bundle size bad
9:LD -- local site signaled down
10:RD -- remote site signaled down
11:XX -- unknown
12:NP -- interface h/w not present
13:Dn -- down
14:VC-Dn -- Virtual circuit Down
15:Up -- operational
16:CF -- Call admission control failure
17:IB -- TDM incompatible bitrate
18:TM -- TDM misconfiguration
19:ST -- Standby Connection
20:SP -- Static Pseudowire
21:RS -- remote site standby
22:HS -- Hot-standby Connection
- LDP (number of neighbors, sessions and session states) States map to human readable names like this:
0: "Nonexistant"
1: "Operational"
go get -u github.com/czerwonk/junos_exporterIn this example we want to scrape 3 hosts:
- Host 1 (DNS: host1.example.com, Port: 22)
- Host 2 (DNS: host2.example.com, Port: 2233)
- Host 3 (IP: 172.16.0.1, Port: 22)
./junos_exporter -ssh.targets="host1.example.com,host2.example.com:2233,172.16.0.1" -ssh.keyfile=junos_exporterdocker run -d --restart unless-stopped -p 9326:9326 -e SSH_KEYFILE=/ssh-keyfile -v /opt/junos_exporter_keyfile:/ssh-keyfile:ro -v /opt/junos_exporter_config.yml:/config.yml:ro czerwonk/junos_exporterjunos_exporter supports SSH authentication via key or password based authentication.
-ssh.keyfile=<file> enables key based authentication. -ssh.password=<password-string> enables password based authenticaton, this can also be enabled via the config file in the form of a password: <password-string> entry.
Authentication order is ssh key, if none is found the cli flag is checked, the config file is checked last. If no valid auth method is specified junos_exporter exits with an error.
By default, all configured targets will be scrapped when /metrics is hit. As an alternative, it is possible to scrape a specific target by passing the target's hostname/IP address to the target parameter - e.g. http://localhost:9326/metrics?target=1.2.3.4. The specific target must be present in the configuration file or passed in with the ssh.targets flag, you can also specify the -config.ignore-targets flag if you don't want to specify targets in the config or commandline, if none of this matches the request will be denied. This can be used with the below example Prometheus config:
scrape_configs:
  - job_name: 'junos'
    static_configs:
      - targets:
        - 192.168.1.2  # Target device.
    relabel_configs:
      - source_labels: [__address__]
        target_label: __param_target
      - source_labels: [__param_target]
        target_label: instance
      - target_label: __address__
replacement: 127.0.0.1:9326 # The junos_exporter's real hostname:port.The exporter can be configured with a YAML based config file:
devices:
  - host: router1
    key_file: /path/to/key
  - host: router2
    username: exporter
    password: secret

features:
  bgp: true
  ospf: false
  isis: false
  nat: false
  ldp: false
  l2circuit: false
  environment: true
  routes: true
  routing_engine: true
  interface_diagnostic: true
fpc: trueVersion 0.9.5 introduced dynamic labels retrieved from the interface descriptions. Flags are supported a well. The first part (label name) has to comply to the following rules:
- must not begin with a figure
- must only contain this charakters: A-Z,a-z,0-9,_
- is treated lower case
- must no conflict with label names used in junos_exporter
Values can contain arbitrary characters.
The complete feature can be disabled by setting -dynamic-interface-labels to false.
Tags:
Description: XYZ [prod]
Label name: prod
Label value: 1
Label value pairs:
Description: XYZ [peer=202739]
Label name: peer
Label value: 202739
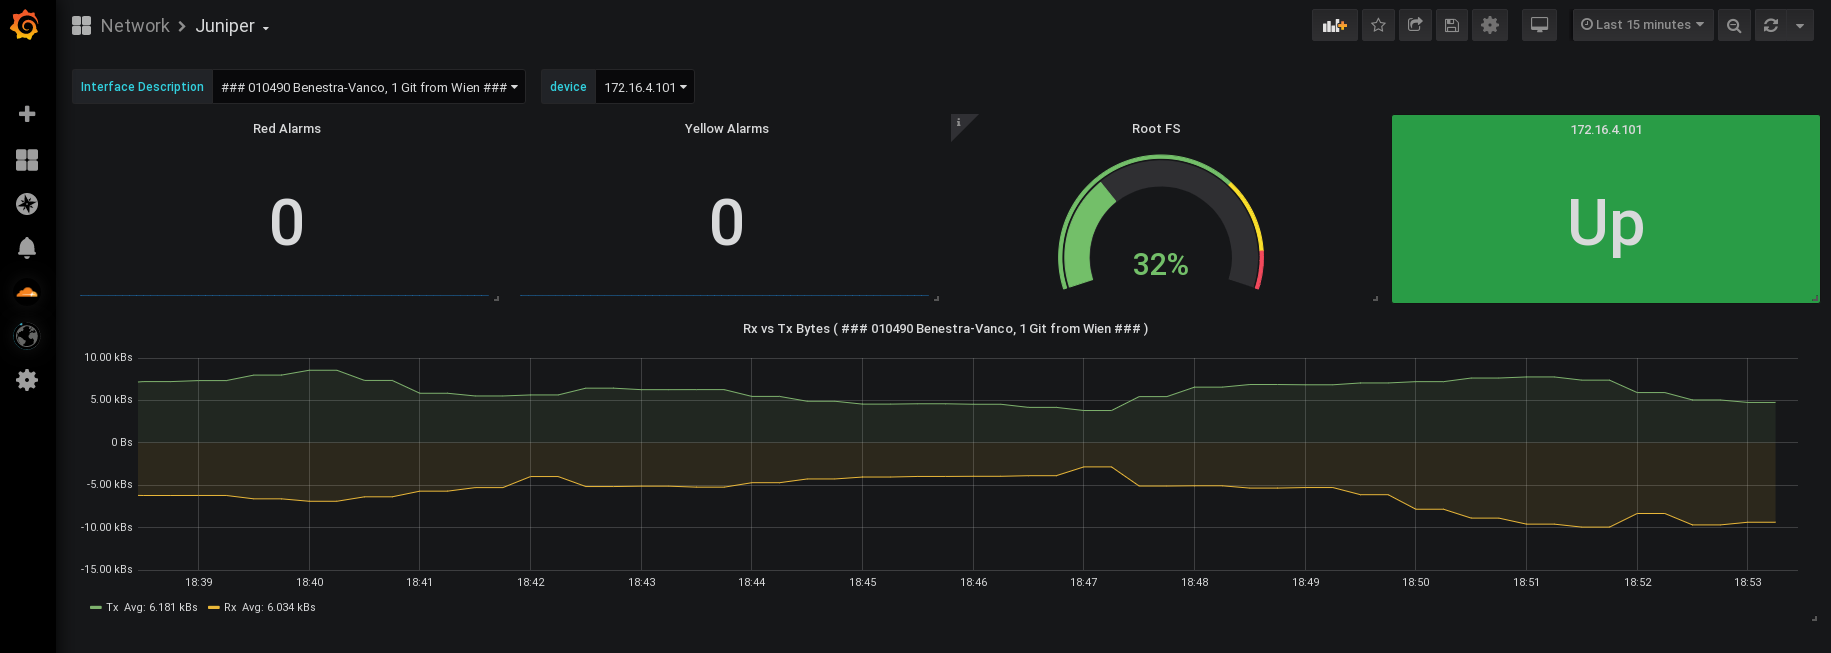
There is an example Grafana Dashboard included (grafana_dashboard.json), which has some basic variables to choose your device(s) / interface(s)
This software uses components of the following projects
- Prometheus Go client library (https://github.com/prometheus/client_golang)
for a full list of contributers have a look at https://github.com/czerwonk/junos_exporter/graphs/contributors
(c) Daniel Czerwonk, 2017. Licensed under MIT license.
see https://www.juniper.net/us/en/products-services/nos/junos/

