The goal of this project is to provide an SQL-queryable data warehouse for analysts to analyze data collected from the Mars Curiosity Rover. To this end, the project combines multiple data sets on environmental observations and rover telemetry to organise it into an Amazon Redshift data warehouse via an Apache Airflow managed data pipeline. As part of this work, the data will be uploaded to S3 after which the data will be read from S3, then loaded into staging tables in Redshift before the creation of fact and dimension tables. In the final step, data quality checks are performed on the output tables to verify the health of the pipeline output. Separately, this repository employs Github Actions to test the DAG files, plugins, operators and requirements and automatically sync them with AWS S3 for use in an Amazon Managed Workflow for Apache Airflow (MWAA).
The Mars Curiosity Rover was launched on November 26, 2011 and continues to conduct experiments and collect data on the Martian surface. August 6, 2021 marked the rovers nineth year of operations covering over 3,000 days.
Source: NASA. Mars Curiosity Rover - Mission Timeline Summary
This data product may be applied to a range of use cases including:
- Deepening our understanding of Mars' seasonal conditions
- Providing an accessible resource for the creation of a Rover-centric app delivering visualizations of monthly weather and positional data
- A post-mortem analysis of whether weather-related risks were considered in the planning of rover manouevers
Some examples of the kind of queries that may be performed using this data product include:
- Determining the daily extremes of temperature, pressure, and humidity observed by the rover
- Determining the average horizontal and vertical wind speeds by hour
- Calculating the average horizontal distance covered per day of the mission
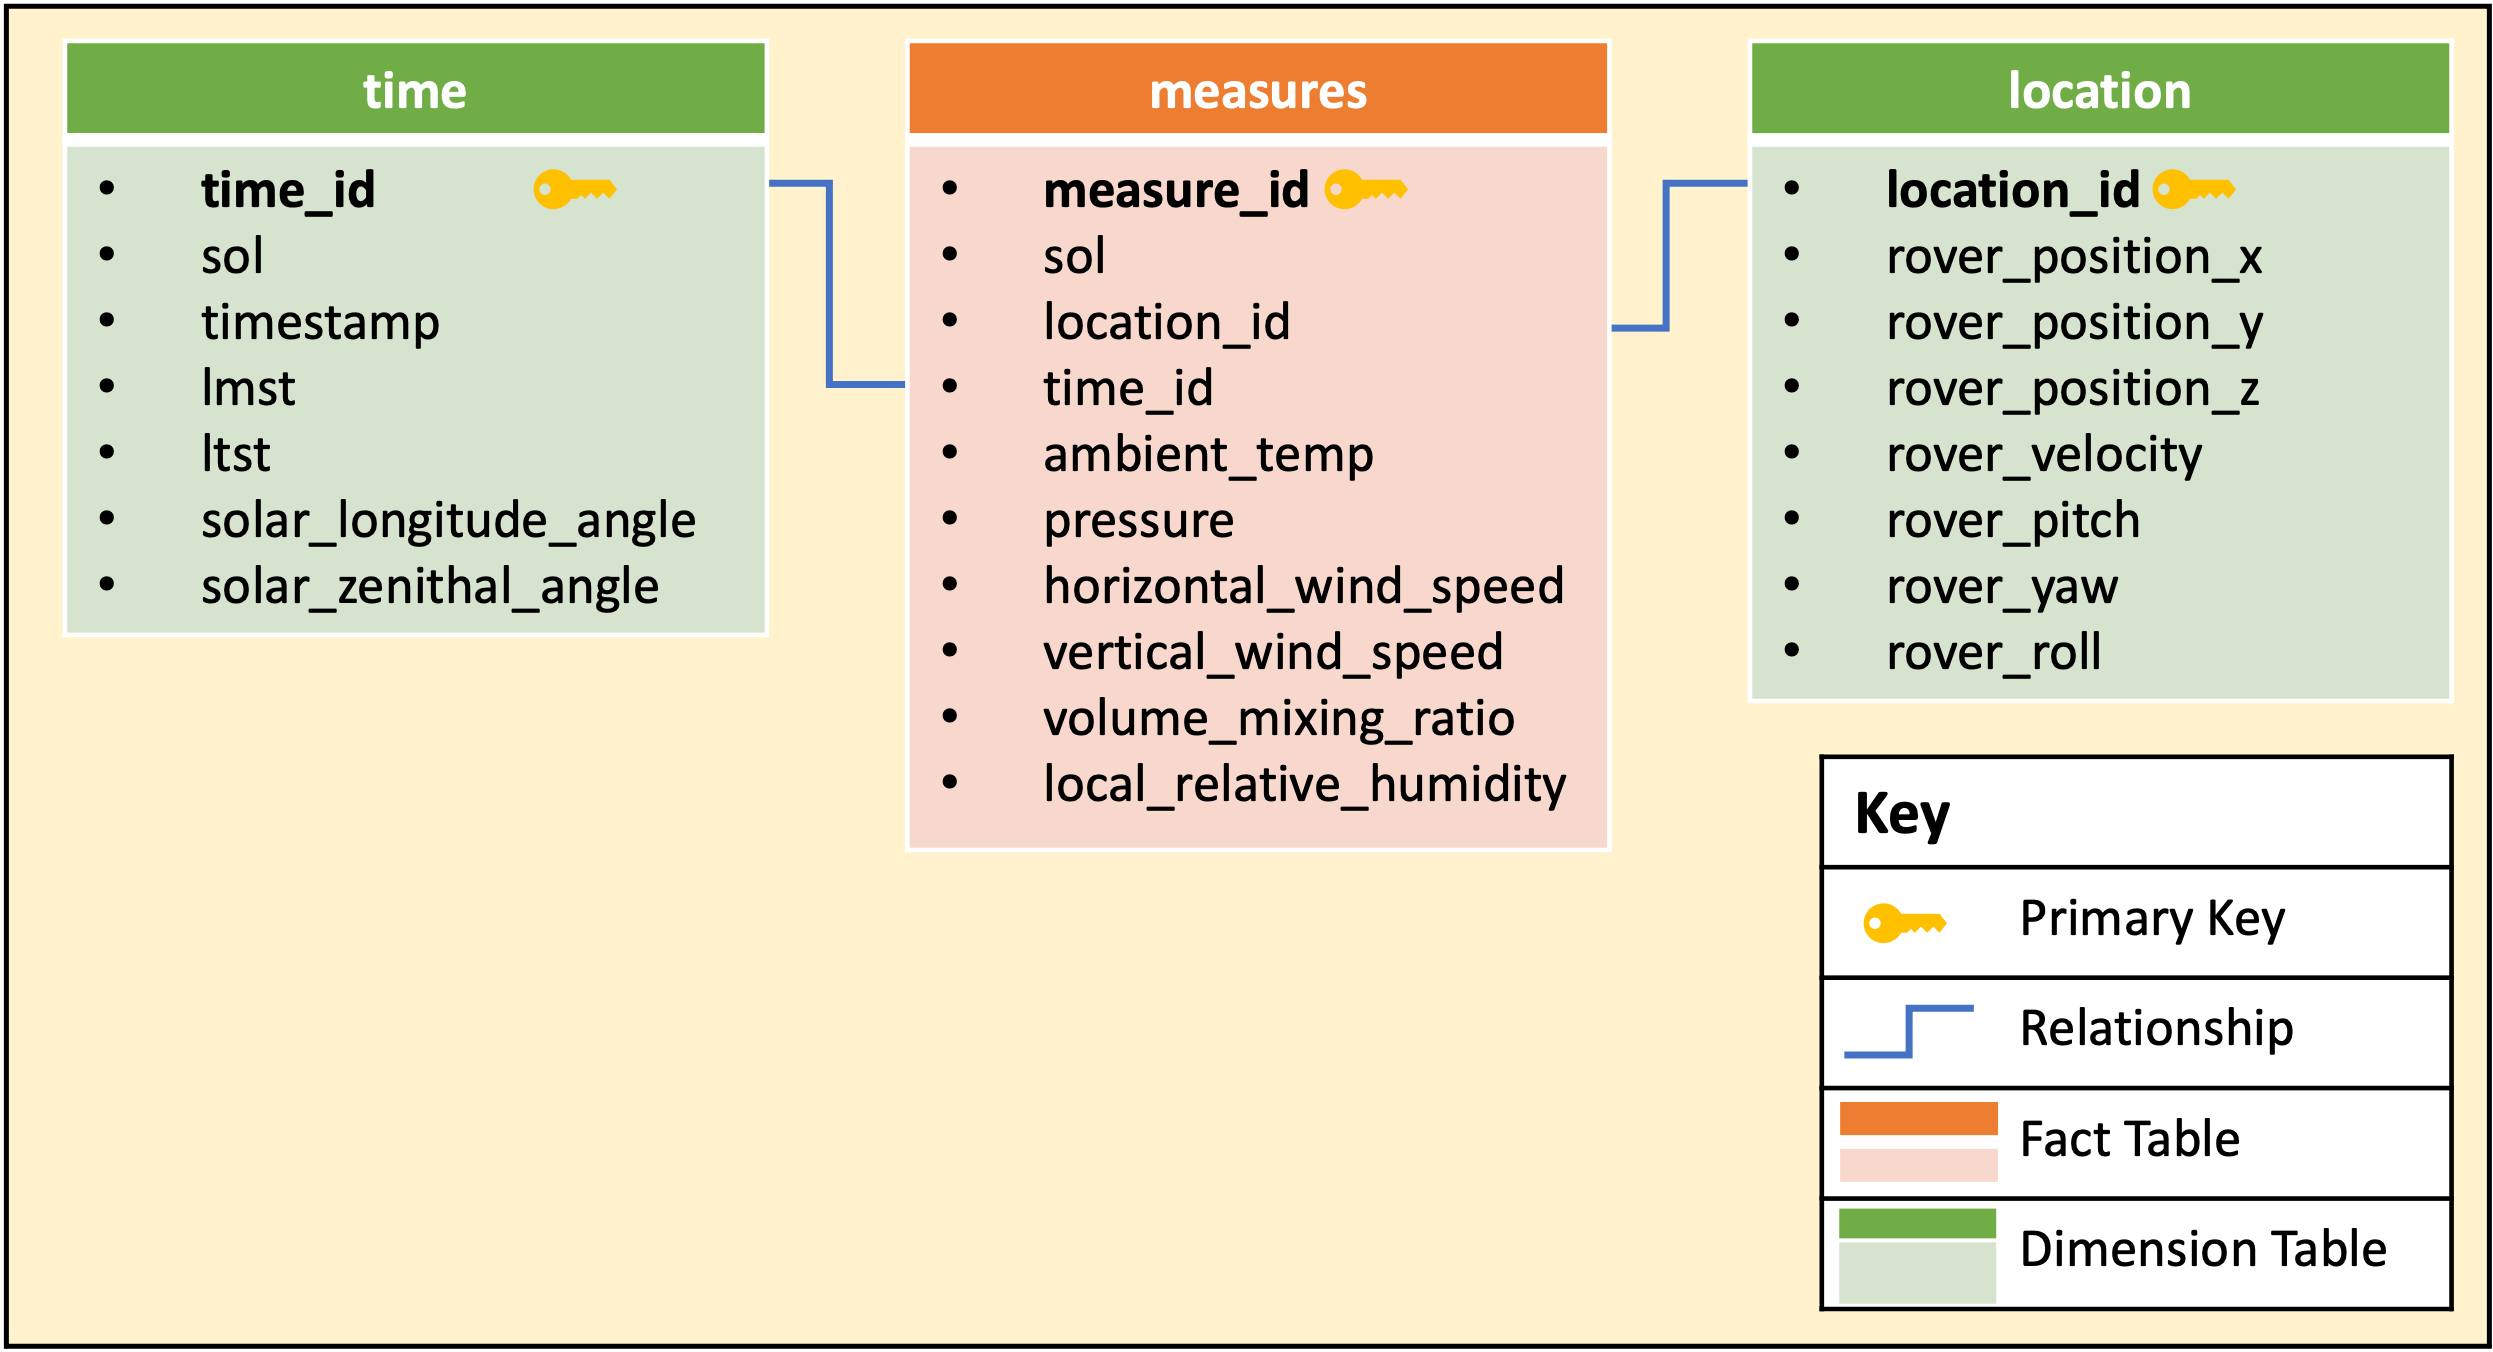
This data product is a redshift database with staging tables (stg_rems_env and stg_rems_adr) loaded from the s3 bucket, as well as a fact table (measures) and dimension tables (location and time). The figure below depicts the relationships in the data model.
| Table Column | Data Type | Description |
|---|---|---|
| measure_id | VARCHAR | generated primary key |
| sol | INT | day of the mission |
| location_id | VARCHAR | generated foreign key |
| time_id | VARCHAR | generated foreign key |
| ambient_temp | FLOAT | estimated ambient air temperature (Kelvin) |
| pressure | FLOAT | Atmospheric pressure (Pascal) |
| horizontal_wind_speed | FLOAT | horizontal wind speed (meters/second) |
| vertical_wind_speed | FLOAT | vertical wind speed (meters/second) |
| volume_mixing_ratio | FLOAT | volume mixing ratio of water vapour (ppm) |
| local_relative_humidity | FLOAT | local relative humidity at humidity sensor (%) |
| Table Column | Data Type | Description |
|---|---|---|
| time_id | VARCHAR | generated primary key |
| sol | INT | day of the mission |
| timestamp | BIGINT | number of seconds since noon 1-Jan-2000 (seconds) |
| lmst | VARCHAR | Local Mean Solar Time. It is in the format SSSSSMHH:MM:SS.sss where: SS - Sol number (00000-99999) M - sol/time separator HH - hour (0-23) MM - minute (0-59) SS - second (0-59) sss - fractions of second (000-999) |
| ltst | VARCHAR | Local True Solar Time with respect to the rover position. It is in the format SSSSS HH:MM:SS.sss where: SS - Sol number (00000-99999) HH - hour (0-23) MM - minute (0-59) SS - second (0-59) |
| solar_longitude_angle | FLOAT | Solar azimuth angle relative to REMS rover frame (degrees) |
| solar_zenithal_angle | FLOAT | Solar elevation angle relative to REMS rover frame (degrees) |
| Table Column | Data Type | Description |
|---|---|---|
| location_id | VARCHAR | generated primary key |
| rover_position_x | FLOAT | x-component of the rover's position relative to landing site where +X is along the local north direction (meters) |
| rover_position_y | FLOAT | y-component of the rover's position relative to landing site where +Y is along the local east direction (meters) |
| rover_position_z | FLOAT | z-component of the rover's position relative to landing site where +Z is an increase in elevation (meters) |
| rover_velocity | FLOAT | rover velocity in meters/hour |
| rover_pitch | FLOAT | counterclockwise rotation angle about the Y-axis |
| rover_yaw | FLOAT | counterclockwise rotation angle about the Z-axis |
| rover_roll | FLOAT | counterclockwise rotation angle about the X-axis |
- Apache Airflow: The operation of this data pipeline is managed using Apache Airflow to allow the owner to more easily run, diagnose and troubleshoot performance issues.
- AWS Redshift: Amazon Web Services(AWS) Redshift is the datawarehouse solution of choice given its co-location with the cloud data storage service Amazon S3. The database provides the platform for query execution.
- AWS S3: After downloading the source data files, they are uploaded to an S3 bucket for downstream use in the data pipeline. A separate bucket is used to sync the DAG files, plugins and operators for using Amazon Managed Workflow for Apache Airflow (MWAA) under a fully cloud-deployed model
- Github Actions: Github Actions are used in this repository to test the DAG files, plugins, operators and requirements for issues and for their automated syncing to AWS S3 for MWAA. This allows for a faster iteration process offline before an MWAA is initiated. Ideas on how to implement this are based on Gary Stafford's article entitled "DevOps for DataOps: Building a CI/CD Pipeline for Apache Airflow DAGs."
There are 2 main datasets used from NASA's Planertary Data System on the Mars Curiosity Rover Environment Monitoring Station (REMS) found here:
- REMS Environment data set: This data set contains enviromental characteristics of the Mars atmosphere measured each hour.
- REMS Ancillary data set: This data set records changes in the rovers position relative to its landing site.
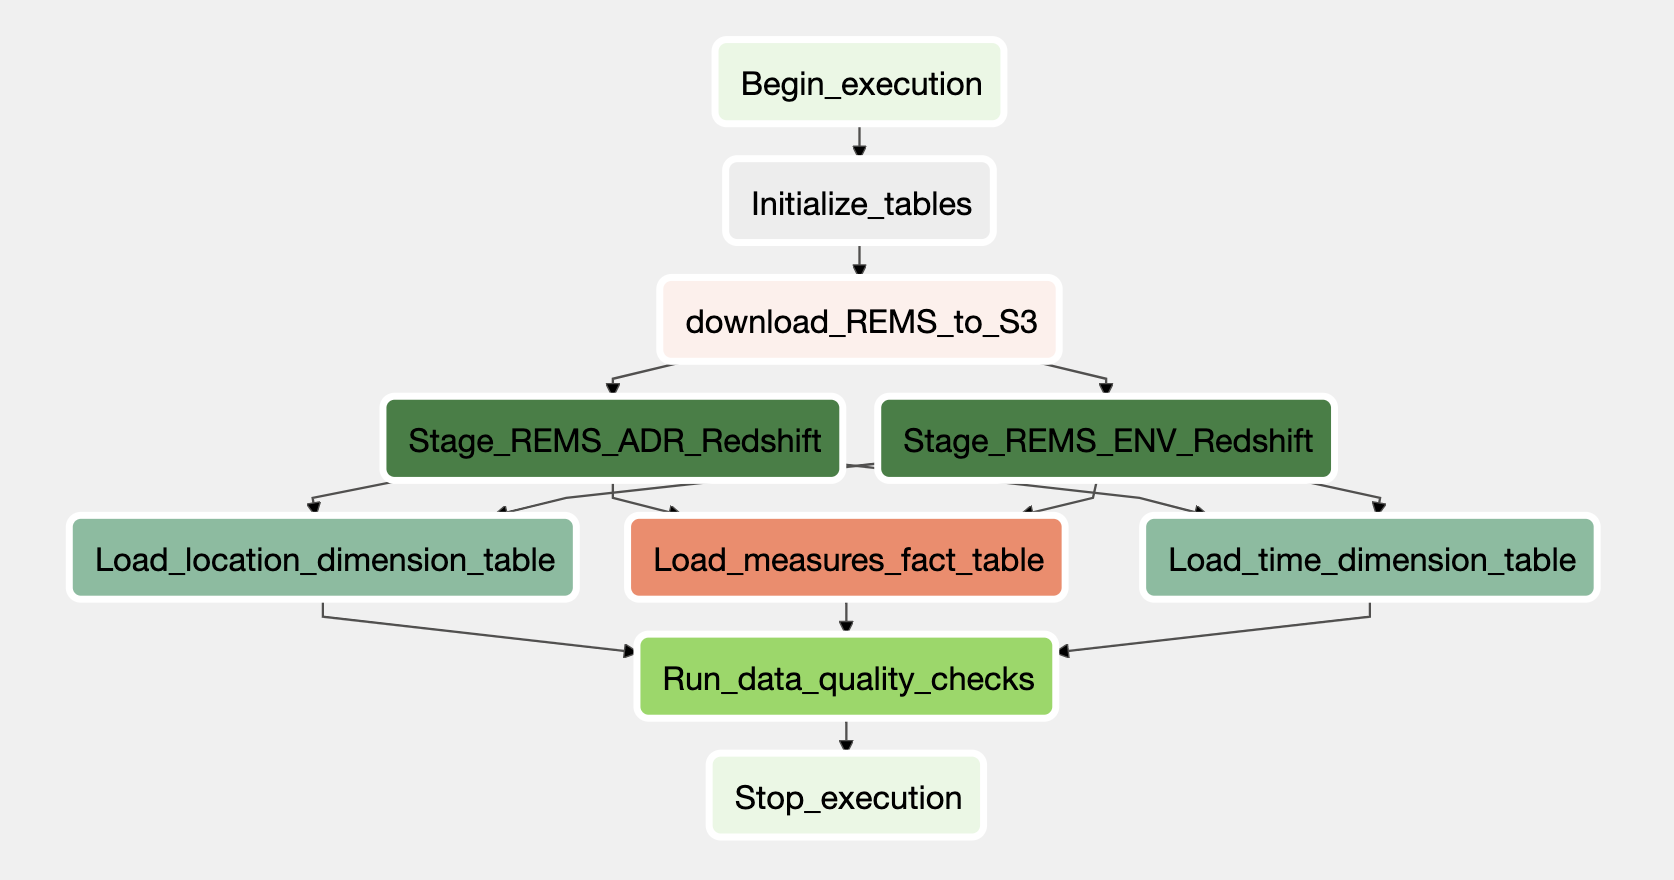
An overview of the ETL pipeline is provided in the Directed Acyclic Graph (DAG) below:
- Initialize_tables: This step is a Postgres Operator which creates the staging, fact and dimension tables in AWS Redshift.
- download_REMS_to_S3: This step builds on Mark Baum's REMS environment local data downloader to collect environemtal and positional data of the Curiosity mars rover and upload it to an S3 bucket as csv files in their respective sub-directories.
- Stage_REMS_ADR_Redshift: Using the raw data uploaded to S3, this step stages the rover positional data in Redshift using the custom StageToRedshiftOperator.
- Stage_REMS_ENV_Redshift: Likewise, this step involves the staging of environmental data in Redshift using the custom StageToRedshiftOperator.
- Load_measures_fact_table: This step creates the
measuresfact table using the staging tables. - Load_location_dimension_table: This step creates the
locationdimension table from the staging tables. - Load_time_dimension_table: This step creates the
time dimensiontable from the staging tables. - Run_data_quality_checks: Lastly, this step checks the fact and dimension tables created to ensure the desired outputs were generated.
Assuming you have docker and AWS CLI already installed, the following steps may be used to test this data pipeline using a local docker-based instance of Apache Airflow 2.0:
Launch the redshift cluster using the shell command:
aws redshift create-cluster --node-type ra3.4xlarge --number-of-nodes 2 --master-username <CLUSTER USERNAME> --master-user-password <CLUSTER PASSWORD> --cluster-identifier <CLUSTER NAME> --iam-roles <CLUSTER ARN> --profile <AWS PROFILE>
Note: This cluster may be closed as required using the below command
aws redshift delete-cluster --cluster-identifier <CLUSTER NAME> --skip-final-cluster-snapshot --profile <AWS PROFILE>
-
Build the docker image using the shell command:
./mwaa-local-env build-image -
Launch the docker instance using the shell command:
./mwaa-local-env start -
Launch the Airflow UI at http://localhost:8080/home
-
Enter default credentials username:
adminand password:test -
Create connections under the UI Admin menu and selecting
ConnectionsAWS Credentials Connection- Enter the following for your AWS credentials connection
- Conn Id:
s3_connection - Conn Type:
Amazon Web Services - Login:
Your AWS Access key ID - Password:
Your AWS Secret Access Key
- Conn Id:
- Save connection
Redshift Cluster Connection
- Enter the following to setup the Redshift connection
- Conn Id:
redshift - Conn Type:
Postgres - Host:
Your Redshift ARN - Schema:
dev - Login:
Your Redshift username - Password:
Your Redshift password - Port:
5439
- Conn Id:
- Enter the following for your AWS credentials connection
To increase the robustness of this data product, the following scenarios were considered as well as appropriate enhancements:
- Data Increasing by 100x: In this scenario, the project pipeline could first be split into 2 separate DAGs. This first DAG would handle data downloading and S3 upload and could use AWS Elastic Map Reduce (EMR) and Apache Spark to parallelize this task. The second DAG would perform the data warehouse creation and could use more AWS clusters than the current miminum configuration.
- Pipelines were run on a daily basis by 7am: This requirement could be handled in Apache Airflow as part of the DAG configuration.
- Database users increasing by 100+ people: This scenario could be managed using the elastic resize capabilities of AWS Redshift which allows for the addition or subtraction of nodes within minutes.
- Amazon Web Services. AWS MWAA Local Runner Repository. Last Updated Nov 9, 2021.
- Jet Propulsion Laboratory. Mars Science Laboratory (MSL) Software Interface Specification (SIS) Rover Environmental Monitoring Station (REMS) Experiment Data Record (EDR). Jan 31, 2013.
- Jet Propulsion Laboratory. Mars Science Laboratory (MSL) Fact Sheet. Nov 17, 2014.
- The Open University. OpenMars Ozone Column Database. Feb 2019.
- Baum, Mark. REMS Data Downloader Repository. Last updated Oct 17, 2019.
- Programmatic Ponderings. DevOps for DataOps: Building a CI/CD Pipeline for Apache Airflow DAGs. Dec 14, 2021.

