webapi-parser refactoring: before vs after
- RAML used to test: world-music-api
- NodeJS: v14.5.0
- Versions:
- osprey:
- master (v0.6.1): be5c2e5f54f662556e666d19ffd705efd687e302
- rework_webapi_parser: 73c1563f34eebcf2265077c8b01566c77c631e6f
- osprey-mock-service:
- master (v0.5.1): 543c75c38ed23b342840ee9519c67319e3851350
- rework_webapi_parser: 388f0355ad81ccb09b654c033425c53215a1ebf1
- osprey:
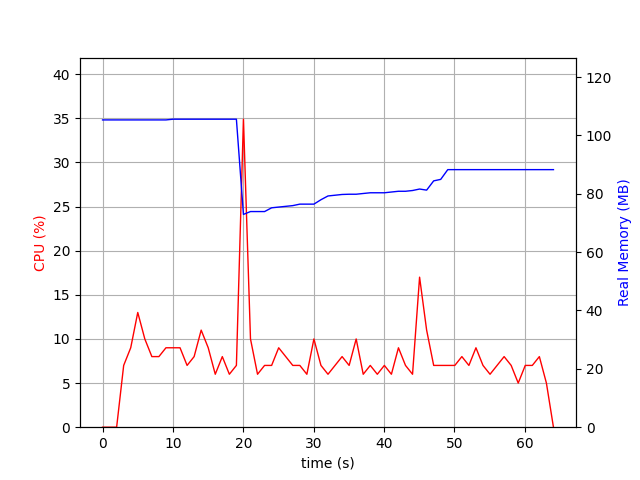
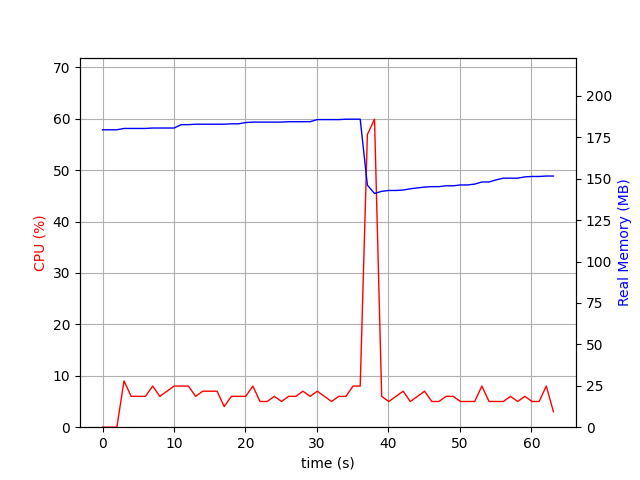
Based on profiling results produced by a specific profiling techniques used and a test application, following conclusions can be made:
Osprey. After the rework with webapi-parser:
- An average time per request decreased by ~37%;
- Number of requests an application is able to serve per second increased by ~60%;
- Average CPU usage stayed roughly the same with periodic 6x spikes;
- Real memory usage increased from 80-110mb to 150-175mb.
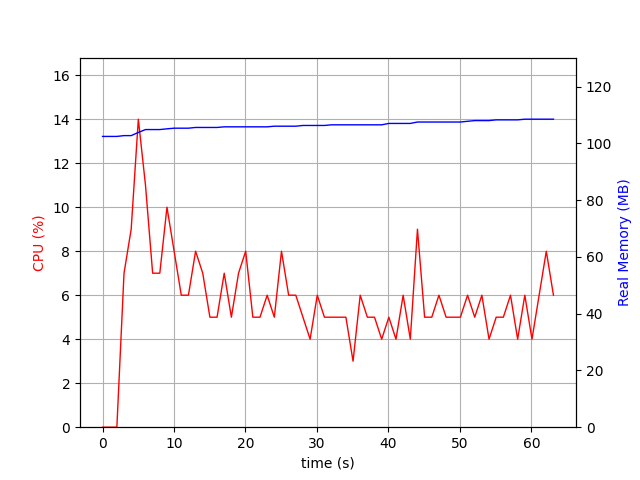
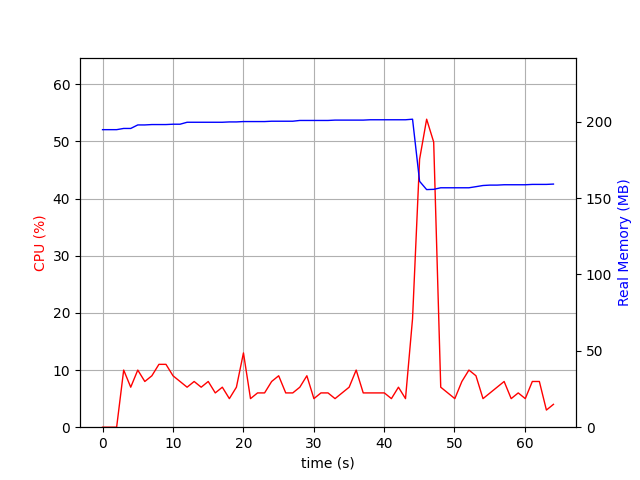
Osprey-mock-service. After the rework with webapi-parser:
- An average time per request decreased by ~17%;
- Number of requests an application is able to serve per second increased by ~17%;
- Average CPU usage stayed roughly the same with periodic 5x spikes;
- Real memory usage increased from 100-110mb to 150-200mb.
To test Osprey from master, install it via npm:
cd ./app
npm install
To test osprey from rework_webapi_parser branch, install it via Makefile and link it to osprey app:
cd ./app
npm install
cd ..
make clone
make install
make link-osprey
make link
Osprey app code can be found in osprey-app.js.
Installation:
sudo apt install apache2-utilsStart server with:
node osprey-app.jsMake requests and profile with (this makes 50000 requests with 10 concurrency):
ab -c 10 -n 50000 -H "Accept: application/json" -H "Authorization: qwe" "http://localhost:3000/songs?genre=foo&access_token=123"Document Path: /songs?genre=foo&access_token=123
Document Length: 41 bytes
Concurrency Level: 10
Time taken for tests: 55.972 seconds
Complete requests: 50000
Failed requests: 0
Total transferred: 12400000 bytes
HTML transferred: 2050000 bytes
Requests per second: 893.31 [#/sec] (mean)
Time per request: 11.194 [ms] (mean)
Time per request: 1.119 [ms] (mean, across all concurrent requests)
Transfer rate: 216.35 [Kbytes/sec] received
Connection Times (ms)
min mean[+/-sd] median max
Connect: 0 0 0.2 0 1
Processing: 6 11 3.4 9 52
Waiting: 3 9 3.0 8 48
Total: 6 11 3.5 9 52
Percentage of the requests served within a certain time (ms)
50% 9
66% 11
75% 12
80% 14
90% 17
95% 18
98% 19
99% 20
100% 52 (longest request)
Document Path:          /songs?genre=foo&access_token=123
Document Length:        41 bytes

Concurrency Level:      10
Time taken for tests:   34.954 seconds
Complete requests:      50000
Failed requests:        0
Total transferred:      12400000 bytes
HTML transferred:       2050000 bytes
Requests per second:    1430.44 [#/sec] (mean)
Time per request:       6.991 [ms] (mean)
Time per request:       0.699 [ms] (mean, across all concurrent requests)
Transfer rate:          346.43 [Kbytes/sec] received

Connection Times (ms)
              min  mean[+/-sd] median   max
Connect:        0    0   0.1      0       1
Processing:     4    7   1.7      6      54
Waiting:        2    5   1.5      5      37
Total:          4    7   1.7      6      54

Percentage of the requests served within a certain time (ms)
  50%      6
  66%      7
  75%      7
  80%      7
  90%      9
  95%     10
  98%     12
  99%     13
 100%     54 (longest request)
Installation:
sudo pip uninstall Pillow
sudo pip install psrecord matplotlib Pillow
sudo apt-get install python-tk
npm install -g artillery
In three different terminals:
- Start server with:
node osprey-app.js- Start profiler:
psrecord $(pgrep node -n) --interval 1 --plot osprey.png- Start
artilleryto generate requests:
artillery run osprey.ymlWhen artillery finishes making requests, switch to the tab with the profiler running, press Ctrl+C and wait for it to draw a plot. When it finishes you can view plot with graph in a osprey.png file.
To test osprey-mock-service from master, install it globally via npm:
npm install -g osprey-mock-serviceand call it with osprey-mock-service command during profiling.
To test osprey-mock-service from rework_webapi_parser branch, install it via Makefile:
make alland call it with node path/to/cloned/mock/bin/osprey-mock-service.js.
Installation:
sudo apt install apache2-utilsStart server with:
osprey-mock-service -f ./world-music-api/api.raml -p 3000Make requests and profile with (this makes 50000 requests with 10 concurrency):
ab -c 10 -n 50000 -H "Accept: application/json" -H "Authorization: qwe" "http://localhost:3000/v1/songs?genre=foo&access_token=123"Document Path: /v1/songs?genre=foo&access_token=123
Document Length: 0 bytes
Concurrency Level: 10
Time taken for tests: 58.818 seconds
Complete requests: 50000
Failed requests: 0
Total transferred: 3750000 bytes
HTML transferred: 0 bytes
Requests per second: 850.08 [#/sec] (mean)
Time per request: 11.764 [ms] (mean)
Time per request: 1.176 [ms] (mean, across all concurrent requests)
Transfer rate: 62.26 [Kbytes/sec] received
Connection Times (ms)
min mean[+/-sd] median max
Connect: 0 0 0.2 0 4
Processing: 2 11 4.0 12 49
Waiting: 2 10 3.7 11 47
Total: 2 12 4.1 12 49
Percentage of the requests served within a certain time (ms)
50% 12
66% 14
75% 14
80% 15
90% 16
95% 17
98% 22
99% 23
100% 49 (longest request)
Document Path:          /v1/songs?genre=foo&access_token=123
Document Length:        0 bytes

Concurrency Level:      10
Time taken for tests:   49.847 seconds
Complete requests:      50000
Failed requests:        0
Total transferred:      3750000 bytes
HTML transferred:       0 bytes
Requests per second:    1003.08 [#/sec] (mean)
Time per request:       9.969 [ms] (mean)
Time per request:       0.997 [ms] (mean, across all concurrent requests)
Transfer rate:          73.47 [Kbytes/sec] received

Connection Times (ms)
              min  mean[+/-sd] median   max
Connect:        0    0   0.3      0       8
Processing:     1   10   3.5     10     101
Waiting:        1    8   3.2      8      99
Total:          2   10   3.6     11     101

Percentage of the requests served within a certain time (ms)
  50%     11
  66%     11
  75%     12
  80%     13
  90%     14
  95%     15
  98%     17
  99%     18
 100%    101 (longest request)
Installation:
sudo pip uninstall Pillow
sudo pip install psrecord matplotlib Pillow
sudo apt-get install python-tk
npm install -g artillery
In three different terminals:
- Start server with:
osprey-mock-service -f ./world-music-api/api.raml -p 3000- Start profiler:
psrecord $(pgrep node -n) --interval 1 --plot osprey-mock.png- Start
artilleryto generate requests:
artillery run osprey-mock-service.ymlWhen artillery finishes making requests, switch to the tab with the profiler running, press Ctrl+C and wait for it to draw a plot. When it finishes you can view plot with graph in a osprey.png file.


