The goal of dftTrafficCounts is to provide easy access to datasets provided by UK Department for Transport (DfT) on their roadtraffic.dft.gov.uk website. See the Metadata document for details.
# install.packages("devtools")
devtools::install_github("itsleeds/dftTrafficCounts")
Load the package (and packages we’ll use below) as follows:
library(dplyr)
library(ggplot2)
library(dftTrafficCounts)You can read-in the data for a single counter point as follows:
d_counter = dtc_import()
#> Rows: 20
#> Columns: 31
#> Delimiter: ","
#> chr [ 8]: region_name, local_authority_name, road_name, road_type, start_junction_road_nam...
#> dbl [23]: count_point_id, year, region_id, local_authority_id, easting, northing, latitude...
#>
#> Use `spec()` to retrieve the guessed column specification
#> Pass a specification to the `col_types` argument to quiet this message
names(d_counter)
#>  [1] "count_point_id"               "year"
#>  [3] "region_id"                    "region_name"
#>  [5] "local_authority_id"           "local_authority_name"
#>  [7] "road_name"                    "road_type"
#>  [9] "start_junction_road_name"     "end_junction_road_name"
#> [11] "easting"                      "northing"
#> [13] "latitude"                     "longitude"
#> [15] "link_length_km"               "link_length_miles"
#> [17] "estimation_method"            "estimation_method_detailed"
#> [19] "pedal_cycles"                 "two_wheeled_motor_vehicles"
#> [21] "cars_and_taxis"               "buses_and_coaches"
#> [23] "lgvs"                         "hgvs_2_rigid_axle"
#> [25] "hgvs_3_rigid_axle"            "hgvs_3_or_4_articulated_axle"
#> [27] "hgvs_4_or_more_rigid_axle"    "hgvs_5_articulated_axle"
#> [29] "hgvs_6_articulated_axle"      "all_hgvs"
#> [31] "all_motor_vehicles"
head(d_counter)
#> # A tibble: 6 x 31
#>   count_point_id  year region_id region_name local_authority… local_authority…
#>            <dbl> <dbl>     <dbl> <chr>                  <dbl> <chr>
#> 1          74816  2019         8 Yorkshire …               63 Leeds
#> 2          74816  2018         8 Yorkshire …               63 Leeds
#> 3          74816  2017         8 Yorkshire …               63 Leeds
#> 4          74816  2016         8 Yorkshire …               63 Leeds
#> 5          74816  2015         8 Yorkshire …               63 Leeds
#> 6          74816  2014         8 Yorkshire …               63 Leeds
#> # … with 25 more variables: road_name <chr>, road_type <chr>,
#> #   start_junction_road_name <chr>, end_junction_road_name <chr>,
#> #   easting <dbl>, northing <dbl>, latitude <dbl>, longitude <dbl>,
#> #   link_length_km <dbl>, link_length_miles <dbl>, estimation_method <chr>,
#> #   estimation_method_detailed <chr>, pedal_cycles <dbl>,
#> #   two_wheeled_motor_vehicles <dbl>, cars_and_taxis <dbl>,
#> #   buses_and_coaches <dbl>, lgvs <dbl>, hgvs_2_rigid_axle <dbl>,
#> #   hgvs_3_rigid_axle <dbl>, hgvs_3_or_4_articulated_axle <dbl>,
#> #   hgvs_4_or_more_rigid_axle <dbl>, hgvs_5_articulated_axle <dbl>,
#> #   hgvs_6_articulated_axle <dbl>, all_hgvs <dbl>, all_motor_vehicles <dbl>
Read-in the data for major roads as follows:
d_roads = dtc_import_roads()
names(d_roads)
Read-in data for all local authorities as follows:
d_las = dtc_import_la()
#> Rows: 5,529
#> Columns: 6
#> Delimiter: ","
#> dbl [6]: local_authority_id, year, link_length_km, link_length_miles, cars_and_taxis, al...
#>
#> Use `spec()` to retrieve the guessed column specification
#> Pass a specification to the `col_types` argument to quiet this message
head(d_las)
#> # A tibble: 6 x 7
#>   local_authority…  year link_length_km link_length_mil… cars_and_taxis
#>              <dbl> <dbl>          <dbl>            <dbl>          <dbl>
#> 1              132  1993           385.             239.     287107347.
#> 2              170  1993           493.             306.     604140896.
#> 3              171  1993           675.             420.     446328949.
#> 4              163  1993           846.             526.     668148078.
#> 5              164  1993           524.             326.     343540976.
#> 6              156  1993           542.             337.     409189896
#> # … with 2 more variables: all_motor_vehicles <dbl>, local_authority_name <chr>
nrow(d_las)
#> [1] 5529
length(unique(d_las$local_authority_id))
#> [1] 210
We can plot the results as follows:
las_of_interest = c("Leeds", "Derby", "Southampton",
                    "Nottingham", "Birmingham")
d_las
#> # A tibble: 5,529 x 7
#>    local_authority…  year link_length_km link_length_mil… cars_and_taxis
#>               <dbl> <dbl>          <dbl>            <dbl>          <dbl>
#>  1              132  1993           385.             239.     287107347.
#>  2              170  1993           493.             306.     604140896.
#>  3              171  1993           675.             420.     446328949.
#>  4              163  1993           846.             526.     668148078.
#>  5              164  1993           524.             326.     343540976.
#>  6              156  1993           542.             337.     409189896
#>  7               74  1993           933.             580.    1024182940
#>  8              198  1993           550.             342.     319820060.
#>  9              193  1993           456.             283.     291962403.
#> 10              169  1993           714.             443.     561704370.
#> # … with 5,519 more rows, and 2 more variables: all_motor_vehicles <dbl>,
#> #   local_authority_name <chr>
d_las_of_interest = d_las %>%
   filter(local_authority_name %in% las_of_interest)
d_las %>%
  ggplot() +
  geom_line(aes(year, all_motor_vehicles, group = local_authority_name), colour = "grey") +
  geom_line(aes(year, all_motor_vehicles, colour = local_authority_name), data = d_las_of_interest, size = 1.2)
u = "http://data.dft.gov.uk/road-traffic/dft_traffic_counts_raw_counts.zip"
d = dtc_import(u = u)This is a large dataset covering all local authorities in Great Britain:
nrow(d)
#> [1] 4337901
ncol(d)
#> [1] 34
names(d)
#>  [1] "count_point_id"               "direction_of_travel"
#>  [3] "year"                         "count_date"
#>  [5] "hour"                         "region_id"
#>  [7] "local_authority_id"           "road_name"
#>  [9] "road_category"                "road_type"
#> [11] "start_junction_road_name"     "end_junction_road_name"
#> [13] "easting"                      "northing"
#> [15] "latitude"                     "longitude"
#> [17] "link_length_km"               "link_length_miles"
#> [19] "sequence"                     "ramp"
#> [21] "pedal_cycles"                 "two_wheeled_motor_vehicles"
#> [23] "cars_and_taxis"               "buses_and_coaches"
#> [25] "lgvs"                         "hgvs_2_rigid_axle"
#> [27] "hgvs_3_rigid_axle"            "hgvs_4_or_more_rigid_axle"
#> [29] "hgvs_3_or_4_articulated_axle" "hgvs_5_articulated_axle"
#> [31] "hgvs_6_articulated_axle"      "all_hgvs"
#> [33] "all_motor_vehicles"           "local_authority_name"
head(d$local_authority_name)
#> [1] "Lancashire" "Lancashire" "Lancashire" "Lancashire" "Lancashire"
#> [6] "Lancashire"
We can look at how patterns change over time for the whole dataset.
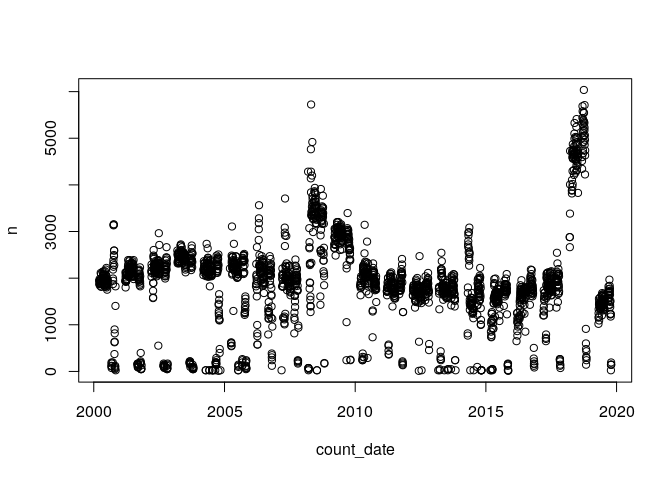
Lets look at the number of count entries for each year.
summary(d$count_date)
#>         Min.      1st Qu.       Median         Mean      3rd Qu.         Max.
#> "2000-03-17" "2005-05-13" "2009-06-26" "2010-01-28" "2015-04-24" "2019-10-18"
d_year_count = d %>% count(year)
d_day_count = d %>% count(count_date)
plot(d_day_count)
# could become package function
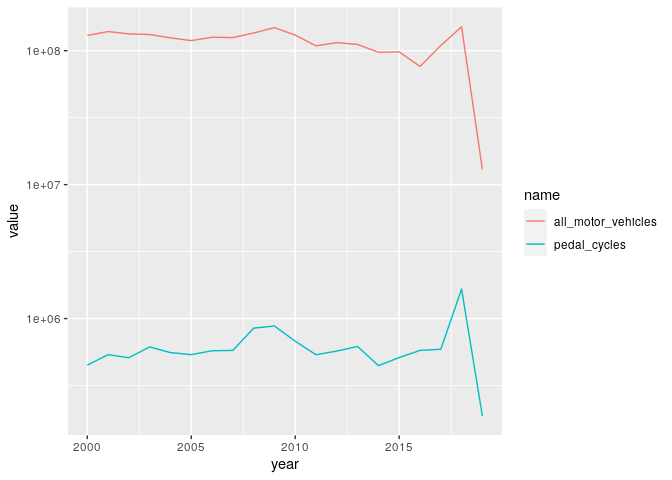
tar_read(summary_mode) %>%
ggplot() +
geom_line(aes(year, value, colour = name)) +
scale_y_log10()And by local authorities:
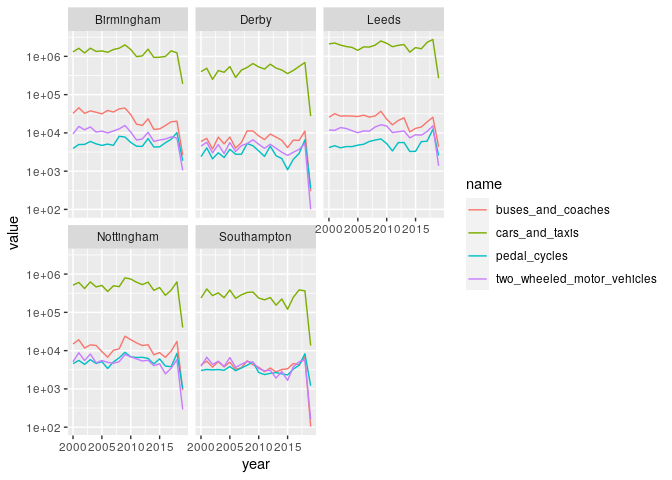
d_sample = d %>% filter(local_authority_name %in% las_of_interest)
d_summary_la = d_sample %>%
  select(pedal_cycles:buses_and_coaches | matches("year|local_authority_name")) %>%
  group_by(year, local_authority_name) %>%
  summarise_all(sum) %>%
  tidyr::pivot_longer(cols = pedal_cycles:buses_and_coaches)
ggplot(d_summary_la) +
  geom_line(aes(year, value, colour = name)) +
  facet_wrap(~local_authority_name) +
scale_y_log10()You can reproduce the work presented here using the targets package:
targets::tar_make()Parts of the project are updated as follows:
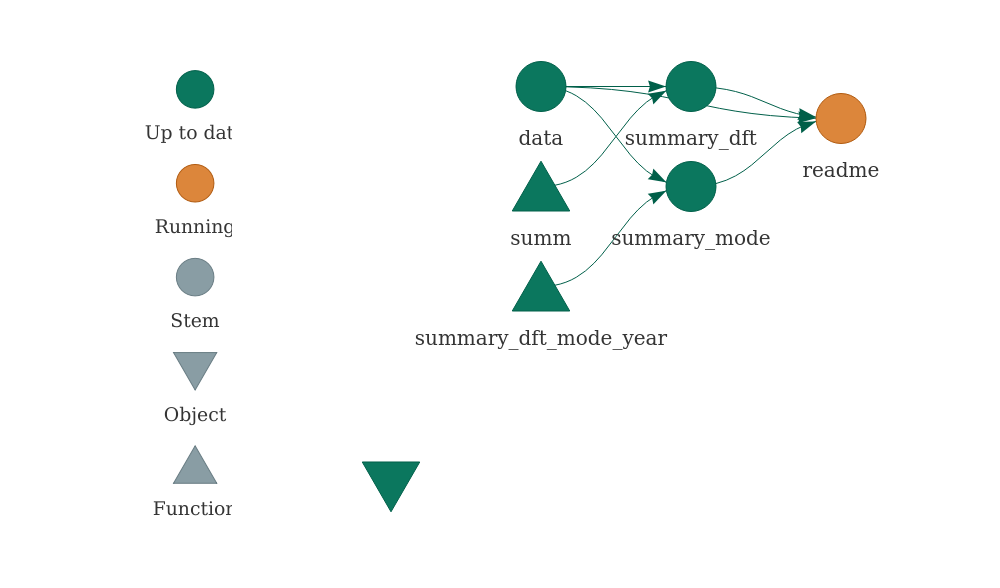
tar_visnetwork()A summary of the raw DfT data is shown below:
print(tar_read(summary_dft))
#>  count_point_id   direction_of_travel      year        count_date
#>  Min.   :    51   Length:4337901      Min.   :2000   Min.   :2000-03-17
#>  1st Qu.: 46110   Class :character    1st Qu.:2005   1st Qu.:2005-05-13
#>  Median :810147   Mode  :character    Median :2009   Median :2009-06-26
#>  Mean   :529590                       Mean   :2010   Mean   :2010-01-28
#>  3rd Qu.:945786                       3rd Qu.:2015   3rd Qu.:2015-04-24
#>  Max.   :999999                       Max.   :2019   Max.   :2019-10-18
#>       hour        region_id      local_authority_id  road_name
#>  Min.   : 0.0   Min.   : 1.000   Min.   :  1.0      Length:4337901
#>  1st Qu.: 9.0   1st Qu.: 4.000   1st Qu.: 67.0      Class :character
#>  Median :12.0   Median : 7.000   Median : 97.0      Mode  :character
#>  Mean   :12.5   Mean   : 6.157   Mean   :102.5
#>  3rd Qu.:15.0   3rd Qu.: 9.000   3rd Qu.:141.0
#>  Max.   :18.0   Max.   :11.000   Max.   :210.0
#>  road_category       road_type         start_junction_road_name
#>  Length:4337901     Length:4337901     Length:4337901
#>  Class :character   Class :character   Class :character
#>  Mode  :character   Mode  :character   Mode  :character
#>
#>
#>
#>  end_junction_road_name    easting          northing          latitude
#>  Length:4337901         Min.   : 70406   Min.   :  10240   Min.   :49.91
#>  Class :character       1st Qu.:367870   1st Qu.: 178500   1st Qu.:51.49
#>  Mode  :character       Median :432710   Median : 275950   Median :52.36
#>                         Mean   :432488   Mean   : 302533   Mean   :52.61
#>                         3rd Qu.:510541   3rd Qu.: 396995   3rd Qu.:53.47
#>                         Max.   :655040   Max.   :1209448   Max.   :60.76
#>    longitude       link_length_km     link_length_miles    sequence
#>  Min.   :-7.4431   Length:4337901     Length:4337901     Length:4337901
#>  1st Qu.:-2.4816   Class :character   Class :character   Class :character
#>  Median :-1.5119   Mode  :character   Mode  :character   Mode  :character
#>  Mean   :-1.5373
#>  3rd Qu.:-0.3847
#>  Max.   : 2.0000
#>      ramp            pedal_cycles      two_wheeled_motor_vehicles
#>  Length:4337901     Min.   :   0.000   Min.   :  0.000
#>  Class :character   1st Qu.:   0.000   1st Qu.:  0.000
#>  Mode  :character   Median :   0.000   Median :  1.000
#>                     Mean   :   2.873   Mean   :  4.982
#>                     3rd Qu.:   2.000   3rd Qu.:  5.000
#>                     Max.   :2207.000   Max.   :768.000
#>  cars_and_taxis   buses_and_coaches       lgvs         hgvs_2_rigid_axle
#>  Min.   :   0.0   Min.   :   0.000   Min.   :   0.00   Min.   :   0.00
#>  1st Qu.:  44.0   1st Qu.:   0.000   1st Qu.:   7.00   1st Qu.:   0.00
#>  Median : 195.0   Median :   2.000   Median :  29.00   Median :   3.00
#>  Mean   : 417.2   Mean   :   5.662   Mean   :  71.33   Mean   :  14.43
#>  3rd Qu.: 517.0   3rd Qu.:   7.000   3rd Qu.:  82.00   3rd Qu.:  14.00
#>  Max.   :9709.0   Max.   :1425.000   Max.   :5811.00   Max.   :2327.00
#>  hgvs_3_rigid_axle hgvs_4_or_more_rigid_axle hgvs_3_or_4_articulated_axle
#>  Min.   : -3.000   Min.   :  0.000           Min.   :  0.00
#>  1st Qu.:  0.000   1st Qu.:  0.000           1st Qu.:  0.00
#>  Median :  0.000   Median :  0.000           Median :  0.00
#>  Mean   :  2.368   Mean   :  2.597           Mean   :  2.14
#>  3rd Qu.:  2.000   3rd Qu.:  2.000           3rd Qu.:  1.00
#>  Max.   :290.000   Max.   :796.000           Max.   :927.00
#>  hgvs_5_articulated_axle hgvs_6_articulated_axle    all_hgvs
#>  Min.   :   0.000        Min.   :   0.000        Min.   :   0.00
#>  1st Qu.:   0.000        1st Qu.:   0.000        1st Qu.:   1.00
#>  Median :   0.000        Median :   0.000        Median :   5.00
#>  Mean   :   7.449        Mean   :   7.459        Mean   :  36.45
#>  3rd Qu.:   2.000        3rd Qu.:   2.000        3rd Qu.:  26.00
#>  Max.   :1107.000        Max.   :1430.000        Max.   :2691.00
#>  all_motor_vehicles local_authority_name
#>  Min.   :    0.0    Length:4337901
#>  1st Qu.:   54.0    Class :character
#>  Median :  245.0    Mode  :character
#>  Mean   :  535.6
#>  3rd Qu.:  650.0
#>  Max.   :10905.0


