LLPhyScore: An interpretable machine learning algorithm to predict disordered protein phase separation based on biophysical interactions
LLPhyScore is a bioinformatic tool for the prediction of protein phase separation. This repository contains the source code for developing this tool.
Protein phase separation has significant roles in many biological processes, including cellular organization, signaling, transcription, biological materials and pathological aggregation. Understanding of this property of proteins is key for mechanistic insights into normal function and pathology, including in neurological disorders, required for therapeutic development.
Many proteins involved in phase separation contain intrinsically disordered protein regions (IDRs) that contribute to phase behavior. It has been found that IDR phase separation can be driven by a wide range of weak physicochemical interactions, including electrostatic interactions, pi-pi stacking, cation-pi interactions, hydrogen bonding, and hydrophobic effect. Therefore, it is very difficult to come up with a "perfect" physical model to explain and predict IDR-driven protein phase separation.
We developed this tool (LLPhyScore) to provide insights into the sequence-dependence of IDR-driven phase separation and the underlying physicochemical interactions. It is named partly based on the acronym LLPS for liquid-liquid phase separation but is designed to address all phase separation by various mechanisms relying on exchanging interactions of chemical groups within IDRs. It uses machine learning methods to draw biophysical insights from a set of currently known (~500) phase separating IDR sequences. We first developed and trained a sequence embedding system that provides interpretation of the driving forces of IDR phase separation. Then, we trained a supervised classification model on the biophysical embedding on training samples. The predictive model achieved a high accuracy (92%) on the test set, while providing insights for future experiments.
Follow these steps to install LLPhyScore:
Step 1: Make sure you have Python3 in your computer.
- How to check and/or install Python3 version - https://realpython.com/installing-python/
- Official Python website - https://www.python.org/
Step 2: Clone from the official repository:
git clone https://github.com/julie-forman-kay-lab/LLPhyScore.git
Step 3: Navigate to the new LLPhyScore folder:
cd LLPhyScore
Step 4: A Python3 environment with pre-installed libraries (numpy, scipy, pandas, tqdm, scikit-learn) is required to run LLPhyScore in your machine. If you don't want to change your default Python3 environment, please do the following to create a virtual environment:
- Make sure you have pip3 installed in your Python3 environment; If not, install pip3 - https://ehmatthes.github.io/pcc/chapter_12/installing_pip.html
- In your terminal, install
virtualenv, a tool to create isolated Python environments. (If you already havevirtualenvinstalled, skip this step.)pip3 install virtualenv - In your terminal, create a virtual environment named "LLPhyScore_venv".
virtualenv LLPhyScore_venv - Activate "LLPhyScore_venv" environment.
source LLPhyScore_venv/bin/activate
Step 5: In your preferred environment (either your default Python3 environment, or a virtual environment as set up in Step 4), use pip to install Python library dependencies.
pip3 install -r requirements.txt
Step 6: Unpack the standalone package:
cd standalone_package
tar -xvf LLPhyScore-standalone-20220627.tar.gz
Follow these steps to use the LLPhyScore (standalone package) on example fasta file to predict the LLPS propensity of FUS:
Step 1: Navigate to the standalone package folder:
cd standalone_package/LLPhyScore
Step 2: Run LLPhyScore on the example fasta file. You should see output scores for example sequences.
python3 LLPhyScore_standalone.py -i ./example.fasta
Step 3: To run LLPhyScore on your other fasta files, replace ./example.fasta with your fasta file's path in Step 4. You can only run one file at a time.
-
There are three models trained on three different negative datasets to use: (i) trained on human+PDB; (ii) trained on human proteome only; (iii) trained on PDB only. Default option is (i) human+PDB, but you can change which model to use by passing your wanted type to argument
-m.# using (human+PDB) model. (Default option) python3 LLPhyScore_standalone.py -i ./example.fasta -m human+PDB # using (human) model. python3 LLPhyScore_standalone.py -i ./example.fasta -m human # using (PDB) model. python3 LLPhyScore_standalone.py -i ./example.fasta -m PDB -
There are five options for sequence-level score output: (i) raw score; (ii) percentile ranking; (iii) zscore (iv) modified zscore (v) all score types. Default option is (ii) percentile ranking, but you can change output score type by passing your wanted type to argument
-s. (All "relative" score types are calculated against a negative proteome dataset that is aligned with the traning model option.)# output raw score python3 LLPhyScore_standalone.py -i ./example.fasta -s raw # output percentile ranking (Default option) python3 LLPhyScore_standalone.py -i ./example.fasta -s percentile # output zscore python3 LLPhyScore_standalone.py -i ./example.fasta -s zscore # output modified zscore python3 LLPhyScore_standalone.py -i ./example.fasta -s modified_zscore # output all score types python3 LLPhyScore_standalone.py -i ./example.fasta -s all -
There are two extra options for residue-level score output: (i) sum-score of 100 top-scored residues in the sequence; (ii) score of each individual residue in a sequence (smoothed out over its neighboring 50 residues). You can get residue-level results by passing them to argument
-s.# output sum-score of 100 top-scored residues python3 LLPhyScore_standalone.py -i ./example.fasta -s top100_residue_sum # output residue-level score python3 LLPhyScore_standalone.py -i ./example.fasta -s residue_level -
By default, the output scores are not saved. To save the scores in a csv file, pass the file path you want to save to argument
-o.python3 LLPhyScore_standalone.py -i ./example.fasta -o your_file_name.csv
Step 4: After running, exit or delete your virtual environment.
# exit virtual environment
deactivate

# delete virtual environment
rm -rf LLPhyScore_venv

The src directory contains the Python modules for building and training of LLPhyScore.
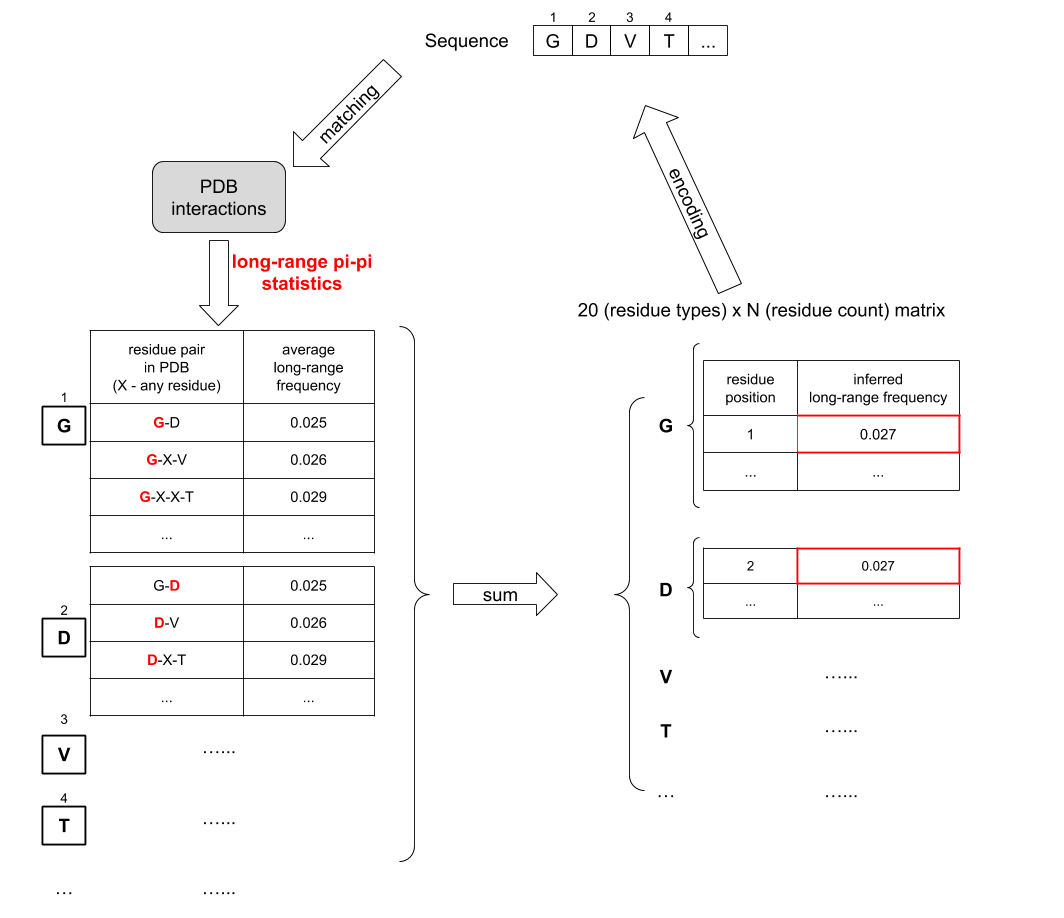
This is the module that I wrote to load input protein sequences. Each protein sequence is converted to a 'grid' representation with multiple levels as shown in this figure. Each 'grid' is a nested python dictionary that has multiple levels.
- In the first level, the dict keys are 8 different biophysical features; (dict values are the info stored in the next level)
- In the second level, the dict keys are 20 different amino acid residues; (dict values are the info stored in the next level)
- In the third level, each amino acid residue (keys in the second level) is mapped to a 3xN matrix (N can be different for different residues in different sequences). The first column of the matrix is the position index of this residue; The second column and third column is the inferred biophysical feature statistics for this residue (e.g. mean electrostatic charge for glycine) extracted from PDB.

This is the module with functions to construct a sequence "embedding" - by assigning a threshold ("weight") to a sequence "grid" for all biophysical feature statistics. The idea behind this design is that I found that the distributions for theses biophysical feature statistics in PDB are mostly normal distributions, and therefore if a residue's inferred biophysical feature statistics is abnormally high or abnormally low, there is a higher possibility that they will cause abnormal phase transition behavior. So I will put a statistics threshold ("weight") for each residue in each feature, and by comparing the "grid" to the "weight" using rewarding/penalizing functions, I calculated a overall score for each feature for a given sequence. The training/optimization of the sequence "embedding" system is just the problem of finding the best threshold ("weight") such that my positive samples and negative samples in the training set have very different overall scores, which is performed in the "Trainer" module.
This is the module that I wrote to train the embedding. Each residue type's biophysical feature was initiated with a "weight" - a threshold to judge this residue's biophysical activity by. By finding the optimal threshold ("weight") for each biophysical feature such that it maximize the separation of "grid-to-weight" score between positive and negative training samples. The optimization process uses genetic algorithm and stochastic optimization; The optimized metric is ROC AUC score.
This is module where my trained ML model is encapsulated and loaded to calculate the phase separation probability of any input sequence or fasta file.
This is the module to store residue names, mappings of variables and biophysical feature names.
This is the module to store directory configurations.
This is the module to store utility functions and classes.
The data/raw directory contains the raw datasets used to train LLPhyScore algorithm:
TRUE_POSITIVE_SEQUENCES_UNTAGGED_20191126.fastacontains 565 curated LLPS-positive sequences.PDB.TOTALSET.fastacontains 16794 PDB sequences collected from high-resolution (≤2.0 A) structures in PDB database.uniprot_reference_human_24NOV2019.fastacontains 20380 human proteome sequences collected from Unitprot.
The data/processed/total directory contains processed datasets generated from raw datasets:
tp_seq_tags.pklcontains tags of 565 LLPS-positive sequences.tp_seq_seqs.pklcontains sequences of 565 LLPS-positive sequences.tp_seq_groups.pklcontains clustered groups of 565 LLPS-positive sequences, clustering on sequence similarity.pdb_seq_tags.pklcontains tags of randomly selected 3406 PDB sequences.pdb_seq_seqs.pklcontains sequences of randomly selected 3406 PDB sequences.human_seq_tags.pklcontains tags of randomly selected 3406 human sequences.human_seq_seqs.pklcontains sequences of randomly selected 3406 human sequences.
The data/cleaned directory contains LLPhyScore raw scores of human/PDB proteome against different models, for calculation of Z-score and percentile rankings:
human_g2w_scores_using_PDBweight.csvcontains scores of human proteome sequences agains "PDB" model.human_g2w_scores_using_humanweight.csvcontains scores of human proteome sequences agains "human" model.human_g2w_scores_using_human+PDBweight.csvcontains scores of human proteome sequences agains "human+PDB" model.PDB_g2w_scores_using_PDBweight.csvcontains scores of PDB proteome sequences agains "PDB" model.PDB_g2w_scores_using_humanweight.csvcontains scores of PDB proteome sequences agains "human" model.PDB_g2w_scores_using_human+PDBweight.csvcontains scores of PDB proteome sequences agains "human+PDB" model.
The model directory contains the trained models for 8 selected features ('protein-water', 'protein-carbon', 'hydrogen bond (long-range)', 'pi-pi (long-range)', 'disorder (long)', 'K-Beta similarity', 'disorder (short)', 'electrostatic (short-range)'), using different negative training sets:
trained_weights.8FEATURES.PDB.pklis the model trained using PDB sequences as negative dataset.trained_weights.8FEATURES.human.pklis the model trained using human sequences as negative dataset.trained_weights.8FEATURES.human+PDB.pklis the model trained using human+PDB sequences as negative dataset.random_weight.pklis the randomly initialized model used during training.
The clustering directory contains the code and data for Jaccard-similarity-based clustering of LLPS-positive sequences:
Dipeptide.pycontains the code to calculate the pair-wise Jaccard similarity for all sequence-sequence pairs within any given sequence or fasta file.Cluster_seqs.pyperforms hieararchical clustering of LLPS-positive sequences based on pair-wise Jaccard similarity.Plot_cluster.pycontains the code to visualize all sequence clusters.clustering_datafolder contains the input and output data of sequence clustering.
Currently, this tool is only deployed as an offline Python script. To run it, see above "Usage Example" section. Online deployment of this tool as a web-app is on the way.
If you use LLPhyScore, please cite:
An interpretable machine learning algorithm to predict disordered protein phase separation based on biophysical interactions
Hao Cai, Robert M. Vernon, Julie D. Forman-Kay. bioRxiv 2022.07.06.499043 (2022). doi: 10.1101/2022.07.06.499043
Authors: Hao Cai, Robert M. Vernon, Julie D. Forman-Kay
Affliation: JFK lab, Molecular Medicine Program, SickKids Hospital, Toronto, ON M5G 0A4, Canada
Email: forman@sickkids.ca