Event Study package is an open-source python project created to facilitate the computation of financial event study analysis.
$ pip install eventstudyYou can read the full documentation here.
Go through the Get started section to discover through simple
examples how to use the eventstudy package to run your event study for a single event or a sample of events.
Read the API guide for more details on functions and their parameters.
Launch the interactive notebook to play with the package yourself
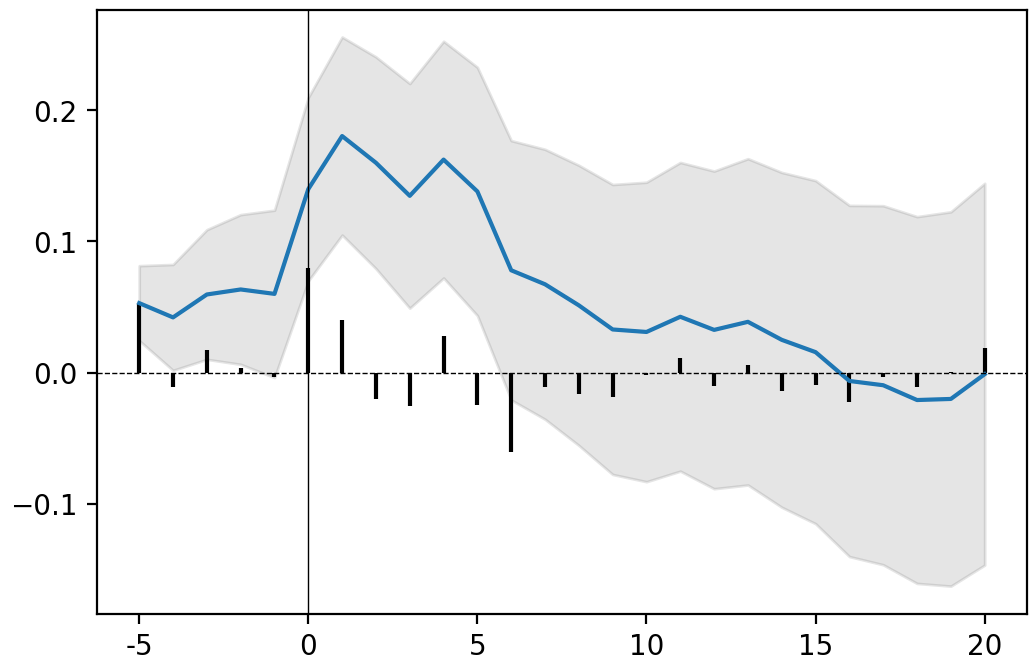
As an introductory example, we will compute the event study analysis of the announcement of the first iphone, made by Steve Jobs during MacWorld exhibition, on January 7, 2007.
import eventstudy as es
import numpy as np
import matplotlib.pyplot as plt

event = es.EventStudy.FamaFrench_3factor(
    security_ticker = 'AAPL',
    event_date = np.datetime64('2013-03-04'),
    event_window = (-2,+10),
    estimation_size = 300,
    buffer_size = 30
)

event.plot(AR=True)
plt.show() # use standard matplotlib function to display the plotevent.results(decimals=[3,5,3,5,2,2])| AR | Variance AR | CAR | Variance CAR | T-stat | P-value | |
|---|---|---|---|---|---|---|
| -5 | -0.053 | 0.00048 | -0.053 ** | 0.00048 | -2.42 | 0.01 |
| -4 | 0.012 | 0.00048 | -0.041 * | 0.00096 | -1.33 | 0.09 |
| -3 | -0.013 | 0.00048 | -0.055 * | 0.00144 | -1.43 | 0.08 |
| -2 | 0.004 | 0.00048 | -0.051 | 0.00192 | -1.15 | 0.13 |
| -1 | 0 | 0.00048 | -0.051 | 0.00241 | -1.03 | 0.15 |
| 0 | -0.077 | 0.00048 | -0.128 ** | 0.00289 | -2.37 | 0.01 |
| 1 | -0.039 | 0.00048 | -0.167 *** | 0.00337 | -2.88 | 0 |
| 2 | 0.027 | 0.00048 | -0.14 ** | 0.00385 | -2.26 | 0.01 |
| 3 | 0.024 | 0.00048 | -0.116 ** | 0.00433 | -1.77 | 0.04 |
| 4 | -0.024 | 0.00048 | -0.14 ** | 0.00481 | -2.02 | 0.02 |
| 5 | 0.023 | 0.00048 | -0.117 * | 0.00529 | -1.61 | 0.05 |
| ... |
A user-friendly interface has been developped using streamlit and can be accessed here.
