Great and powerful data vizualizationz
Oz is a library for data-driven, REPL-based data visualization in the browser, using vega and vega-lite.
Oz itself is almost no code. The real magic is in vega & vega-lite.
If you don't already know about vega/vega-lite, it's worth taking a few minutes to orient yourself with this mindblowing talk/demo from the creators at the Interactive Data Lab (IDL) at University of Washington.
The long story short is that vega and vega-lite are declarative grammars for describing data visualizations.
Of note, they are based on the Grammar of Graphics, which served as the guiding light for the popular R ggplot2 viz library.
In this setting, we define visualizations by specifying at a high level how attributes of our data map to aesthetics properties of visualization.
Vega-lite in particular aims to be a less verbose and more automated flavor of vega, with features focused on maximal leverage for day to day usage.
Watched the IDL talk and hungry for more content? Here's another which focuses on the philosophical ideas behind Vega & Vega-Lite, how they relate to Clojure, and how you can use the tools from Clojure using Oz.
Oz itself provides:
- a REPL API for for pushing vega and vega-lite data to a browser window over websockets
- client side
vegaandvega-liteReagent components - an API for composing vega & vega-lite together in the context of html as hiccup for document and dashboard generation
- plot/document publishing/sharing features via GitHub gists, the IDL's live vega editor, and ozviz.io.
It also has the following eventual goals:
- use as a static build tool for publishing scientific documents
- provide an API for combining vega and vega-lite into a single plot (vega for detailed control, vega-lite for the simple bits)
- higher level viz constructors, as they accrete and become useful
Some other things in the Vega/Vega-Lite ecosystem you may want to look at
- Vega Editor - Wonderful editing tool (as mentioned above) for editing and sharing Vega/Vega-Lite data visualizations.
- Ozviz - Sister project to Oz: A Vega Editor like tool for sharing (and soon editing) hiccup with embedded Vega/Vega-Lite visualizations, as used with the
view!function. - Voyager - Also from the IDL, Voyager is a wonderful Tableau like (drag and drop) tool for exploring data and constructing exportable Vega/Vega-Lite visualizations.
- Vega Examples & Vega-Lite Examples - A robust showcase of visualizations from which to draw inspiration and code.
- Vega home - More great stuff from the IDL folks.
- Hanami - Cool library from Jon Anthony with high level constructors for Vega/Vega-Lite data
If you clone this repository and open up the dev/user.clj file, you can follow along by executing the
commented out code block at the end of the file.
Assuming you're starting from scratch, first add oz to your leiningen project dependencies
Next, require oz and start the plot server as follows:
(require '[oz.core :as oz])

(oz/start-plot-server!)
This will fire up a browser window with a websocket connection for funneling view data back and forth. If you forget to call this function, it will be called for you when you create your first plot, but be aware
that it will delay the first display, and it's possible you'll have to resend the plot on a slower computer.
Next we'll define a function for generating some dummy data
(defn play-data [& names]
  (for [n names
        i (range 20)]
{:time i :item n :quantity (+ (Math/pow (* i (count n)) 0.8) (rand-int (count n)))}))The simplest function for displaying vega or vega-lite is oz/v!.
It will display a single vega or vega-lite plot in any connected browser windows.
For example, a simple line plot:
(def line-plot
  {:data {:values (play-data "monkey" "slipper" "broom")}
   :encoding {:x {:field "time"}
              :y {:field "quantity"}
              :color {:field "item" :type "nominal"}}
   :mark "line"})

;; Render the plot
(oz/v! line-plot)
Should render something like:
Another example:
(def stacked-bar
  {:data {:values (play-data "munchkin" "witch" "dog" "lion" "tiger" "bear")}
   :mark "bar"
   :encoding {:x {:field "time"
                  :type "ordinal"}
              :y {:aggregate "sum"
                  :field "quantity"
                  :type "quantitative"}
              :color {:field "item"
                      :type "nominal"}}})

(oz/v! stacked-bar)
This should render something like:
For vega instead of vega-lite, you can also specify :mode :vega to oz/v!:
;; load some example vega (this may only work from within a checkout of oz; haven't checked)

(require '[cheshire.core :as json])

(def contour-plot (json/parse-string (slurp (clojure.java.io/resource "contour-lines.vega.json"))))
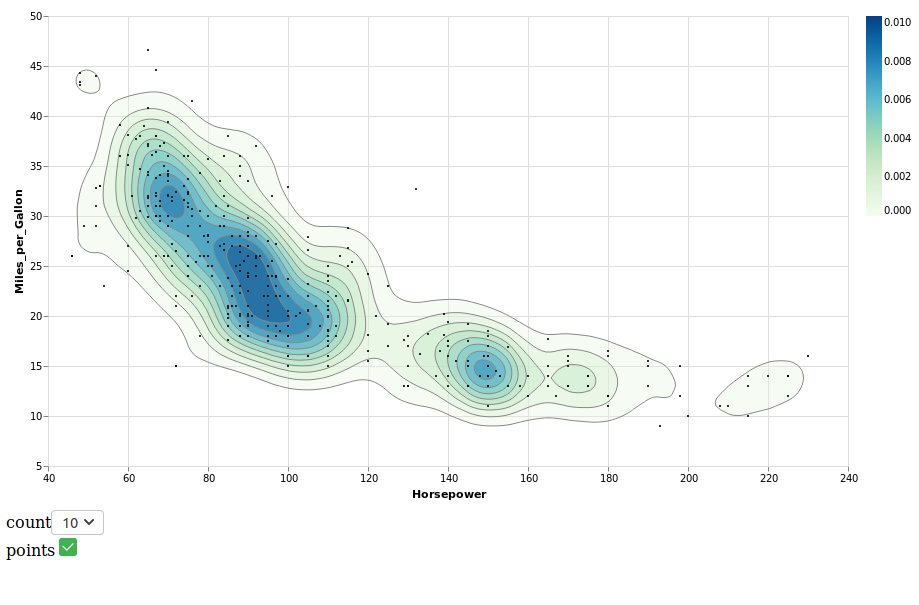
(oz/v! contour-plot :mode :vega)
This should render like:
This is a more powerful function which will let you compose vega and vega-lite views together with other html, using hiccup notation. The idea is to provide some quick and dirty utilities for building composite view dashboards and scientific documents.
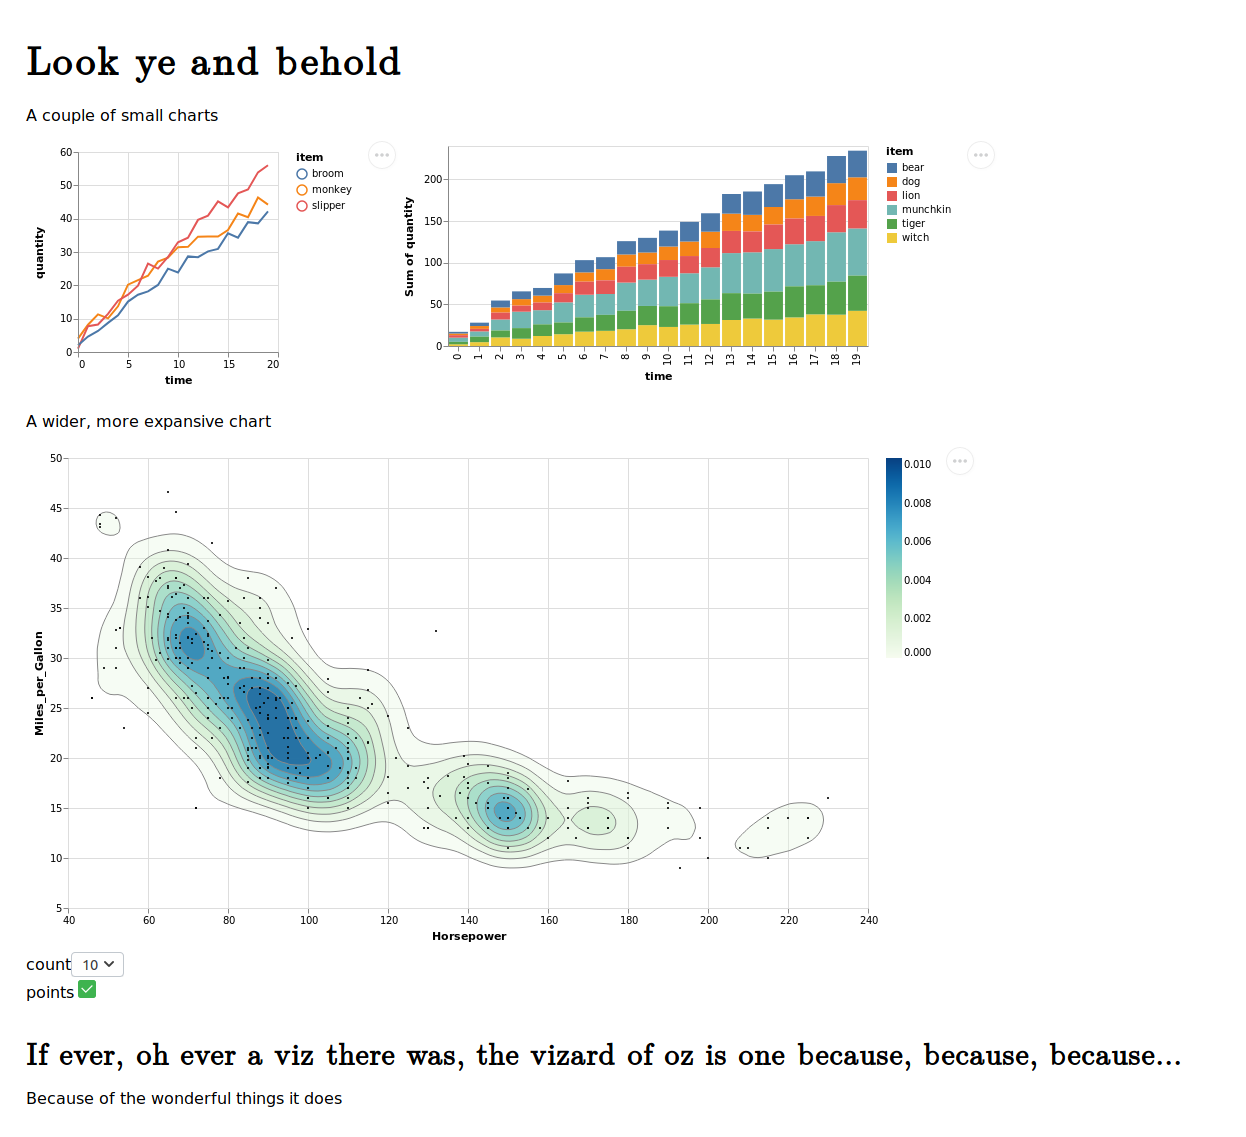
For demonstration we'll combine the three plots above into one:
(def viz
  [:div
    [:h1 "Look ye and behold"]
    [:p "A couple of small charts"]
    [:div {:style {:display "flex" :flex-direction "row"}}
      [:vega-lite line-plot]
      [:vega-lite stacked-bar]]
    [:p "A wider, more expansive chart"]
    [:vega contour-plot]
    [:h2 "If ever, oh ever a viz there was, the vizard of oz is one because, because, because..."]
    [:p "Because of the wonderful things it does"]])

(oz/view! viz)
Note that the vega and vega-lite specs are described in the output vega as using the :vega and :vega-lite keys.
You should now see something like this:
Note that vega/vega-lite already have very powerful and impressive plot concatenation features which allow for coupling of interactivity between plots in a viz. However, combing things through hiccup like this is nice for expedience, and for leverage over the full expressiveness of HTML (tables anyone?).
Also note that while not illustrated above, you can specify multiple maps in these vectors, and they will be merged into one.
So for example, you can do [:vega-lite stacked-bar {:width 100}] to override the width.
Looking to share your cool plots or hiccup documents with someone?
We've got you covered via the publish! utility function.
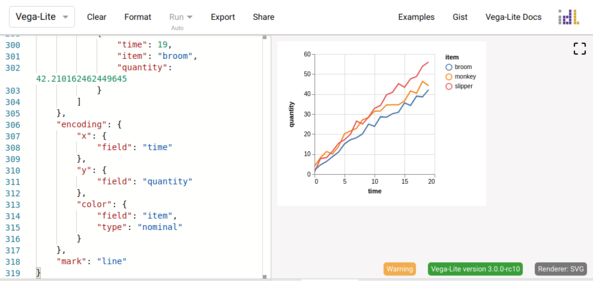
This will post the plot content to a GitHub Gist, and use the gist uuid to create a vega-editor link which prints to the screen. When you visit the vega-editor link, it will load the gist in question and place the content in the editor. It renders the plot, and updates in real time as you tinker with the code, making it a wonderful yet simple tool for sharing and prototyping.
user=> (oz/publish! stacked-bar)
Gist url: https://gist.github.com/87a5621b0dbec648b2b54f68b3354c3a
Raw gist url: https://api.github.com/gists/87a5621b0dbec648b2b54f68b3354c3a
Vega editor url: https://vega.github.io/editor/#/gist/vega-lite/metasoarous/87a5621b0dbec648b2b54f68b3354c3a/e1d471b5a5619a1f6f94e38b2673feff15056146/vega-viz.json
Following the Vega editor url with take you here (click on image to follow):
As mentioned above, we can also share our hiccup documents/dashboards. Since Vega Editor knows nothing about hiccup, we've created ozviz.io as a tool for loading these documents.
user=> (oz/publish! viz)
Gist url: https://gist.github.com/305fb42fa03e3be2a2c78597b240d30e
Raw gist url: https://api.github.com/gists/305fb42fa03e3be2a2c78597b240d30e
Ozviz url: http://ozviz.io/#/gist/305fb42fa03e3be2a2c78597b240d30e
Try it out: http://ozviz.io/#/gist/305fb42fa03e3be2a2c78597b240d30e
In order to use the oz/publish! function, you must provide authentication.
The easiest way is to pass :auth "username:password" to the oz/publish! function.
However, this can be problematic in that you don't want these credentials accidentally strewn throughout your code or ./.lein-repl-history.
To address this issue, oz/publish! will by default try to read authorization parameters from a file at ~/.oz/github-creds.edn.
The contents should be a map of authorization arguments, as passed to the tentacles api.
While you can use {:auth "username:password"} in this file, as above, it's far better from a security standpoint to use OAuth tokens.
- First, generate a new token (Settings > Developer settings > Personal access tokens):
- Enter a description like "Oz api token"
- Select the "[ ] gist" scope checkbox, to grant gisting permissions for this token
- Click "Generate token" to finish
- Copy the token and paste place in your
~/.oz/github-creds.ednfile as{:oauth-token "xxxxxxxxxxxxxx"}
When you're finished, it's a good idea to run chmod 600 ~/.oz/github-creds.edn so that only your user can read the credential file.
And that's it!
Your calls to (oz/publish! spec) should now be authenticated.
Sadly, GitHub used to allow the posting of anonymous gists, without the requirement of authentication, which saved us from all this hassle. However, they've since deprecated this. If you like, you can submit a comment asking that GitHub consider enabling auto-expiring anonymous gists, which would avoid this setup.
If you like, you may also use the Reagent components found at oz.core to render vega and/or vega-lite you construct client side.
[:div
 [oz.core/vega { ... }]
 [oz.core/vega-lite { ... }]]
At present, these components do not take a second argument. The merging of spec maps described above applies prior to application of this reagent component.
Eventually we'll be adding options for hooking into the signal dataflow graphs within these visualizations so that interactions in a Vega/Vega-Lite visualization can be used to inform other Reagent components in your app.
For development environment, dev/utils.clj has
(do-it-fools!)Then do yer thing.
I'm frequently shocked (pleasantly) at how if I find I'm unable to do something in Vega or Vega-Lite that I think I should, updating the Vega or Vega-Lite version fixes the problem. As a side note, I think this speaks volumes of the stellar job (pun intended) the IDL has been doing of developing these tools. More to the point though, if you find yourself unable to do something you expect to be able to do, it's not a bad idea to try
- Make sure your Oz version is up to date, in case there's a more recent Vega/Vega-Lite versions required there fix the problem.
- Check cljsjs to see if there's a more recent version of the Vega/Vega-Lite (or Vega-Embed or Vega-Hover, as appropriate).
You can override whatever version of these libraries is getting used by Oz by adding the correspoding
[cljsjs/vega-* ...]coordinates to yourproject.cljdependencies list. As long as this comes before your Oz version specification, your cljsjs version specification should take precedence. - If there's not a more recent version on cljsjs, but there are more up to date versions of the JS libraries (check the github pages or npm). Read below for instructions.
- If this still doesn't solve your problem, file an issue on the appropriate Vega GitHub project. I've found the developers super responsive to issues.
For more context and information, see the cljsjs creating pacakages, updating packages and creating externs documentation.
For convenience, I've automated much of this work in the script at ./bin/update-cljsjs.sh.
Copyright © 2018 Christopher Small
Forked from Vizard (with thanks) - Copyright © 2017 Yieldbot, Inc.
Distributed under the Eclipse Public License either version 1.0 or (at your option) any later version.


