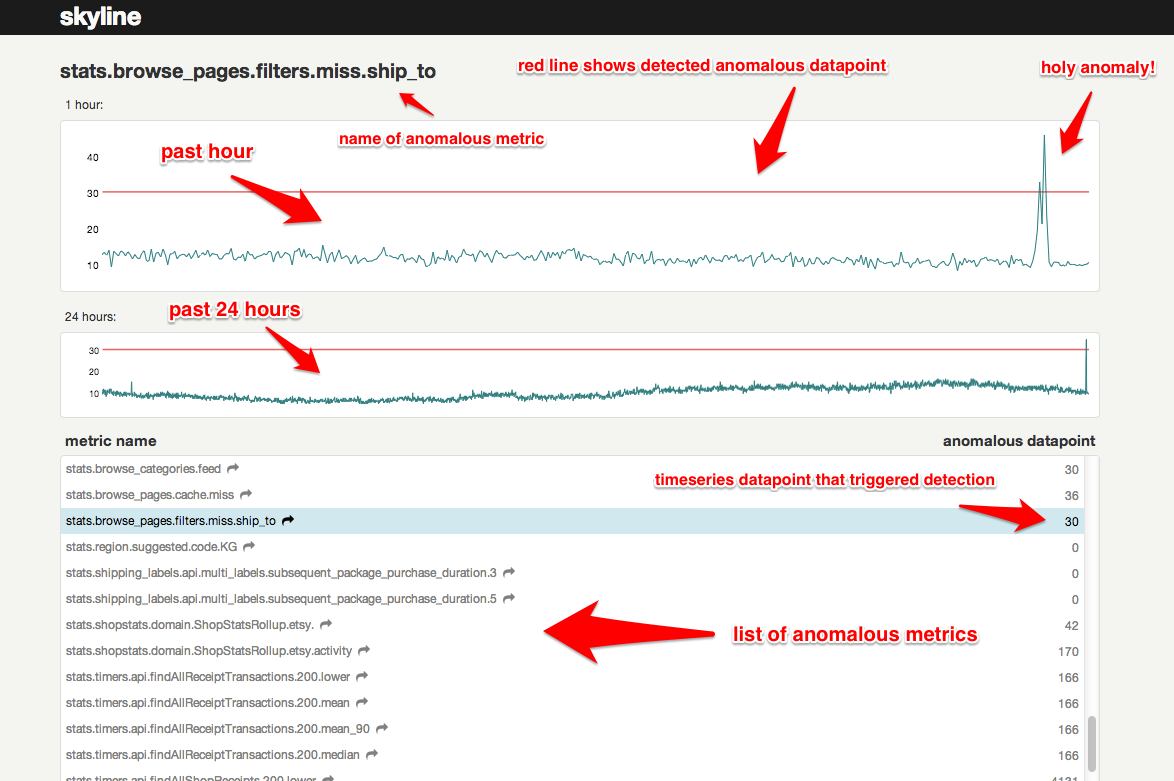
Skyline is a real-time* anomaly detection* system*, built to enable passive monitoring of hundreds of thousands of metrics, without the need to configure a model/thresholds for each one, as you might do with Nagios. It is designed to be used wherever there are a large quantity of high-resolution timeseries which need constant monitoring. Once a metrics stream is set up (from StatsD or Graphite or other source), additional metrics are automatically added to Skyline for analysis. Skyline's easily extendible algorithms automatically detect what it means for each metric to be anomalous. After Skyline detects an anomalous metric, it surfaces the entire timeseries to the webapp, where the anomaly can be viewed and acted upon.
Read the details in the wiki.
-
sudo pip install -r requirements.txtfor the easy bits -
Install numpy, scipy, pandas, patsy, statsmodels, msgpack_python in that order.
-
You may have trouble with SciPy. If you're on a Mac, try:
sudo port install gcc48sudo ln -s /opt/local/bin/gfortran-mp-4.8 /opt/local/bin/gfortransudo pip install scipy
On Debian, apt-get works well for Numpy and SciPy. On Centos, yum should do the trick. If not, hit the Googles, yo.
-
cp src/settings.py.example src/settings.py -
Add directories:
sudo mkdir /var/log/skyline
sudo mkdir /var/run/skyline
sudo mkdir /var/log/redis
-
Download and install the latest Redis release
-
Start 'er up
cd skyline/binsudo redis-server redis.confsudo ./horizon.d startsudo ./analyzer.d startsudo ./webapp.d start
By default, the webapp is served on port 1500.
- Check the log files to ensure things are running.
Debian + Vagrant specific, if you prefer
-
If you already have a Redis instance running, it's recommended to kill it and restart using the configuration settings provided in bin/redis.conf
-
Be sure to create the log directories.
Of course not. You've got no data! For a quick and easy test of what you've got, run this:
cd utils
python seed_data.py
This will ensure that the Horizon service is properly set up and can receive data. For real data, you have some options - see wiki
Once you get real data flowing through your system, the Analyzer will be able start analyzing for anomalies!
Skyline can alert you! In your settings.py, add any alerts you want to the ALERTS
list, according to the schema (metric keyword, strategy, expiration seconds) where
strategy is one of smtp, hipchat, or pagerduty. You can also add your own
alerting strategies. For every anomalous metric, Skyline will search for the given
keyword and trigger the corresponding alert(s). To prevent alert fatigue, Skyline
will only alert once every for any given metric/strategy
combination.
An ensemble of algorithms vote. Majority rules. Batteries kind of included. See wiki
See the rest of the wiki
We actively welcome contributions. If you don't know where to start, try checking out the issue list and fixing up the place. Or, you can add an algorithm - a goal of this project is to have a very robust set of algorithms to choose from.
Also, feel free to join the skyline-dev mailing list for support and discussions of new features.
(*depending on your data throughput, *you might need to write your own algorithms to handle your exact data, *it runs on one box)

