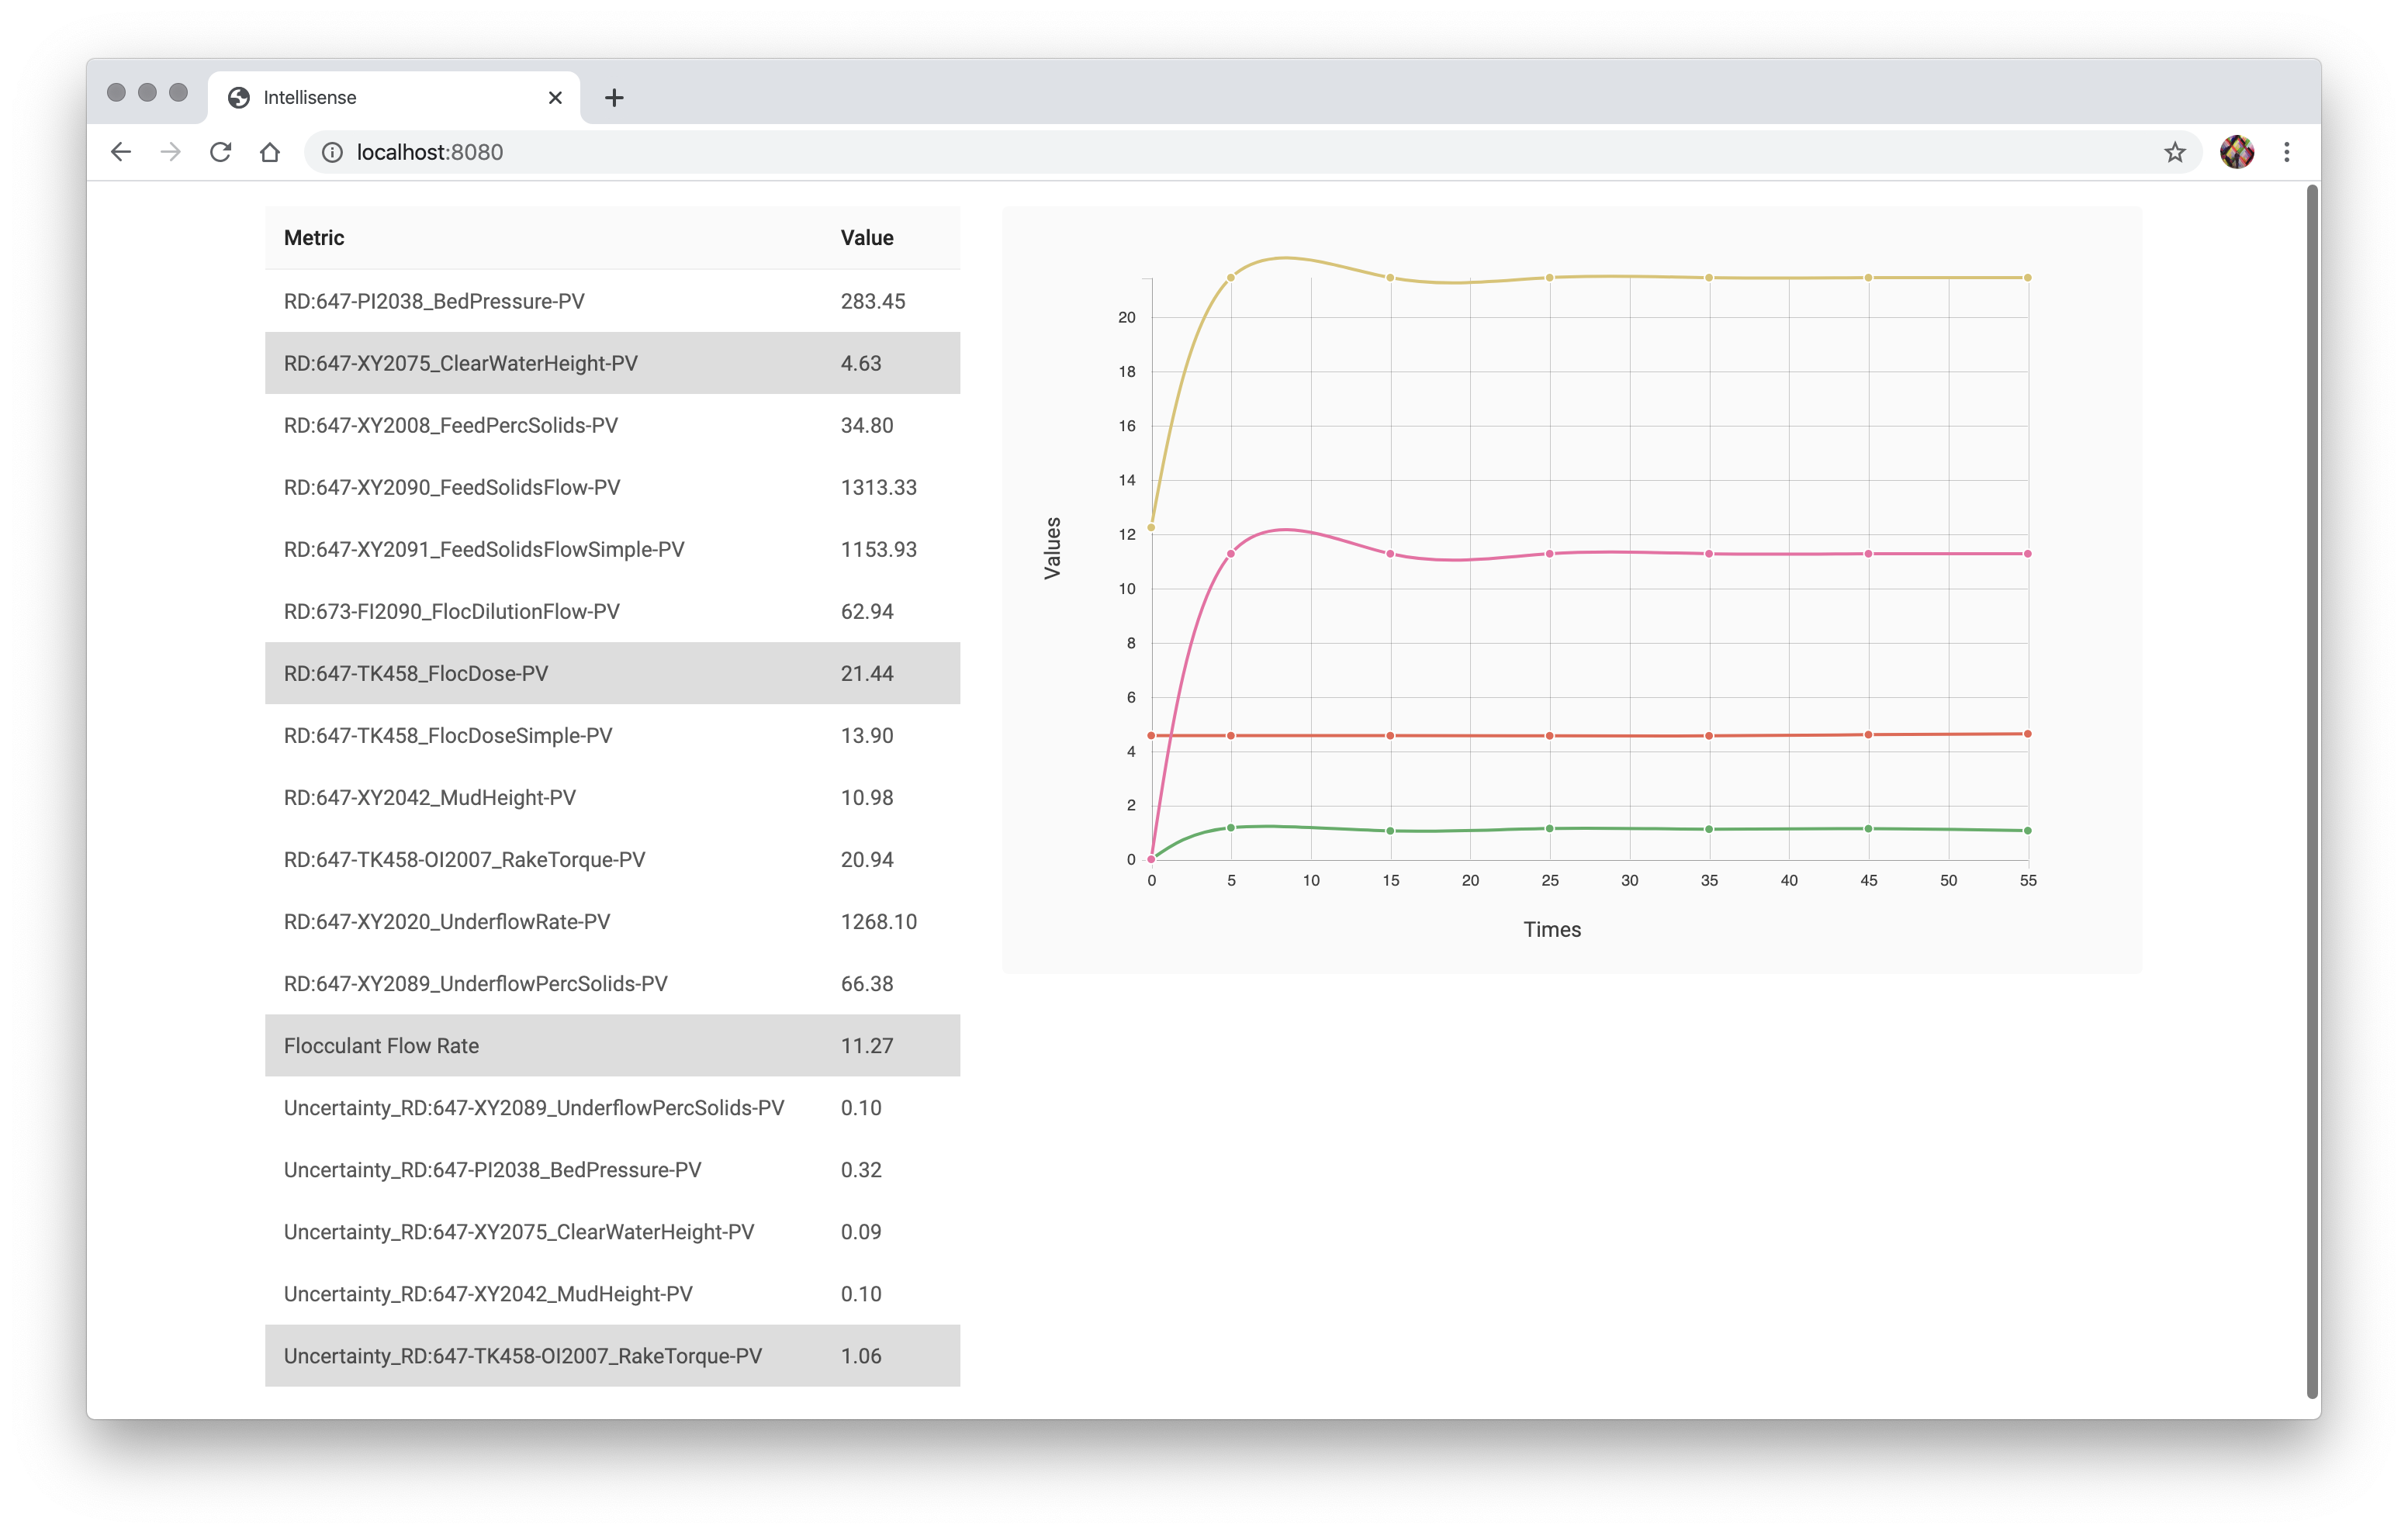
This is a single page application to visualize data from the provided API endpoint in both a table and a line graph.
Data visualization and analysis is important to better understand the current state of the equipment and therefore make better decisions about it’s operation.
-
Download the project and cd into it:
git clone https://github.com/junagao/intellisense-data-visualization.git cd intellisense-data-visualization -
Install dependencies and run the application:
yarn
yarn dev
-
Open your browser and navigate to:
- React 16
- Redux
- Redux Dev Tools
- Redux Thunk
- Webpack 4
- Babel 7
- Hot Module Replacement
- ESLint (airbnb styleguide)
- Prettier
- Husky
- lint-staged
- axios
- D3
- Styled Components
- Jest
- Enzyme
Juliane Nagao - GitHub - LinkedIn
This project is licensed under the MIT License.
