- Installation
- Example for multitype.pp
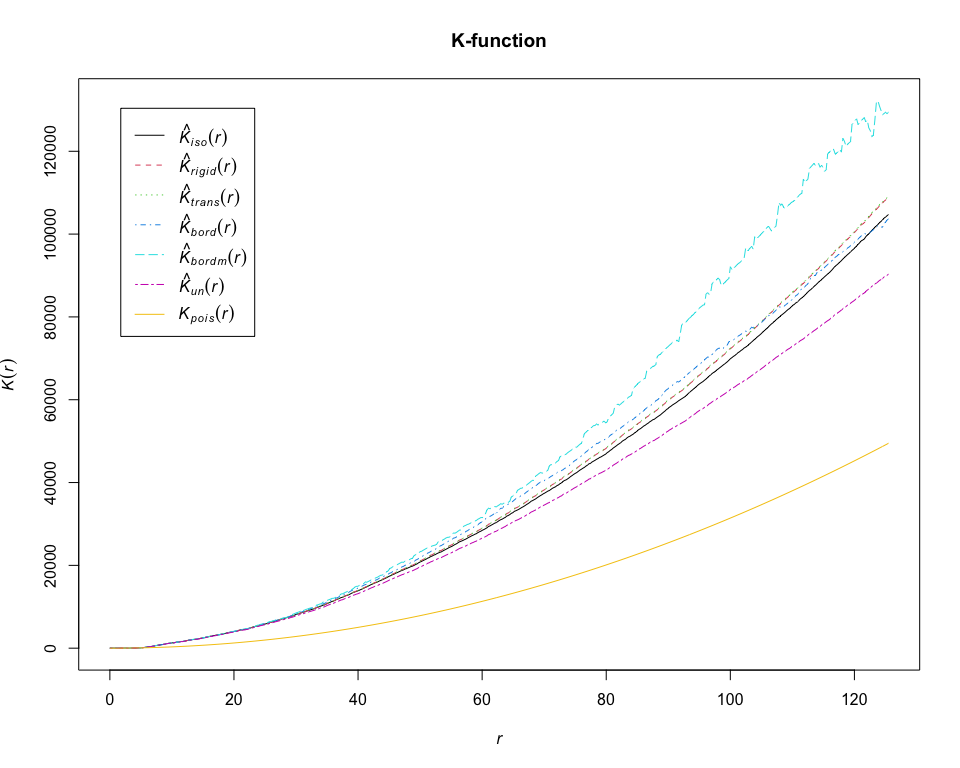
- Example for Kest
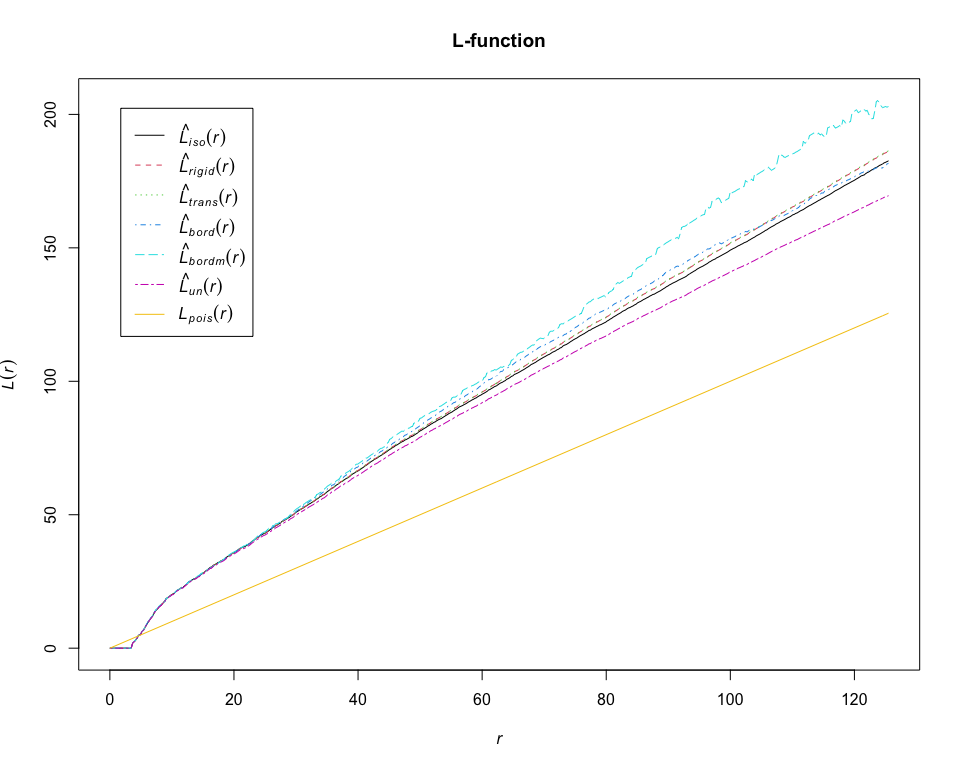
- Example for Lest
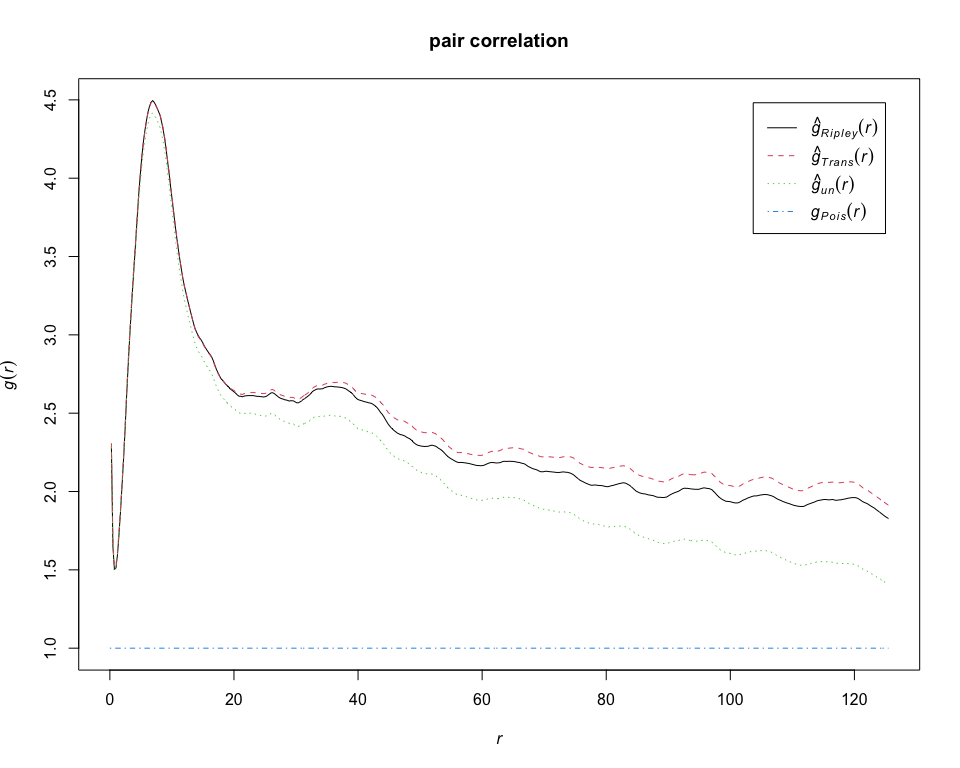
- Example for pcfest
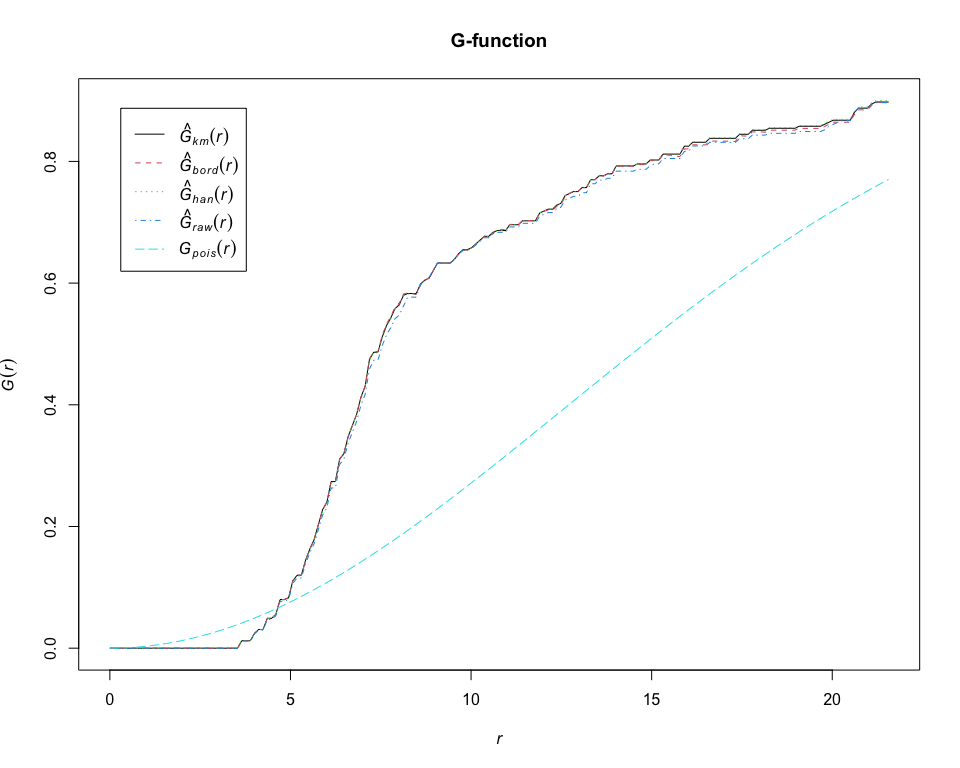
- Example for Gest
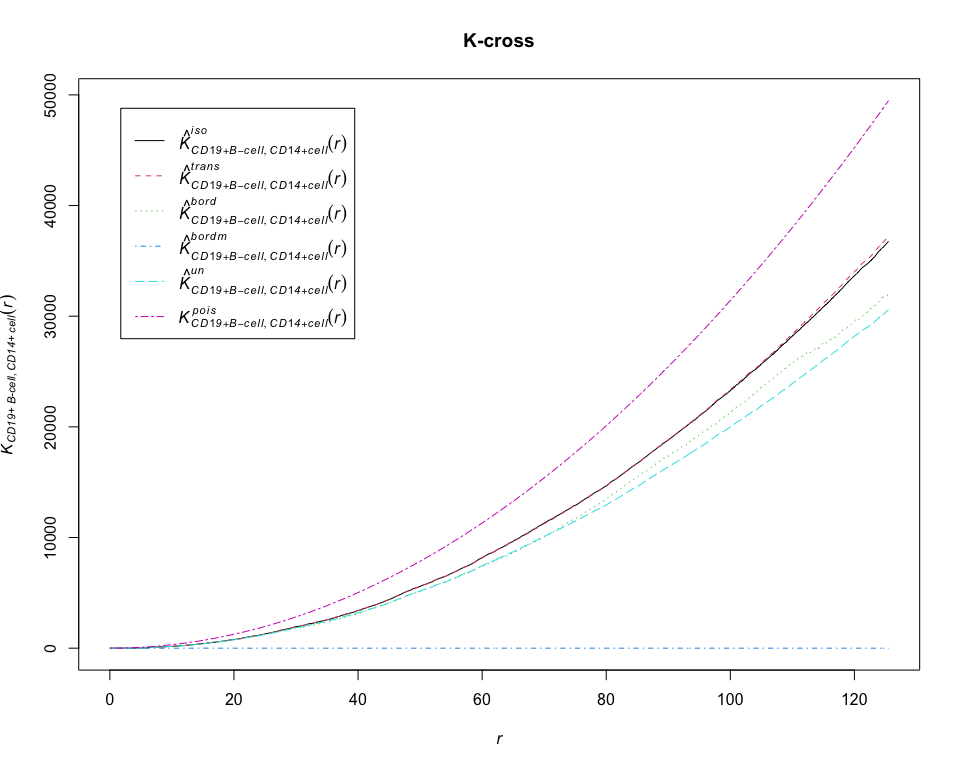
- Example for Kcross
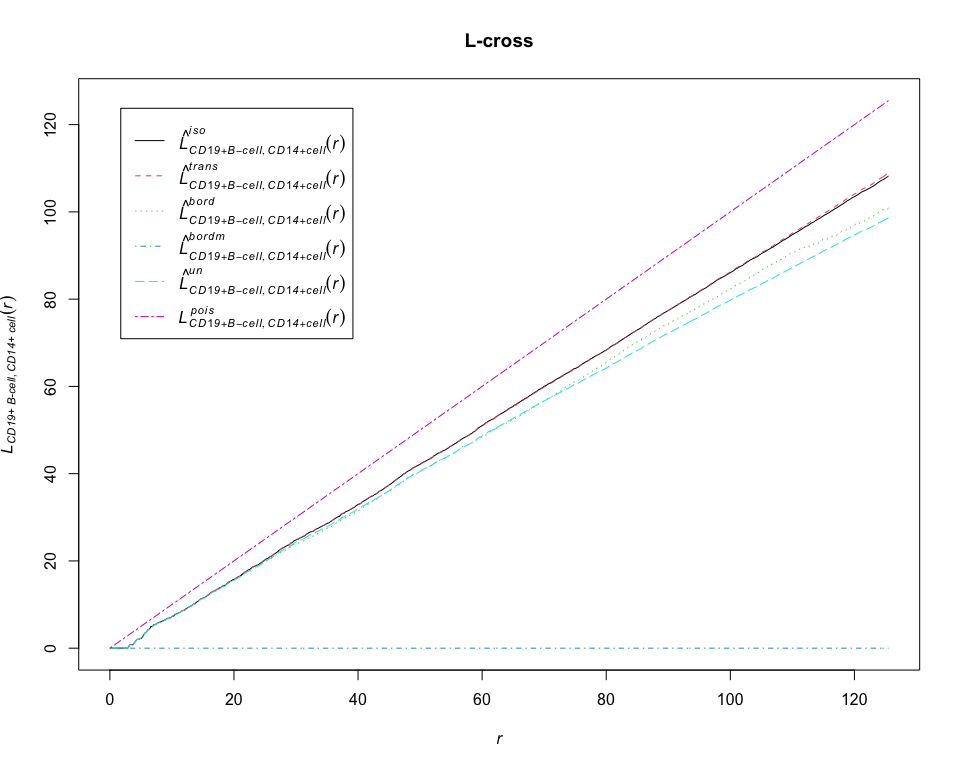
- Example for Lcross
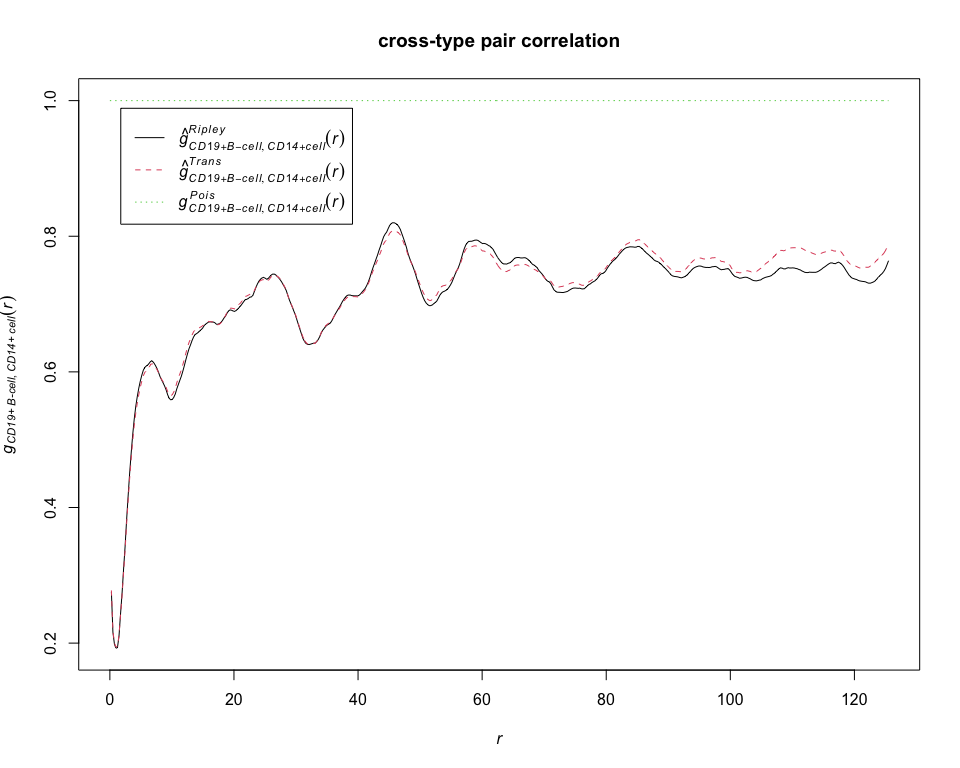
- Example for pcfcross
- Example for Gcross
- Example for envelope
The R package MItools provides a collection of standard spatial
statistics tools for analyzing multiplexed imaging data.
To install the latest version from Github, use
library(devtools)
devtools::install_github("junsoukchoi/MItools")library(MItools)
# load pre-processed lung cancer data
load(url("https://github.com/julia-wrobel/MI_tutorial/raw/main/Data/lung.RDA"))
# randomly select a lung cancer image and define cell types
library(dplyr)
subj_df = filter(lung_df, image_id == "#73 6-333-711_[44841,18646].im3")
subj_df = subj_df %>%
mutate(phenotype = case_when(
phenotype_cd19 == "CD19+" ~ "CD19+ B-cell",
phenotype_cd14 == "CD14+" ~ "CD14+ cell",
phenotype_cd8 == "CD8+" ~ "CD8+ T-cell",
phenotype_cd4 == "CD4+" ~ "CD4+ T-cell",
phenotype_ck == "CK+" ~ "CK+ cancer cell",
TRUE ~ "Other"
))
# convert the selected lung cancer image into the object of class "ppp" representing a multitype point pattern
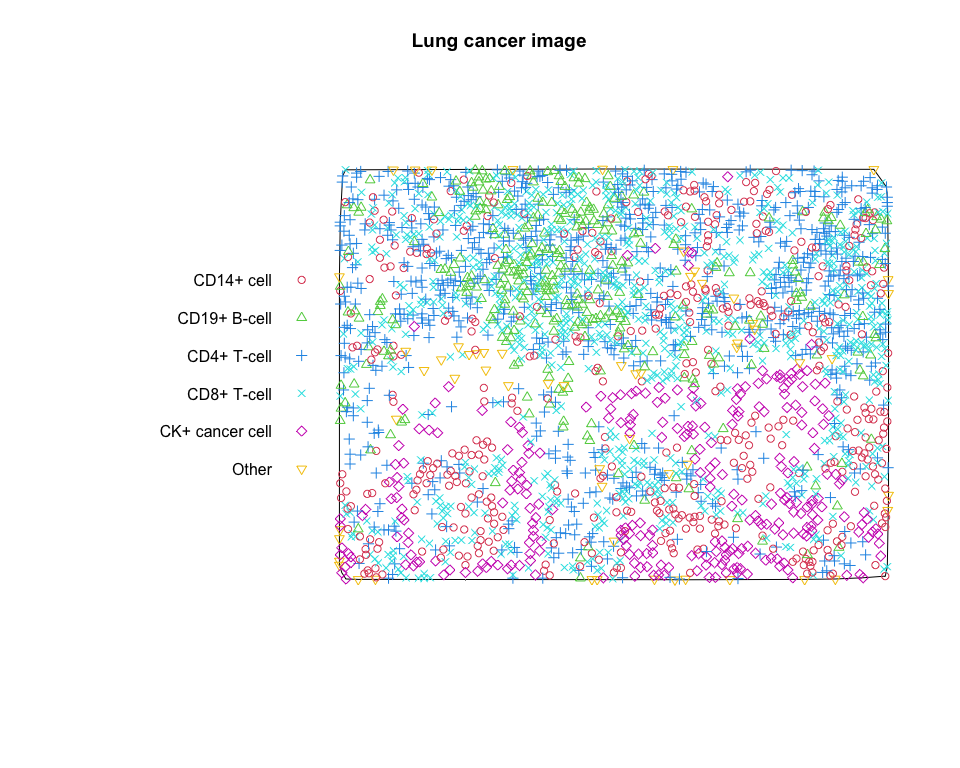
pp_lung = multitype.pp(subj_df$x, subj_df$y, subj_df$phenotype)
# plot the multitype point pattern
plot(pp_lung, main = "Lung cancer image", cols = 2 : 7)# calculate estimates of the K-function for CD19+ B-cell
K = Kest(pp_lung, "CD19+ B-cell", correction = "all")## Warning: Periodic correction is not defined for non-rectangular windows
plot(K, main = "K-function")# calculate estimates of the L-function for CD19+ B-cell
L = Lest(pp_lung, "CD19+ B-cell", correction = "all")## Warning: Periodic correction is not defined for non-rectangular windows
plot(L, main = "L-function")# calculate estimates of the pair correlation function for CD19+ B-cell
g = pcfest(pp_lung, "CD19+ B-cell", correction = "all")
plot(g, main = "pair correlation")# calculate estimates of the G-function for CD19+ B-cell
G = Gest(pp_lung, "CD19+ B-cell", correction = "all")
plot(G, main = "G-function")# calculate estimates of the K-cross function between CD19+ B-cell and CD14+ cell
K = Kcross(pp_lung, "CD19+ B-cell", "CD14+ cell", correction = "all")## Warning: Periodic correction is not defined for non-rectangular windows
plot(K, main = "K-cross")# calculate estimates of the L-cross function between CD19+ B-cell and CD14+ cell
L = Lcross(pp_lung, "CD19+ B-cell", "CD14+ cell", correction = "all")## Warning: Periodic correction is not defined for non-rectangular windows
plot(L, main = "L-cross")# calculate estimates of the cross-type pair correlation function between CD19+ B-cell and CD14+ cell
g = pcfcross(pp_lung, "CD19+ B-cell", "CD14+ cell", correction = "all")
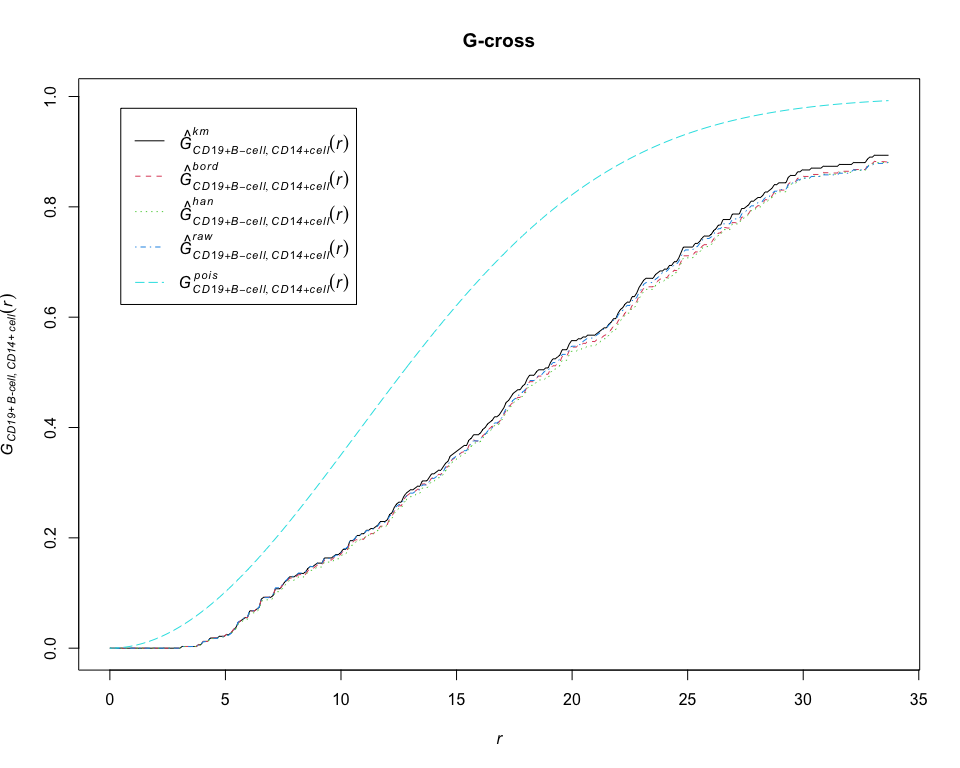
plot(g, main = "cross-type pair correlation")# calculate estimates of the G-cross function between CD19+ B-cell and CD14+ cell
G = Gcross(pp_lung, "CD19+ B-cell", "CD14+ cell", correction = "all")
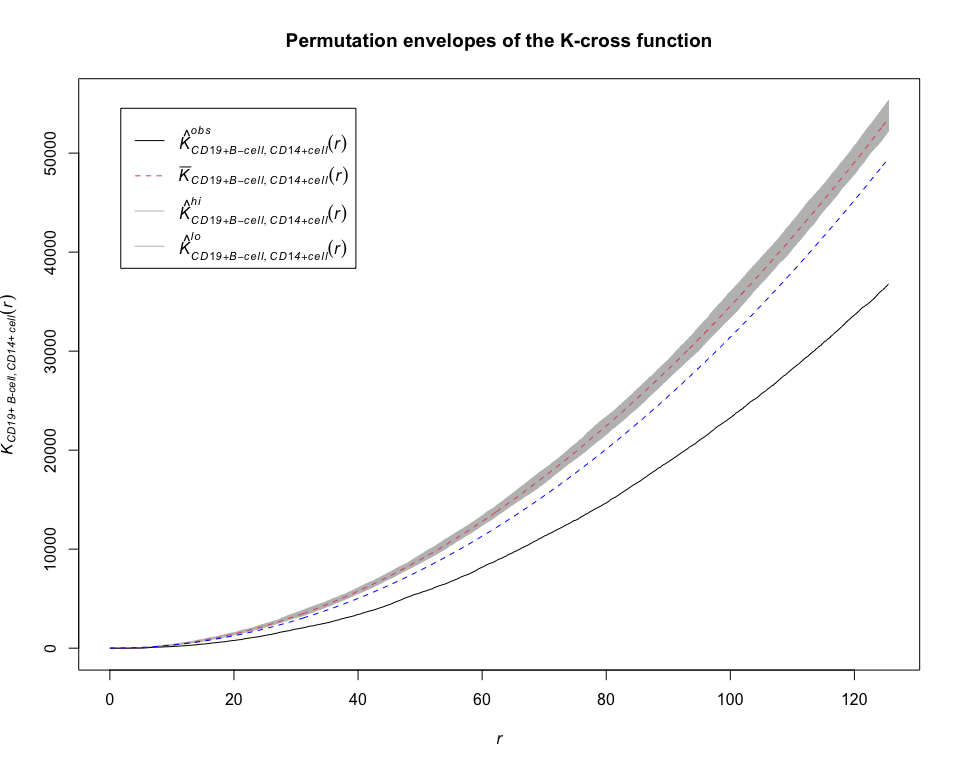
plot(G, main = "G-cross")# compute permutation envelopes of the K-cross function between CD19+ B-cell and CD14+ cell under CSR
envelope_K = permute.envelope(pp_lung, Kcross, funargs = list(i = "CD19+ B-cell", j = "CD14+ cell", correction = "isotropic"))## Generating 39 simulations by evaluating expression ...
## 1, 2, 3, 4, 5, 6, 7, 8, 9, 10, 11, 12, 13, 14, 15, 16, 17, 18, 19, 20,
## 21, 22, 23, 24, 25, 26, 27, 28, 29, 30, 31, 32, 33, 34, 35, 36, 37, 38,
## 39.
##
## Done.
plot(envelope_K, main = "Permutation envelopes of the K-cross function")
K = Kcross(pp_lung, i = "CD19+ B-cell", j = "CD14+ cell", correction = "isotropic")
lines(K$r, K$theo, lty = 2, col = "blue")summary(envelope_K)## Pointwise critical envelopes for "K"["CD19+ B-cell", "CD14+ cell"](r)
## and observed value for 'Y'
## Obtained from 39 evaluations of user-supplied expression
## Alternative: two.sided
## Upper envelope: pointwise maximum of simulated curves
## Lower envelope: pointwise minimum of simulated curves
## Significance level of Monte Carlo test: 2/40 = 0.05
## Data: Y
