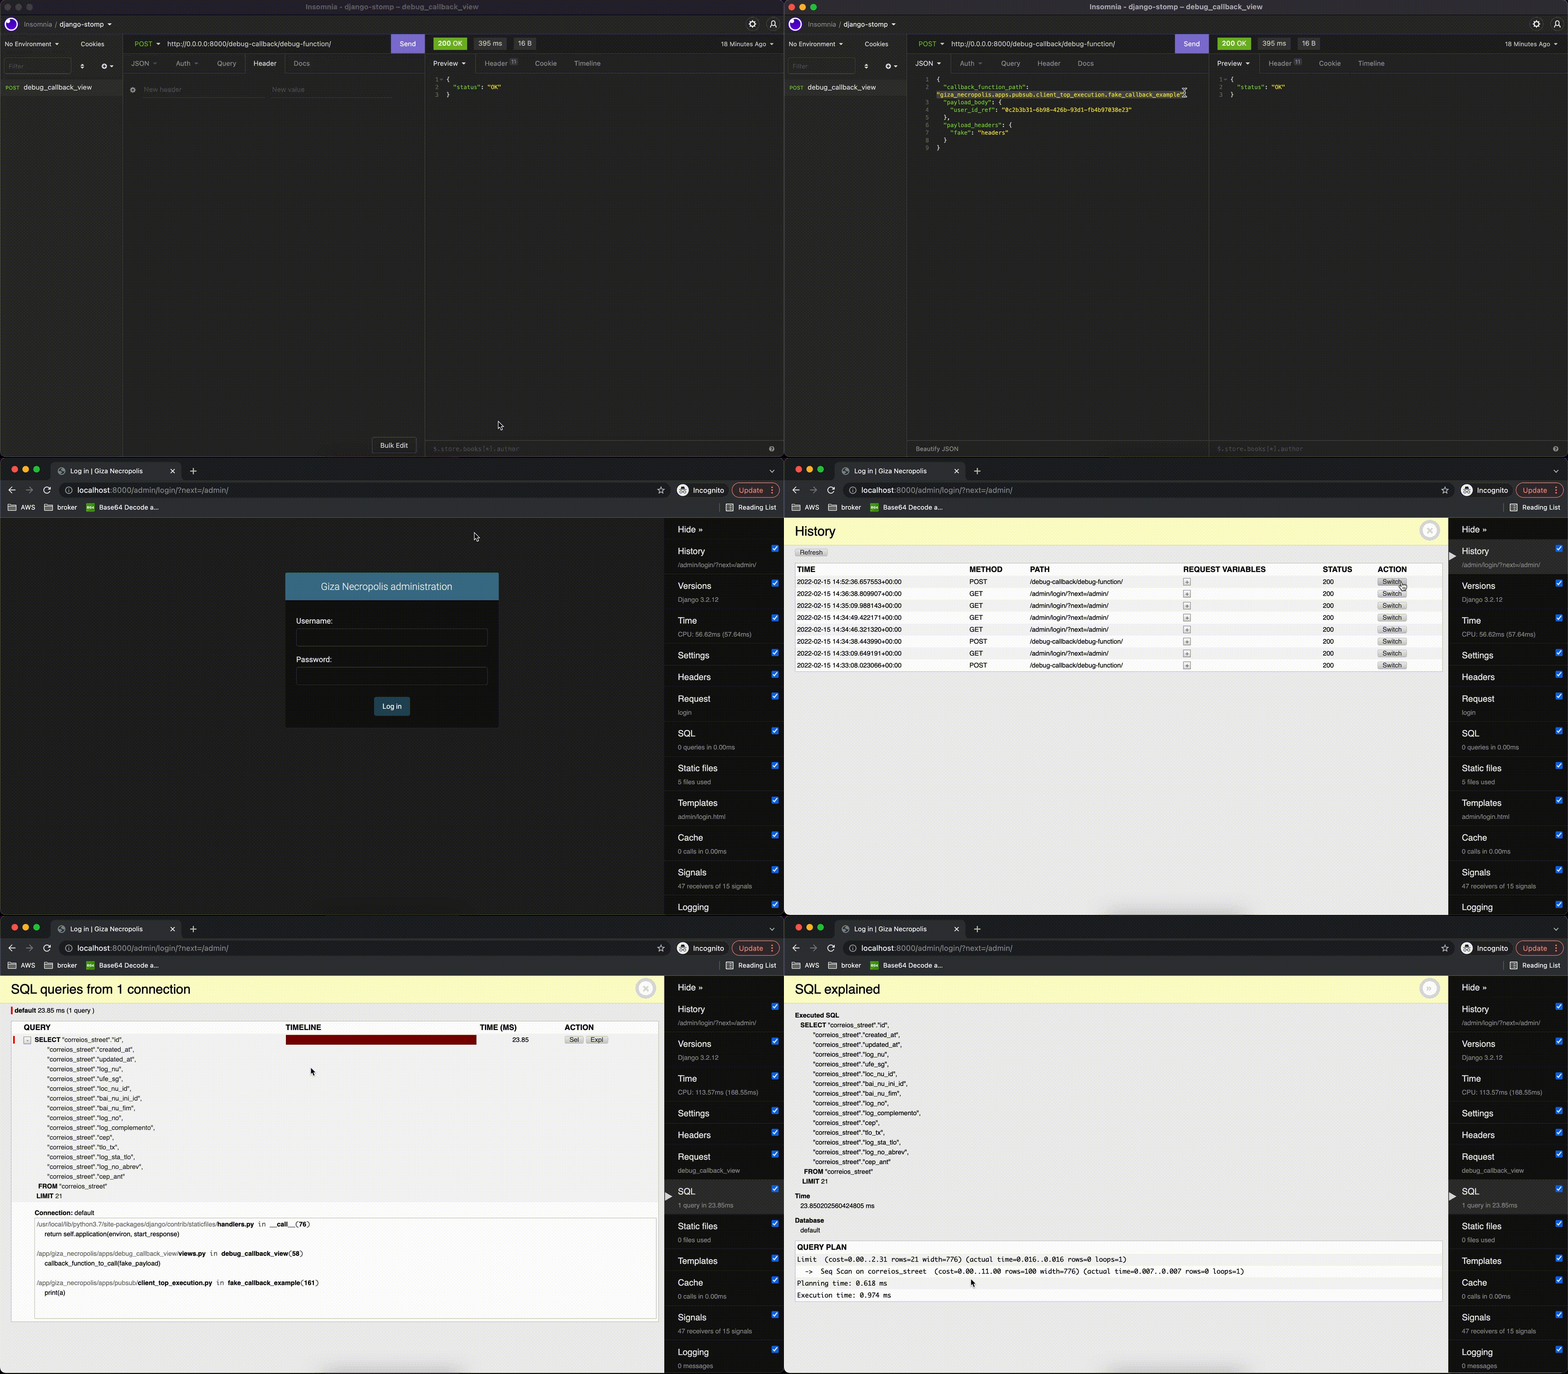
This functionality helps you comprehend and enhance your callback code used with the Django STOMP library.
As this project uses a view to call your callback function, it's possible to extract quite essential data that you can use to optimize your implementation.
See an example of this approach in action thanks to Django Debug Toolbar:
pip install django-stomp-debug-callback
Basically the configuration is simple, just insert the django_stomp_debug_callback on INSTALLED_APPS and
in your application's urls code include the debug callback view route.
from django.conf import settings
if settings.DEBUG:
    urlpatterns += [
        path("debug-callback/", include("django_stomp_debug_callback.urls")), # django stomp callback urls
]- Check if
django-stompstay intoINSTALLED_APPS
This route is a simple POST type route that expects to receive some parameters to trigger the callback function.
body parameter:
callback_function_path: The path to callback function to be calledpayload_body: payload body to be sent to de callback functionpayload_headers: headers to be sent to de callback function
curl example
curl --request POST \
  --url http://0.0.0.0:8000/debug-callback/debug-function/ \
  --data '{
	"callback_function_path": "path.to.the.callback.function",
	"payload_body": {
		"fake": "body"
	},
	"payload_headers": {
		"fake": "headers"
	}
}'
Configuration for the django-debug-toolbar here.
- The first step is install de django-debug-toolbar in your app
pip install django-debug-toolbar- The second step is to configure the urls (Recommended only insert this rule id
DEBUGisTrue)
from django.conf import settings
if settings.DEBUG:
    urlpatterns += [
        path("debug-callback/", include("django_stomp_debug_callback.urls")), # django stomp callback urls
        path("debug-toolbar/", include("debug_toolbar.urls")) # django debug toolbar
]- The third step is to check the settings, these settings will include the middleware and debug apps to main settings
in your .env
##################
#### DEBUG LIB CONFIGURATION
DEBUG_APPS = debug_toolbar,django_stomp_debug_callback
DEBUG_MIDDLEWARE = debug_toolbar.middleware.DebugToolbarMiddleware
in your setting
import os
DEBUG = True # only to developer mode never in production app
# DEBUG CONFIGURATION
if DEBUG:
    DEBUG_TOOLBAR_CONFIG = {"SHOW_TOOLBAR_CALLBACK": (lambda request: True)}
    INTERNAL_IPS = ["0.0.0.0"]

    DEBUG_APPS = os.getenv("DEBUG_APPS")
    if DEBUG_APPS:
        INSTALLED_APPS += DEBUG_APPS.split(",")

    DEBUG_MIDDLEWARE = os.getenv("DEBUG_MIDDLEWARE")
    if DEBUG_MIDDLEWARE:
        MIDDLEWARE += DEBUG_MIDDLEWARE.split(",")
Now you can see the debug panel in your admin url (localhost:8000/admin) and you can choose the route you want to see the requests to the bank in a given view with timing details and explain options and see the most problematic query of your stream.
You can run the tests with docker
docker-compose up testsOr using tox
pipenv run toxThe use of .pre-commit-config.yaml flake8, black, isort and pylint.
You can run the .pre-commit-config.yaml with docker
docker-compose up lint-formatterOr using pre-commit
pre-commit run --all-files

