Installation | Configuration | Resources Displayed | Contributing
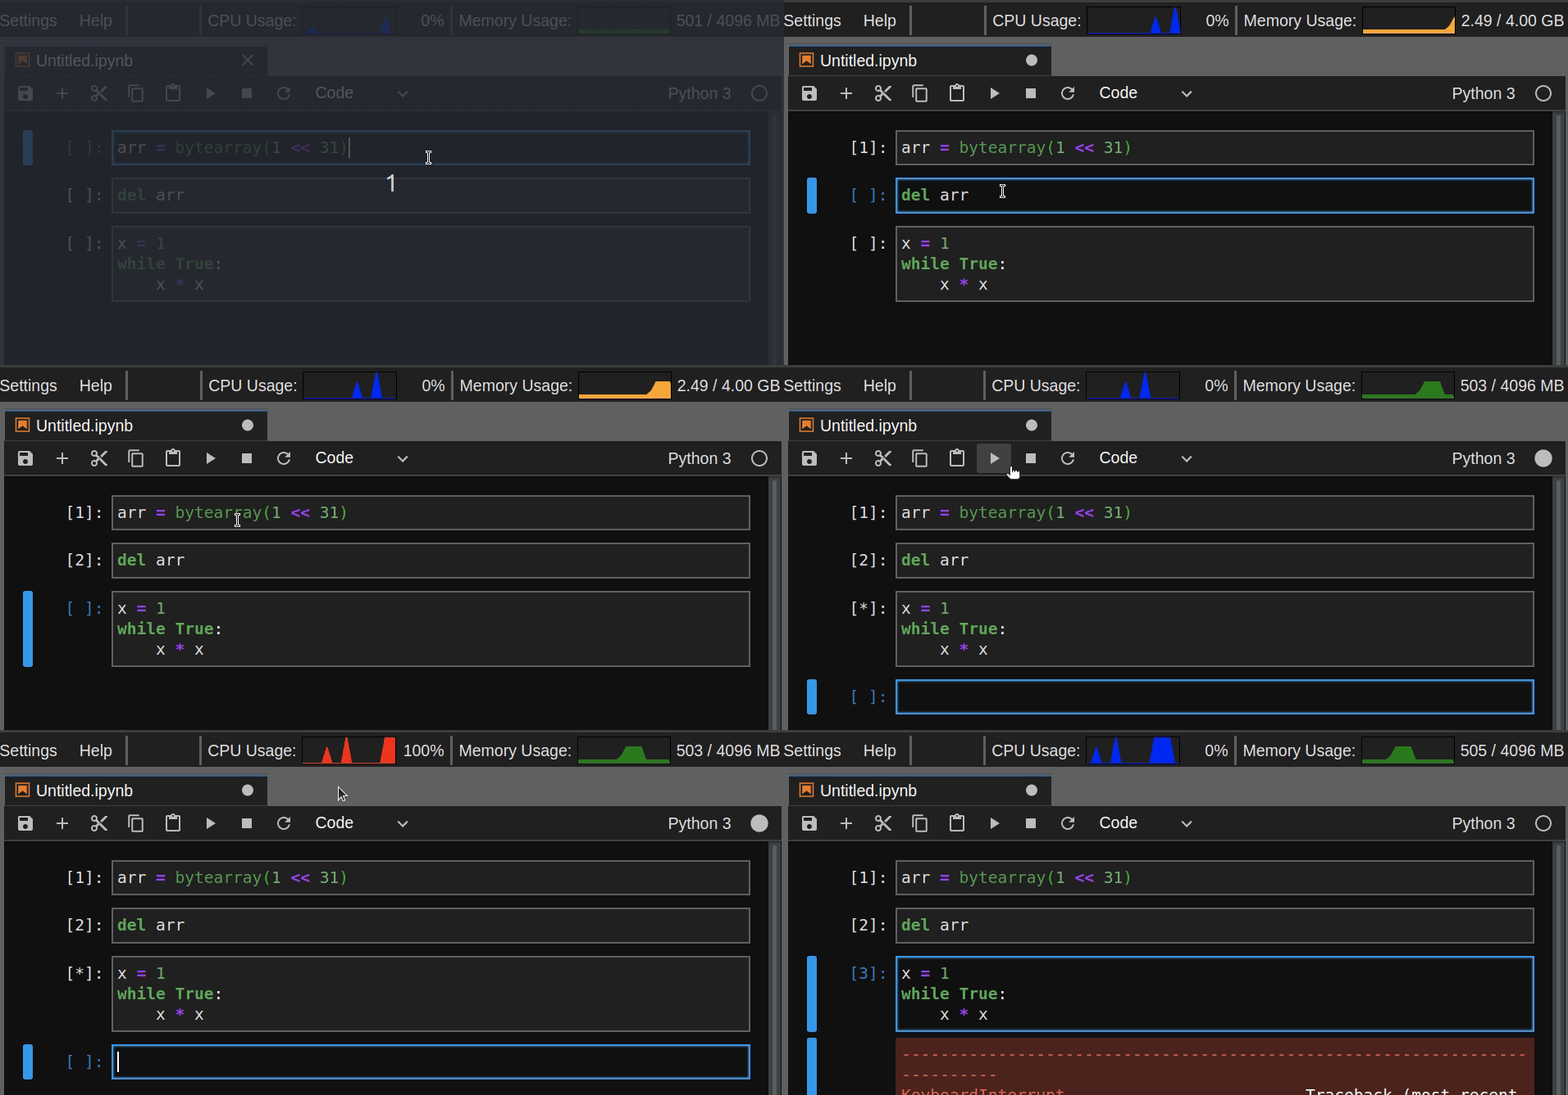
Jupyter Resource Usage is an extension for Jupyter Notebooks and JupyterLab that displays an indication of how much resources your current notebook server and its children (kernels, terminals, etc) are using. This is displayed in the status bar in the JupyterLab and notebook, refreshing every 5s.
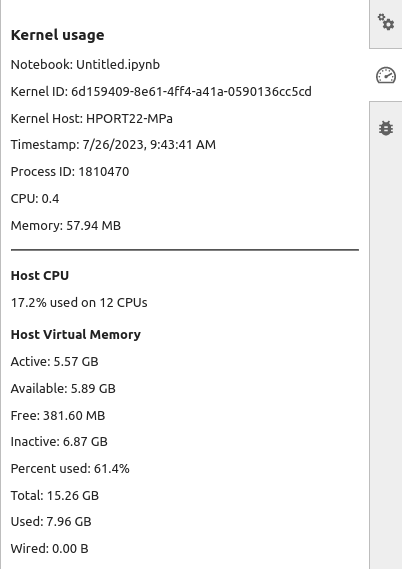
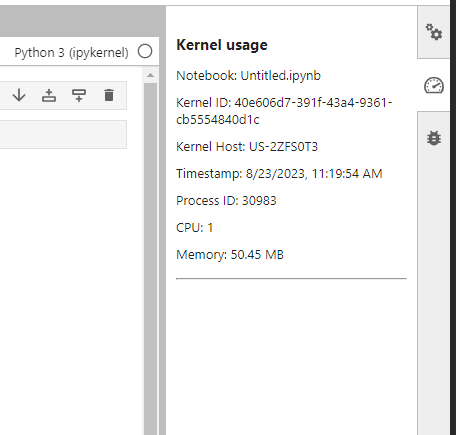
Kernel resource usage can be displayed in a sidebar for IPython kernels with ipykernel >= 6.11.0.
The kernel usage is available for Notebook 7.x too which can be enabled at
View -> Right Sidebar -> Show Kernel Usage. In the case of JupyterLab interface, it is
enough to click tachometer icon on the right sidebar.
The package provides an alternative frontend for the jupyter-resource-usage metrics:
Previously, this extension used to be distributed with
jupyterlab-system-monitor package.
Starting from 1.0.0, the alternative frontend has been integrated into the
current repository. Check Alternative frontend section
on how to enable and configure this alternative frontend.
Note that for JupyterLab 3.x and 2.x, users should install the alternative frontend from jupyterlab-system-monitor.
You should install the latest version >=1.0.0 for JupyterLab 4 compatability.
pip install jupyter-resource-usageOr with conda:
conda install -c conda-forge jupyter-resource-usageYou should pin the versions to <1.0.0
pip install 'jupyter-resource-usage<1.0.0'Or with conda:
conda install -c conda-forge 'jupyter-resource-usage<1.0.0'If your notebook version is < 5.3, you need to enable the extension manually.
jupyter serverextension enable --py jupyter_resource_usage --sys-prefix
jupyter nbextension install --py jupyter_resource_usage --sys-prefix
jupyter nbextension enable --py jupyter_resource_usage --sys-prefix
jupyter-resource-usage can display a memory limit (but not enforce it). You can set this
in several ways:
MEM_LIMITenvironment variable. This is set by JupyterHub if using a spawner that supports it.- In the commandline when starting
jupyter notebook, as--ResourceUseDisplay.mem_limit. - In your Jupyter notebook traitlets config file
The limit needs to be set as an integer in Bytes.
The background of the resource display can be changed to red when the user is near a memory limit. The threshold for this warning can be configured as a fraction of the memory limit.
If you want to flash the warning to the user when they are within 10% of the memory limit, you
can set the parameter --ResourceUseDisplay.mem_warning_threshold=0.1.
If you want to hide host information from the Kernel Usage sidebar
you can set --ResourceUseDisplay.show_host_usage=False to hide Host CPU and Host Virtual Memory information.
The default is set as True, i.e. show all the information.
jupyter-resource-usage can also track CPU usage and report a cpu_percent value as part of the /api/metrics/v1 response.
You can set the cpu_limit in several ways:
CPU_LIMITenvironment variable. This is set by JupyterHub if using a spawner that supports it.- In the command line when starting
jupyter notebook, as--ResourceUseDisplay.cpu_limit. - In your Jupyter notebook traitlets config file
The limit corresponds to the number of cpus the user has access to, but does not enforce it.
Additionally, you can set the track_cpu_percent trait to enable CPU usage tracking (disabled by default):
c = get_config()
c.ResourceUseDisplay.track_cpu_percent = True
As a command line argument:
jupyter notebook --ResourceUseDisplay.track_cpu_percent=TrueWhen track_cpu_percent is set to True, status will report CPU utilisation along with
memory:
jupyter-resource-usage can also track disk usage [of a defined partition] and report the total and used values as part of the /api/metrics/v1 response.
You enable tracking by setting the track_disk_usage trait (disabled by default):
c = get_config()
c.ResourceUseDisplay.track_disk_usage = True
The values are from the partition containing the folder in the trait disk_path (which defaults to /home/jovyan). If this path does not exist, disk usage information is omitted from the display.
Mirroring CPU and Memory, the trait disk_warning_threshold signifies when to flag a usage warning, and like the others, it defaults to 0.1 (10% remaining)
There is a known bug with Prometheus metrics which causes "lag"/pauses in the UI. To workaround this you can disable Prometheus metric reporting using:
--ResourceUseDisplay.enable_prometheus_metrics=False
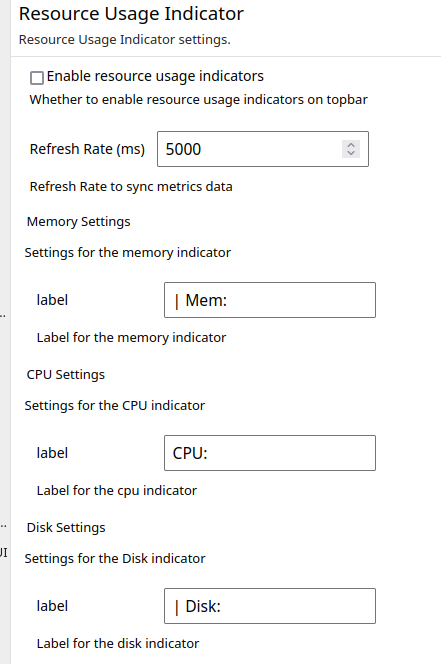
By default, the alternative frontend is disabled. To enable it, users should go to
Settings -> Settings Editor -> Resource Usage Indicator which will render following
form
By checking "Enable resource usage indicators" and refreshing the browser tab will render the alternative frontend in the topbar.
Users can change the label and refresh rate for the alternative frontend using settings editor.
(The vertical bars are included by default, to help separate the three indicators.)
Currently the server extension reports disk usage, memory usage and CPU usage. Other metrics will be added in the future as needed.
Memory usage will show the PSS whenever possible (Linux only feature), and default to RSS otherwise.
The notebook extension currently doesn't show CPU usage, only memory usage.
If you would like to contribute to the project, please read the CONTRIBUTING.md. The CONTRIBUTING.md file
explains how to set up a development installation and how to run the test suite.


