A fork of textplot-rs that allows you to customize the display of your labels for any T, U
This works by operating over Point<T,U> where T/U implement Display, Into, From, Clone
Additionally, this now assumes that each line is associated with a PixelColor to help add detail and visually separate out each plotted line.
A terminal plotting library for using in Rust CLI applications. This should work well in any unicode terminal with monospaced font.
It is inspired by textplot which is inspired from TextPlots.jl which is inspired by Drawille.
Currently it features only drawing line charts on Braille canvas, adding labels to the bottom of charts, coloring lines, and adding axis labels through the display trait. It could be extended to support other canvas and chart types just like UnicodePlots.jl or another cool terminal plotting library.
Contributions are very much welcome!
use pointplotss::{Chart, Plot, Shape};
fn main() {
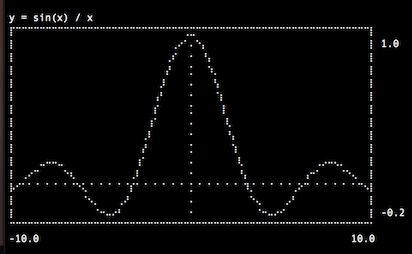
println!("y = sin(x) / x");
Chart::default()
.lineplot(&Shape::Continuous(Box::new(|x| x.sin() / x)))
.display();
}
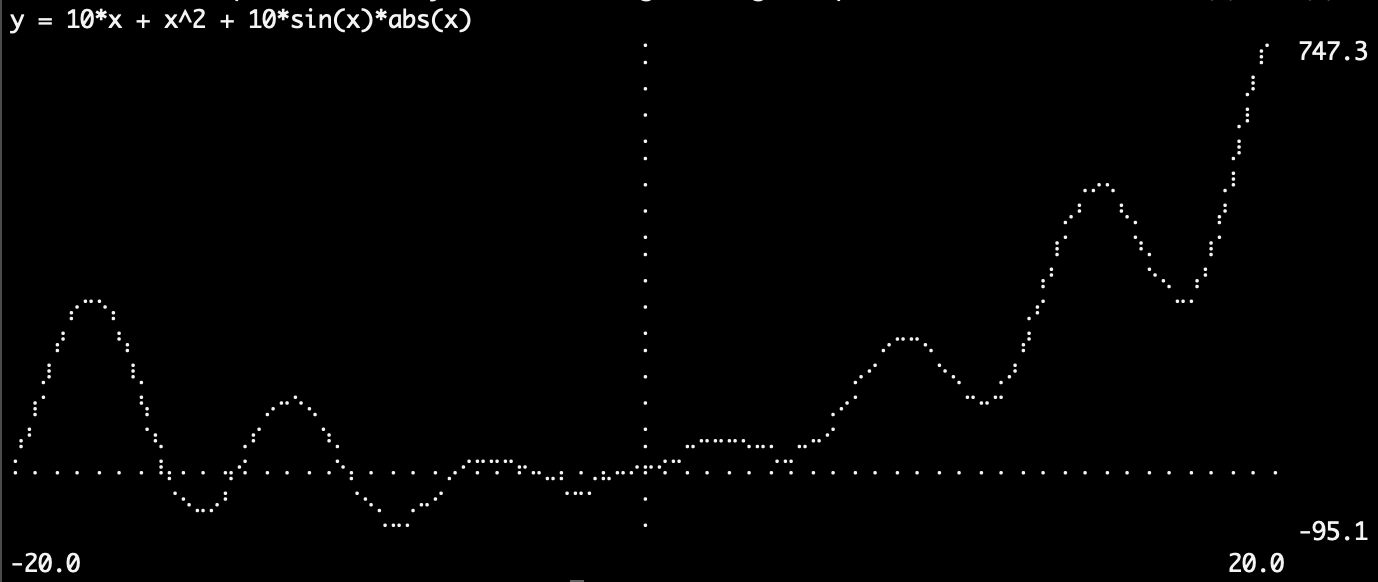
$ pointplots '10*x + x^2 + 10*sin(x)*abs(x)' --xmin=-20 --xmax=20