Chartesian is a web application for users to build charts using uploaded data sources. Inspired by Chartio, Chartesian allows users to upload their own data sources and create charts.
Chartesian is a personal project by Justin Suen.
- Hosting on Heroku
- New account creation and login
- Guest/demo account
- Upload data and visualize it with a variety of charts
- Logged in users can persist their data
- Supports JSON, TSV, and CSV formats
When visited, a simple, minimal splash page is displayed along with a sample chart of the site's capabilities.
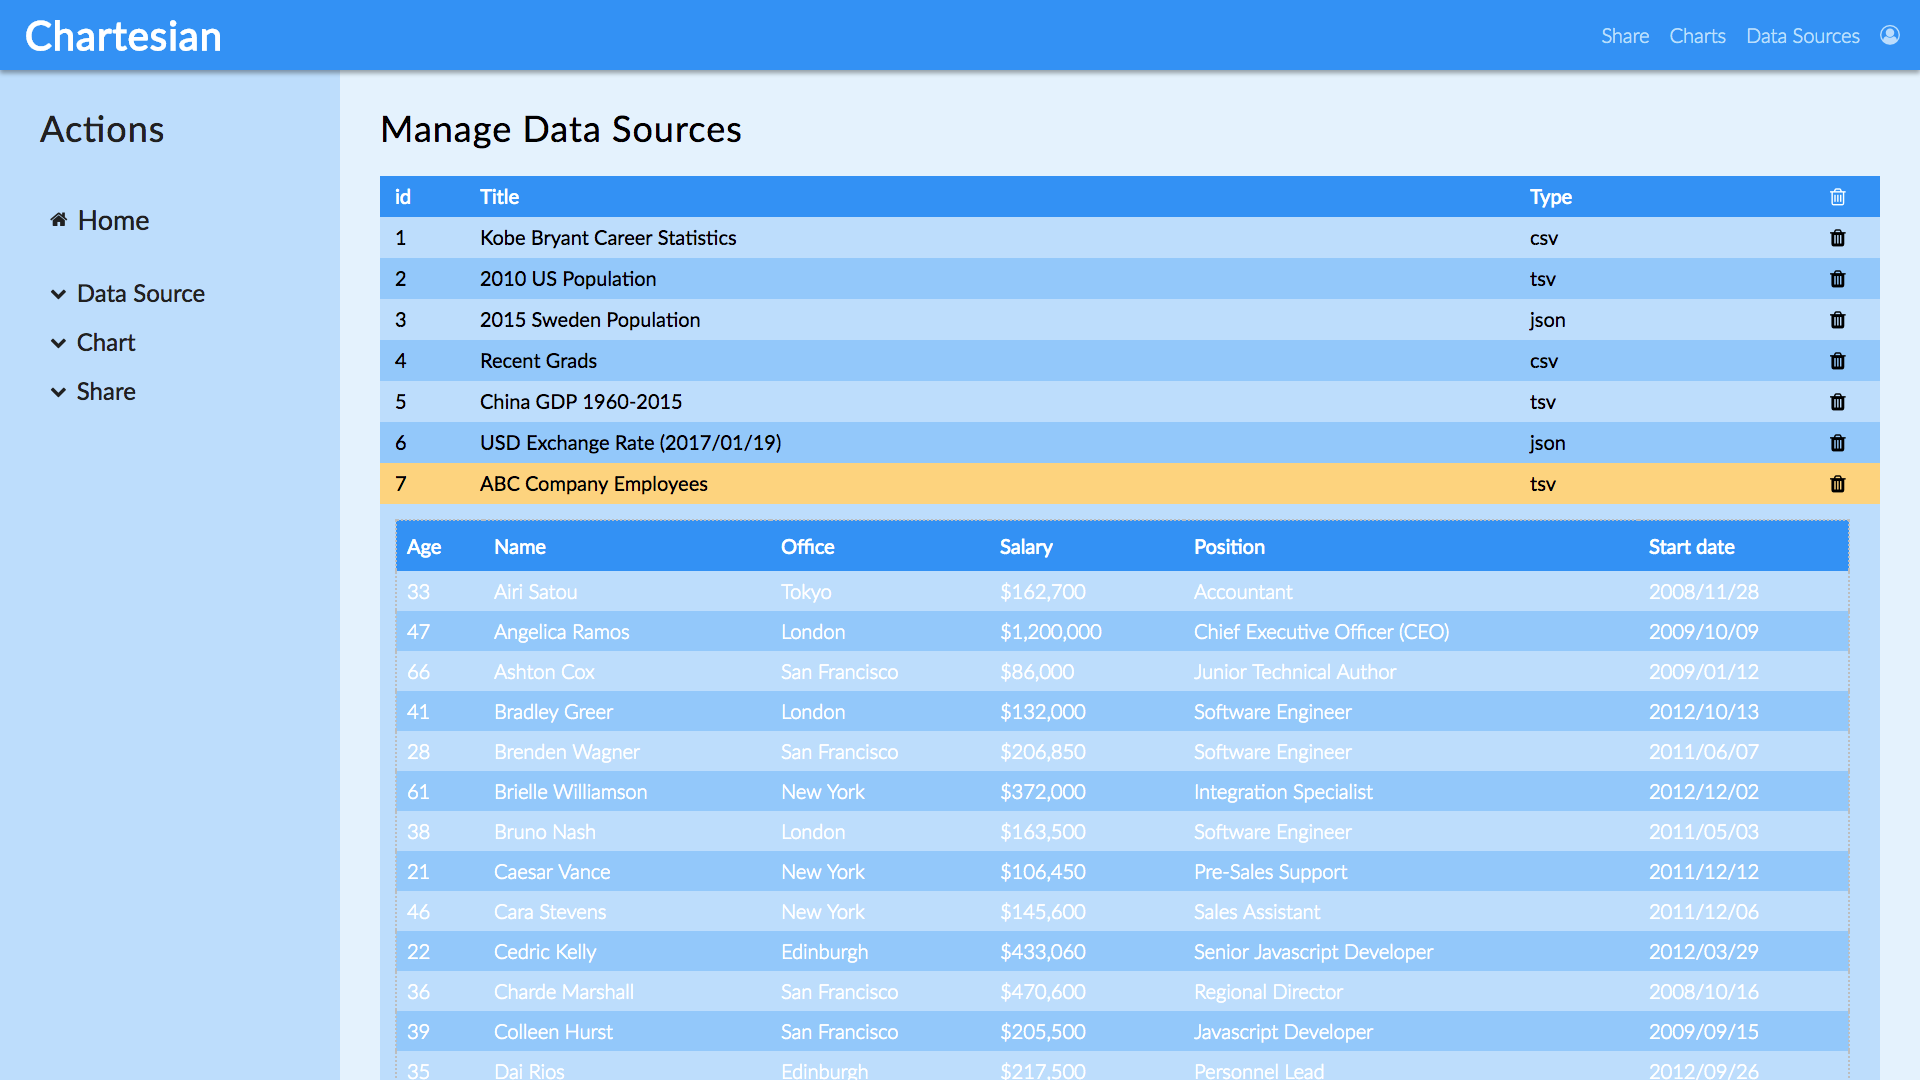
After signing in or using one of 50 independent demo accounts, the user is greeted with their list of uploaded data sources.
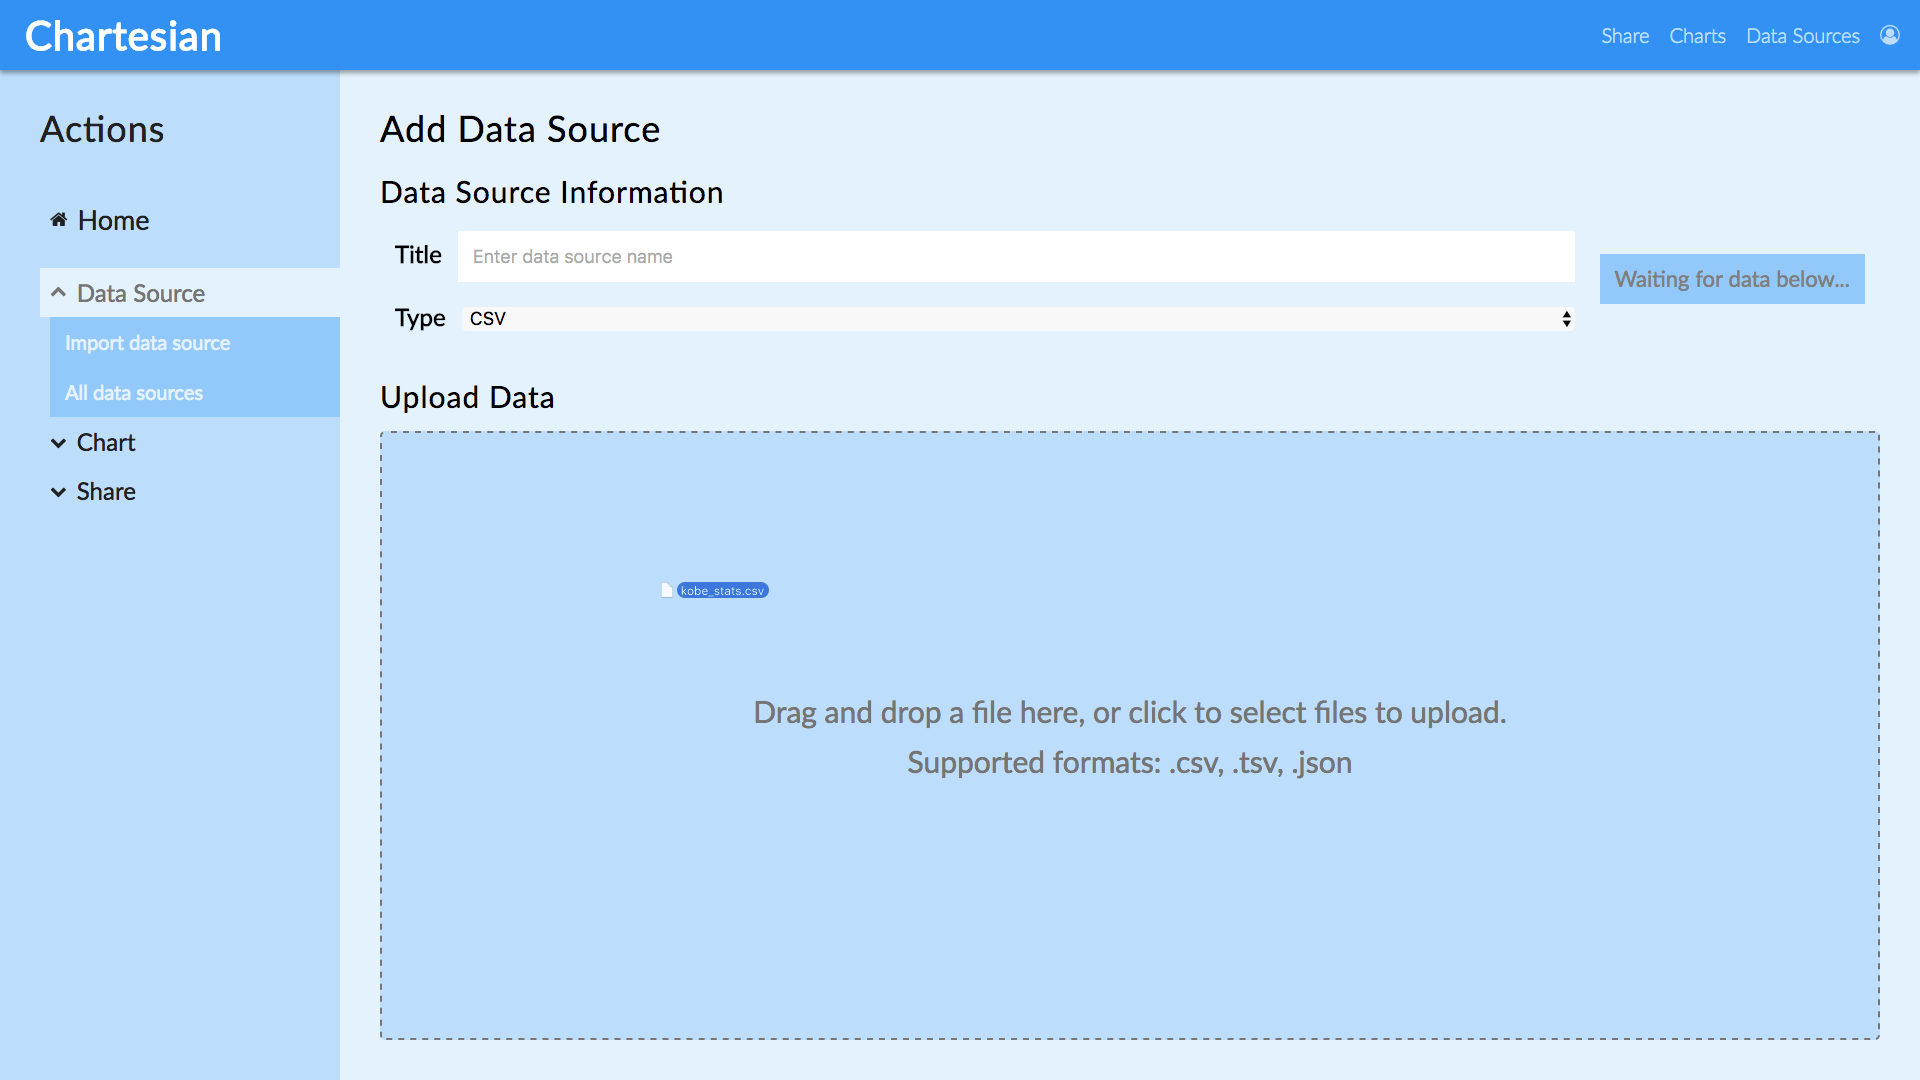
To preview, a user can click on the individual rows to retrieve the desired table. To upload, the user can navigate using the sidebar. The upload page supports JSON, CSV, and TSV files through selecting or drag and drop.
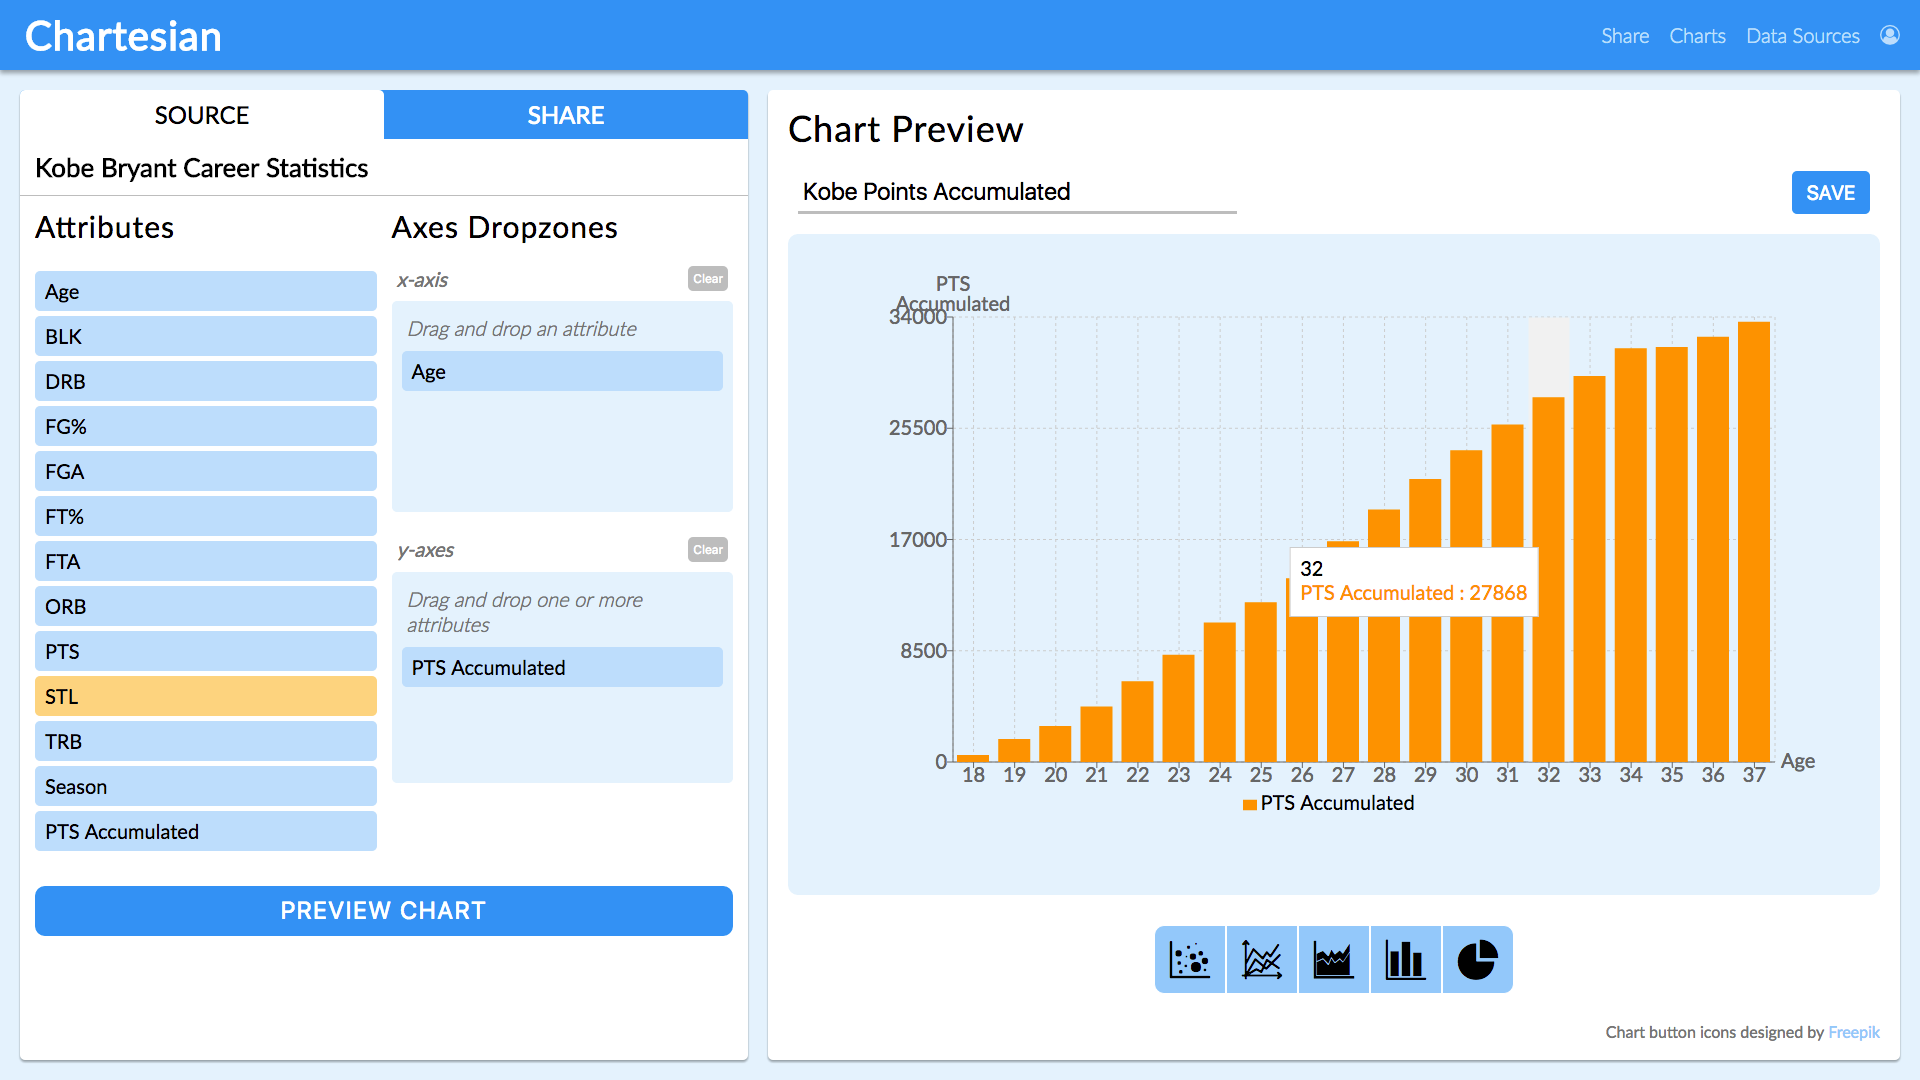
To build charts, navigate to the create chart page. From here, users can select a source to use using the dropdown menu. The attributes will be loaded once the user selects a source. Then, users can drag and drop their desired attributes to the drop zones. After pressing preview chart, the chart will be created using those axes. Chart types can be selected using the intuitive icons on the bottom.
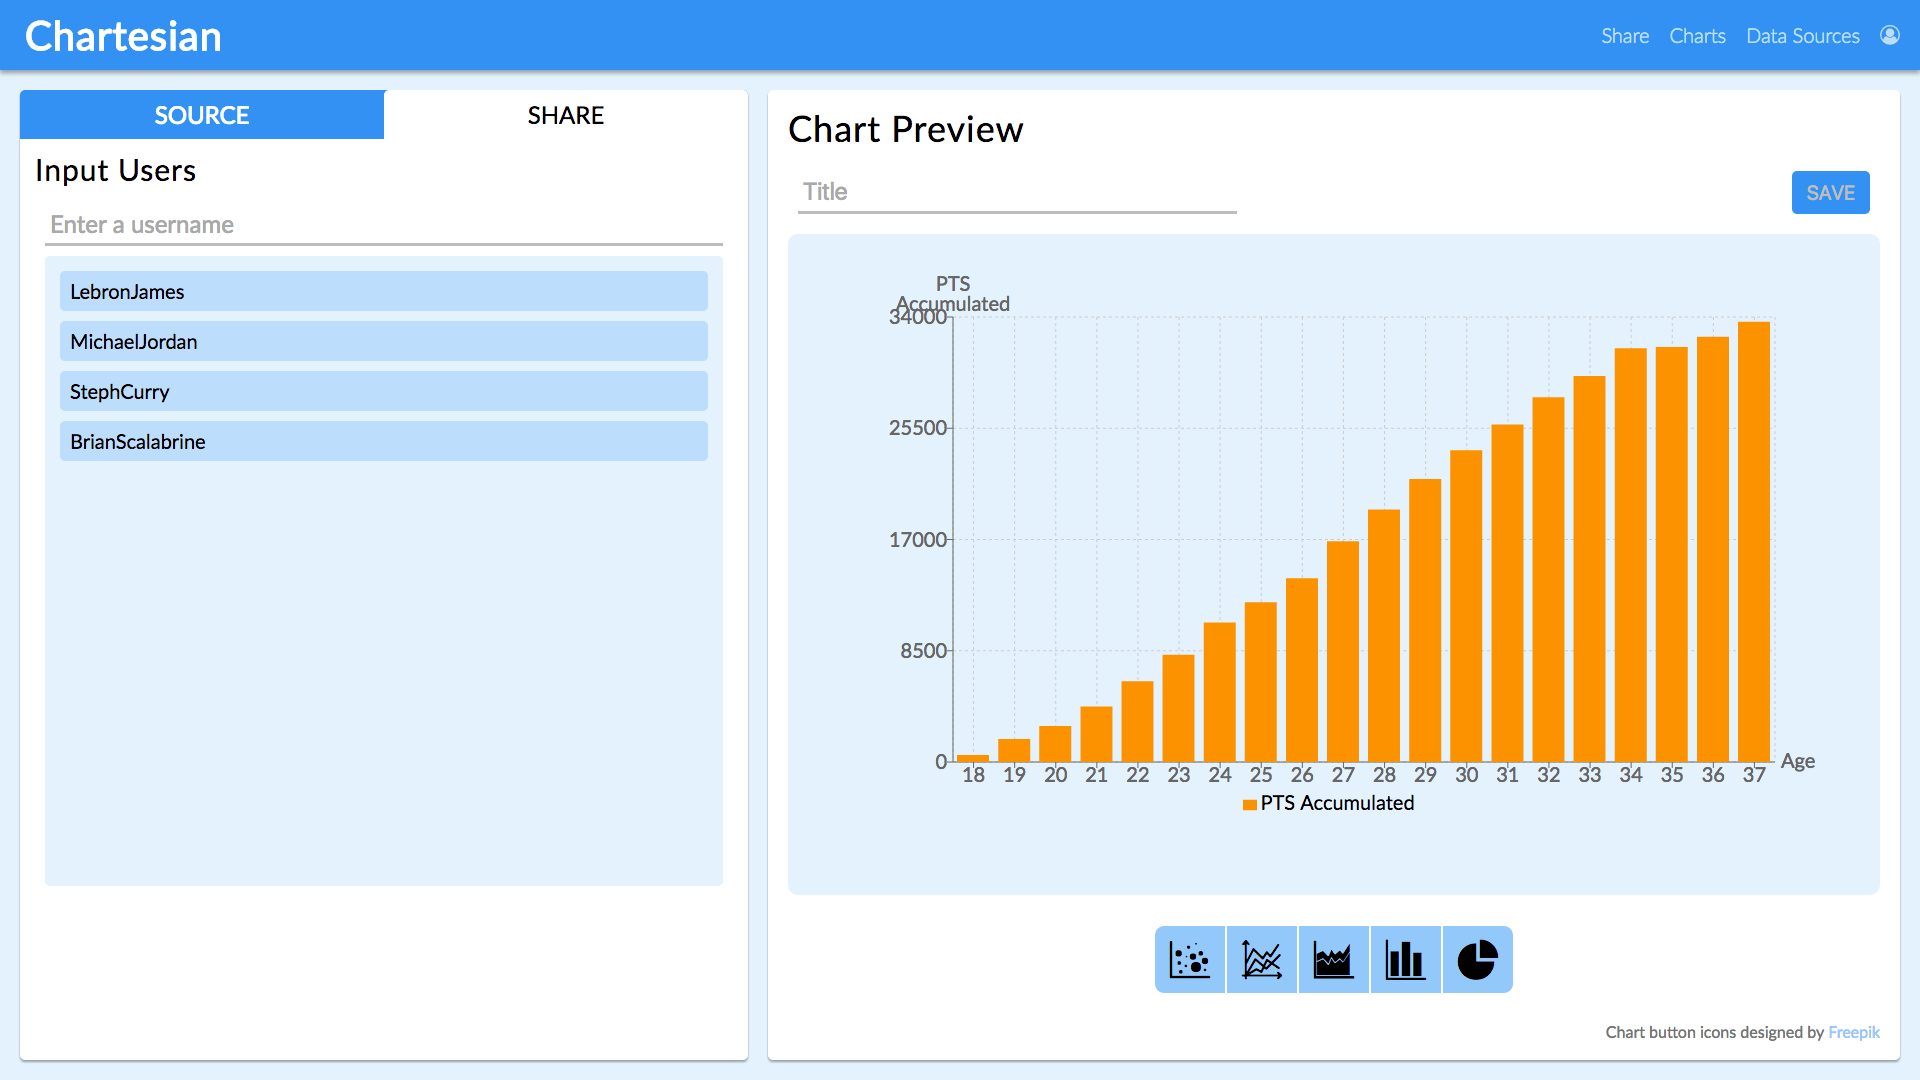
If the user desires, he/she can share the chart with other users by entering their usernames. Once shared, the other users will have viewing privileges to the chart created.
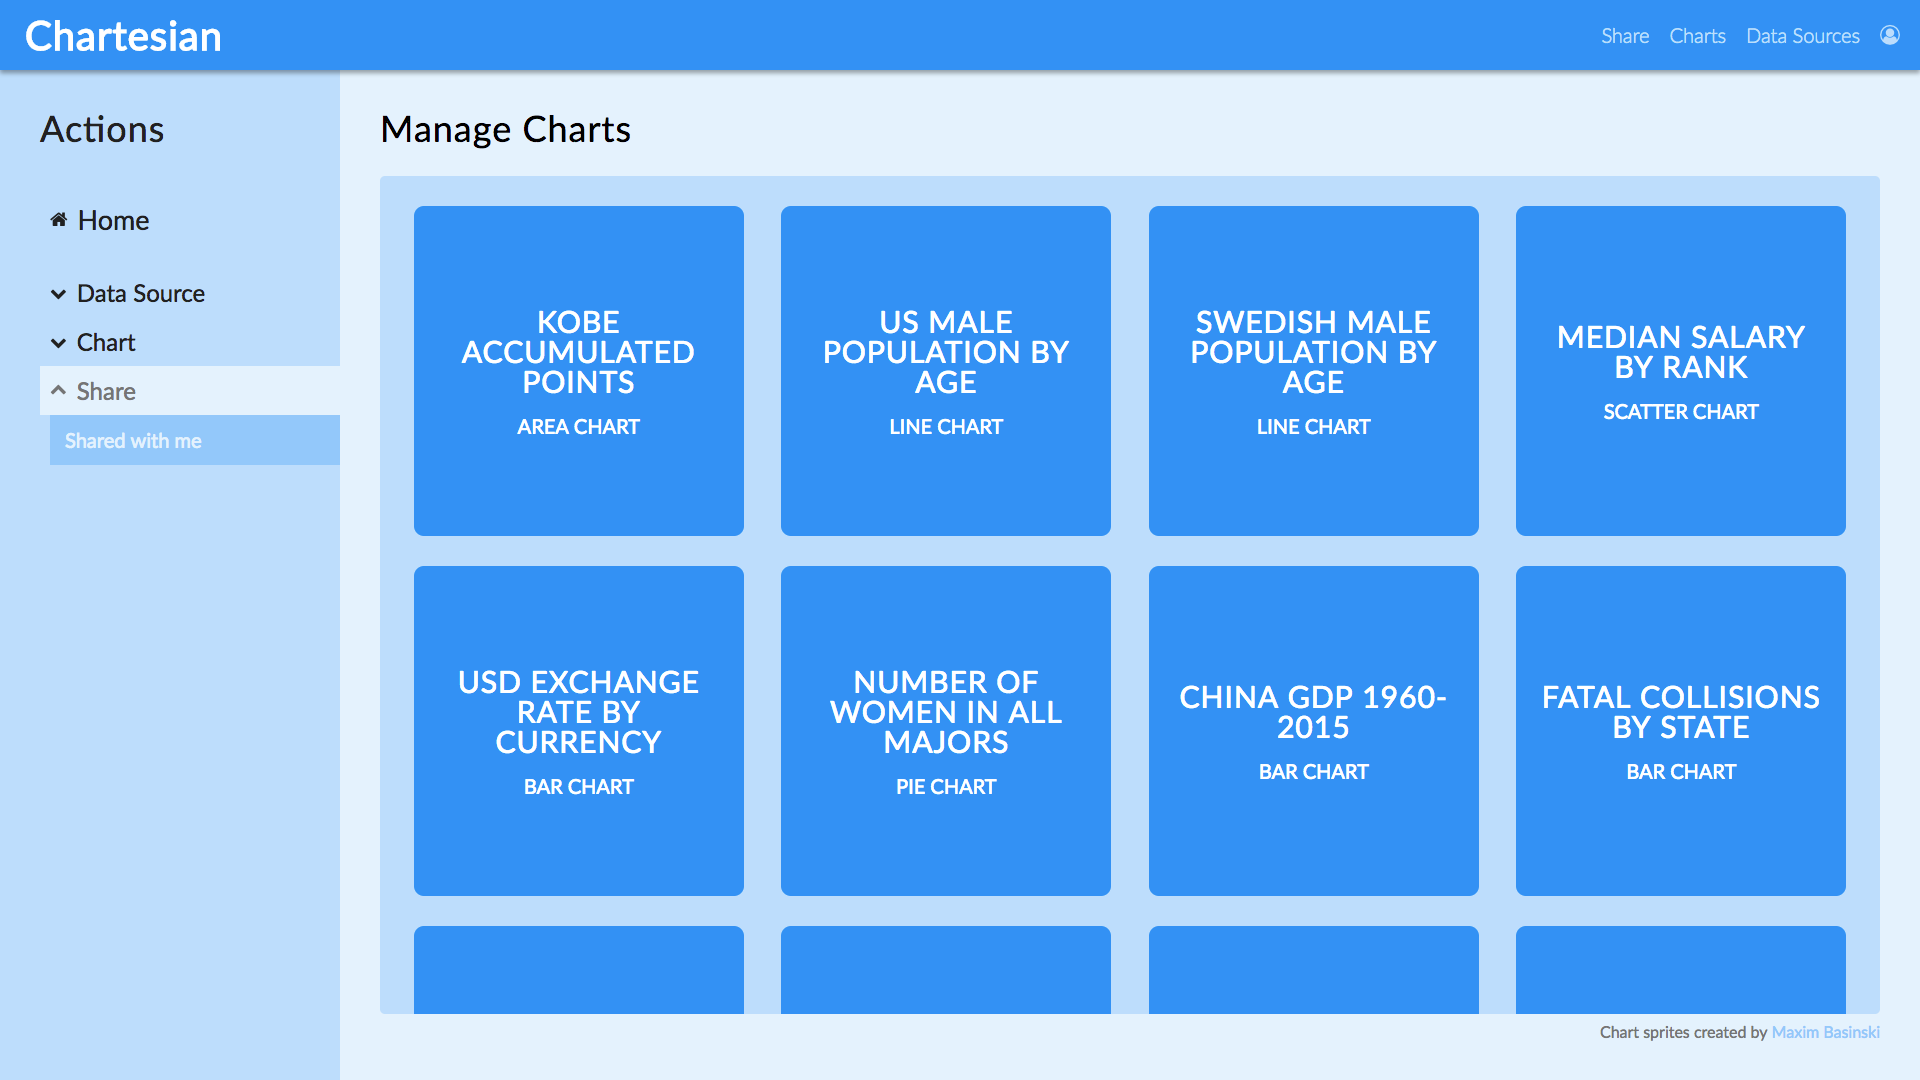
After saving, the user will be redirected to the manage charts page. This is also where the user would view all created charts. To view charts shared with them, the user can navigate to the Shared with Me view in the sidebar.
Chartesian was designed and built in two weeks.
A proposal was drafted to help provide an implementation timeline during the development process.
A database schema was prepared alongside the design proposal.
Chartesian is a single-page application built on Rails and React.js, with many dependencies in both the backend and the frontend.
Here's a list of components and packages I used for this project.
- React DnD
- Recharts.js The charting library used is Recharts.js. It provides tooltip components for graphs along with responsive containers and axes.
- Superagent
- React Collapse
- React Dropzone
All notable changes will be documented in this section.
- Move from Recharts.js to D3.js for more customization
- Users cannot update shares or charts
- No way of finding shared assets
- Users cannot graph more than one y-axis
- v1.1 will be focused on chart sharing MVP
- Share charts with other users by username
- User authentication
- Upload data in multiple formats
- Create charts using uploaded data
- Host on Heroku
Currently, Chartesian supports data upload, charting using one x-axis and one y-axis, and chart sharing by username.
The features that will be added later can be found in this future readme.

