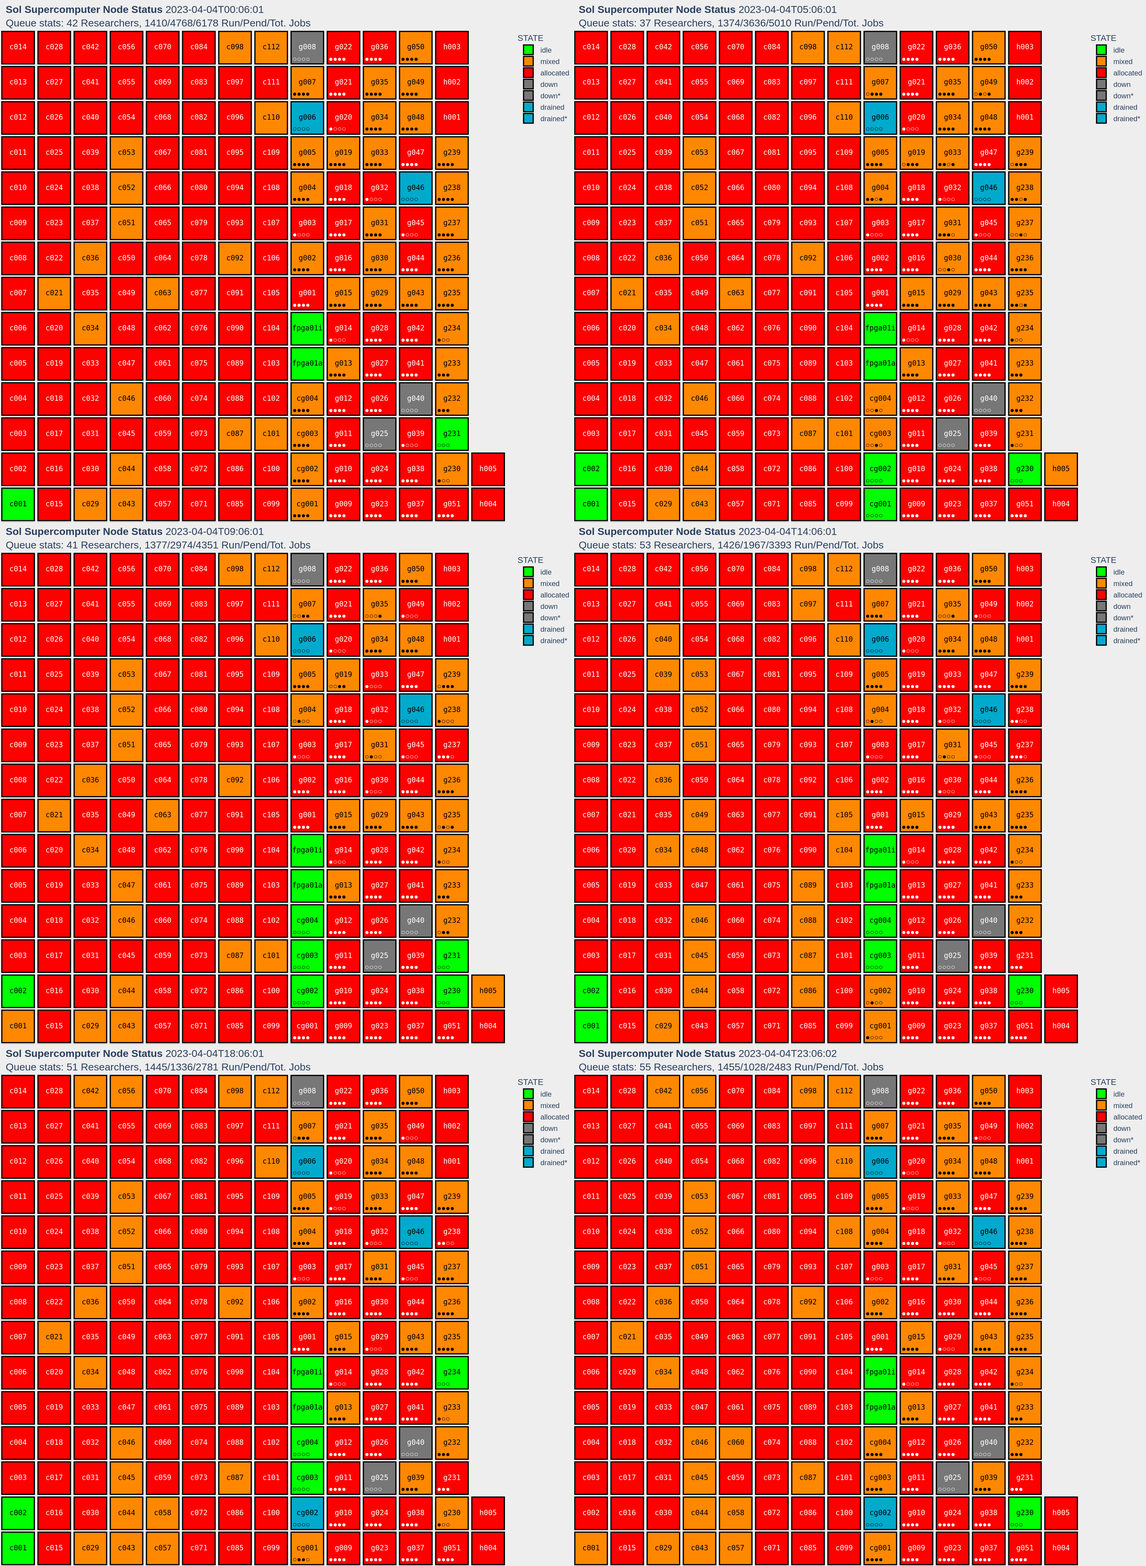
Scrapes SLURM via sinfo and plots node status with plotly. See the
rest of our public Sol stack and information about the Sol supercomputer
by visiting our official Sol github repository.
On Sol's admin.sol.rc.asu.edu, the user software runs the generating shell
and python scripts via crontab:
* * * * * /packages/public/sol-node-status/get-sol-node-status.sh &> /packages/public/sol-node-status/crontab.diag
Live on Open OnDemand page (Sol status, for ASU users); a demonstration (of a system snapshot) is available here, on my personal website.
A script to recreate the python environment with mamba/conda is
provided: python-env.sh. The status page really depends on pandas,
numpy, and plotly, but the general python environment for scientific
computing is provided.
Shell script will only save every tenth zstd -19 compressed comma-separated
value (csv) files (every ten minutes). This is determined by an incremented
counter that is stored in snapshot/.snapshot_modulo.do.not.delete. When there
are errors the zstd file will not be generated and csvs will not be
removed. This is to help determine what occurred in the data and catch
all edge cases.
The final html page is made available to the OOD nodes through Salt symbolically linking the html file:
admin:/srv/salt/sol/states/cluster/ood/apps/status/status.sls
    /packages/public/sol-node-status/sol.html ->
    ood*:/var/www/ood/public
and provisioning the content as shown in the provisioning/ directory.
The main change to the status application was to include the status html
page as an iframe (with an associated legend).
Diagnose issues from diagnostics file generated by cron:
/packages/public/sol-node-status/crontab.diag
and from Python runtime:
/packages/public/sol-node-status/crontab.diag.log
Note: crontab.diag is non-empty upon successful execution with normal
diagnostic statistics on the plotly figure, i.e.,
len :: total number of nodes being visualized
  M :: number of nodes in figure's horizontal direction
  N :: number of nodes in figure's vertical direction
  w :: figure width in pixels
  h :: figure height in pixels
- Implement via JS in kibana.
- Automate monthly archiving of snapshot data.
| Version | Date | Notes |
|---|---|---|
| CURRENT | 2024-03-18 | version 0.10.1 |
| 0.10.1 | 2024-03-18 | Added docstring to MIG-disk method |
| 0.10 | 2024-03-07 | GPU string creation fixed for multiple gpus on node |
| 0.9.1 | 2023-12-28 | Initialized stats array in bin/local-sq-stats |
| 0.9 | 2023-12-01 | Improved sinfo state support |
| 0.8 | 2023-05-01 | MIG support |
| 0.7 | 2023-02-03 | NHC support (escaping quotes in node status REASON) |
| 0.6 | 2023-01-15 | GRES socket info bug, due to new sinfo reporting |
| 0.5 | 2023-01-06 | GRES length bug fix (sinfo fields require spec. width) |
| 0.4 | 2022-11-23 | GPU Index bug fix |
| 0.3 | 2022-11-21 | Resized and queue summary statistics added |
| 0.2 | 2022-11-10 | GPU support |
| 0.1 | 2022-11-09 | Automated version available on rcstatus.asu.edu |
| 0.0 | 2022-11-03 | Proof of concept |

