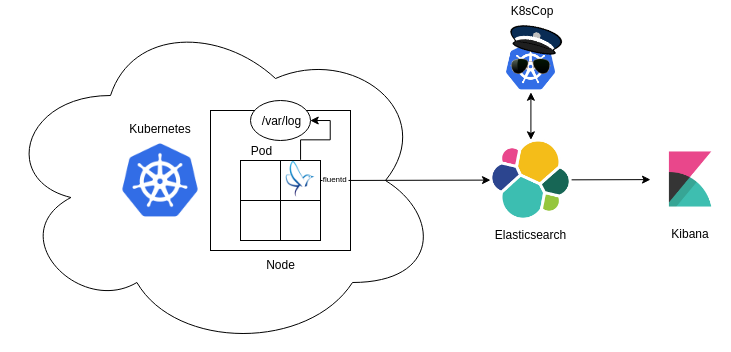
This guide assists in configuring a logging architecture for Kubernetes, meant to store and parse audit logs. After setting up the logging architecture, run K8sCop for static or streaming analysis, and import the security dashboard in Kibana to obtain full visibility over Kubernetes cluster activity.
- Make the
kube-apiserverstore audit logs - Set up Elasticsearch and Kibana outside or inside Kubernetes
- Deploy the Fluent daemon to push logs to Elasticsearch
- Run K8sCop for static or streaming analysis of logs and labelling of events
- Import and view the Security Dashboard in Kibana
The kube-apiserver has the possiblity to keep and store audit logs. By adding the following arguments to the /etc/kubernetes/manifests/kube-apiserver.yaml file:
containers:
  - command:
    - kube-apiserver
    [arguments]
    - --audit-policy-file=/etc/kubernetes/policies/adv-audit.yaml
    - --audit-log-path=/var/log/kubernetes/kube-apiserver-audit.log
    - --audit-log-format=json
    [arguments]
  volumeMounts:
   [options]
    - mountPath: /etc/kubernetes/policies
      name: policies
      readOnly: true
    - mountPath: /var/log/kubernetes
[options]
 - hostPath:
   path: /etc/kubernetes/policies
   type: DirectoryOrCreate
  name: policies
- hostPath:
   path: /var/log/kubernetes
   type: DirectoryOrCreate
  name: var-log-kubernetes
An example configuration file can be found here. Create the policies directory in /etc/kubernetes and copy this yaml file to the newly created directory.
Follow this very nice and detailed guide on DigitalOcean.
Create the mount directory for the fluent configuration:
# mkdir -p /var/share/volumes/fluent/etcAdd the files from the configs/fluent folder:
# cp entrypoint.sh Gemfile /var/share/volumes/fluent/.
# cp fluent.conf /var/share/volumes/fluent/etc/.
Change the environment variables to connect to the installed elasticsearch installation:
     - name: fluentd
        image: fluent/fluentd-kubernetes-daemonset:v1.1-debian-elasticsearch
        env:
          - name:  FLUENT_ELASTICSEARCH_HOST
            value: "192.168.178.65"
          - name:  FLUENT_ELASTICSEARCH_PORT
            value: "9200"
          - name: FLUENT_ELASTICSEARCH_SCHEME
            value: "http"
          - name: FLUENT_UID
            value: "0"
          - name: FLUENT_ELASTICSEARCH_USER # even if not used they are necessary
            value: "foo"
          - name: FLUENT_ELASTICSEARCH_PASSWORD # even if not used they are necessary
            value: "bar"
resources:Apply the yaml configuration file:
$ kubectl apply -f fluentd-setup.ymlThere should be a kube-logging namespace, containing a volume (claim), a fluent pod and service account.
To check the progress or to debug error messages, run the following command:
$ kubectl --namespace kube-logging logs fluent-[identifier] init-fluentd -fThis will stream the init containers' stdout/stderr while installing the required gems.
Omit init-fluentd to stream the logs of the actual container.
K8sCop specifics are described here.
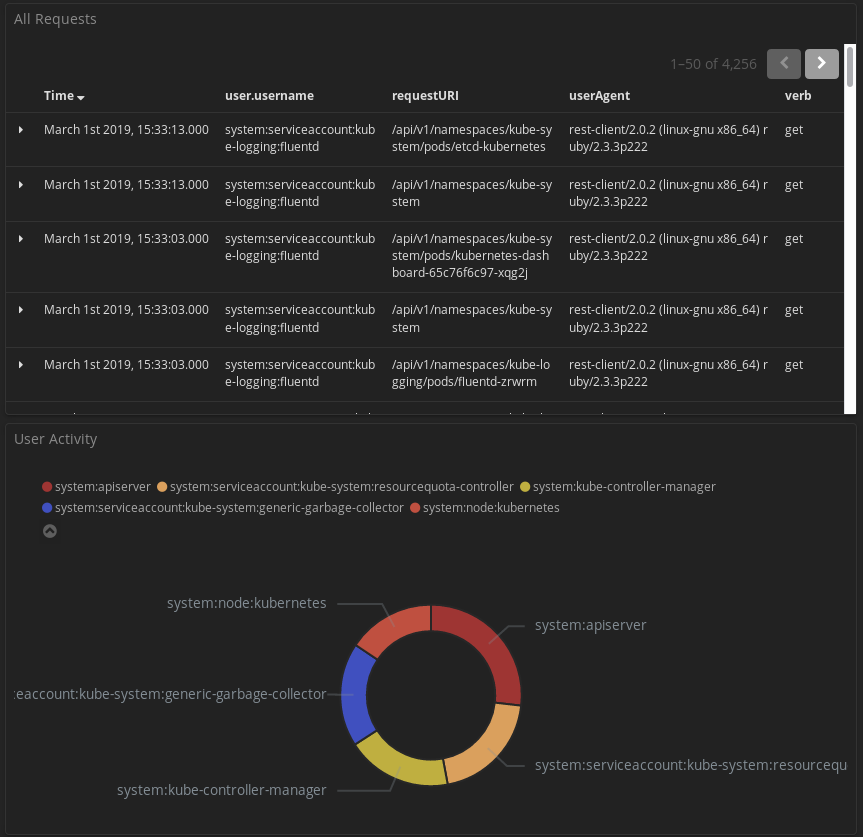
An overview of all requests made inside Kubernetes and a pie chart of user activity, computer by requests per user.
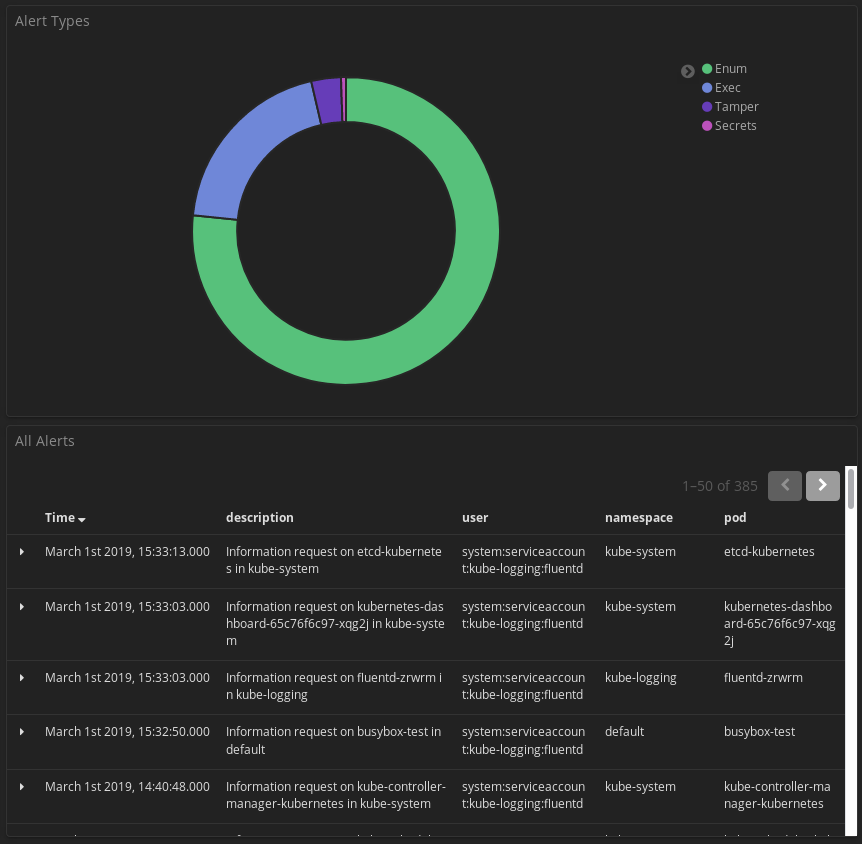
A pie chart of the different types of alerts and an overview of the latest alerts made by K8sCop.
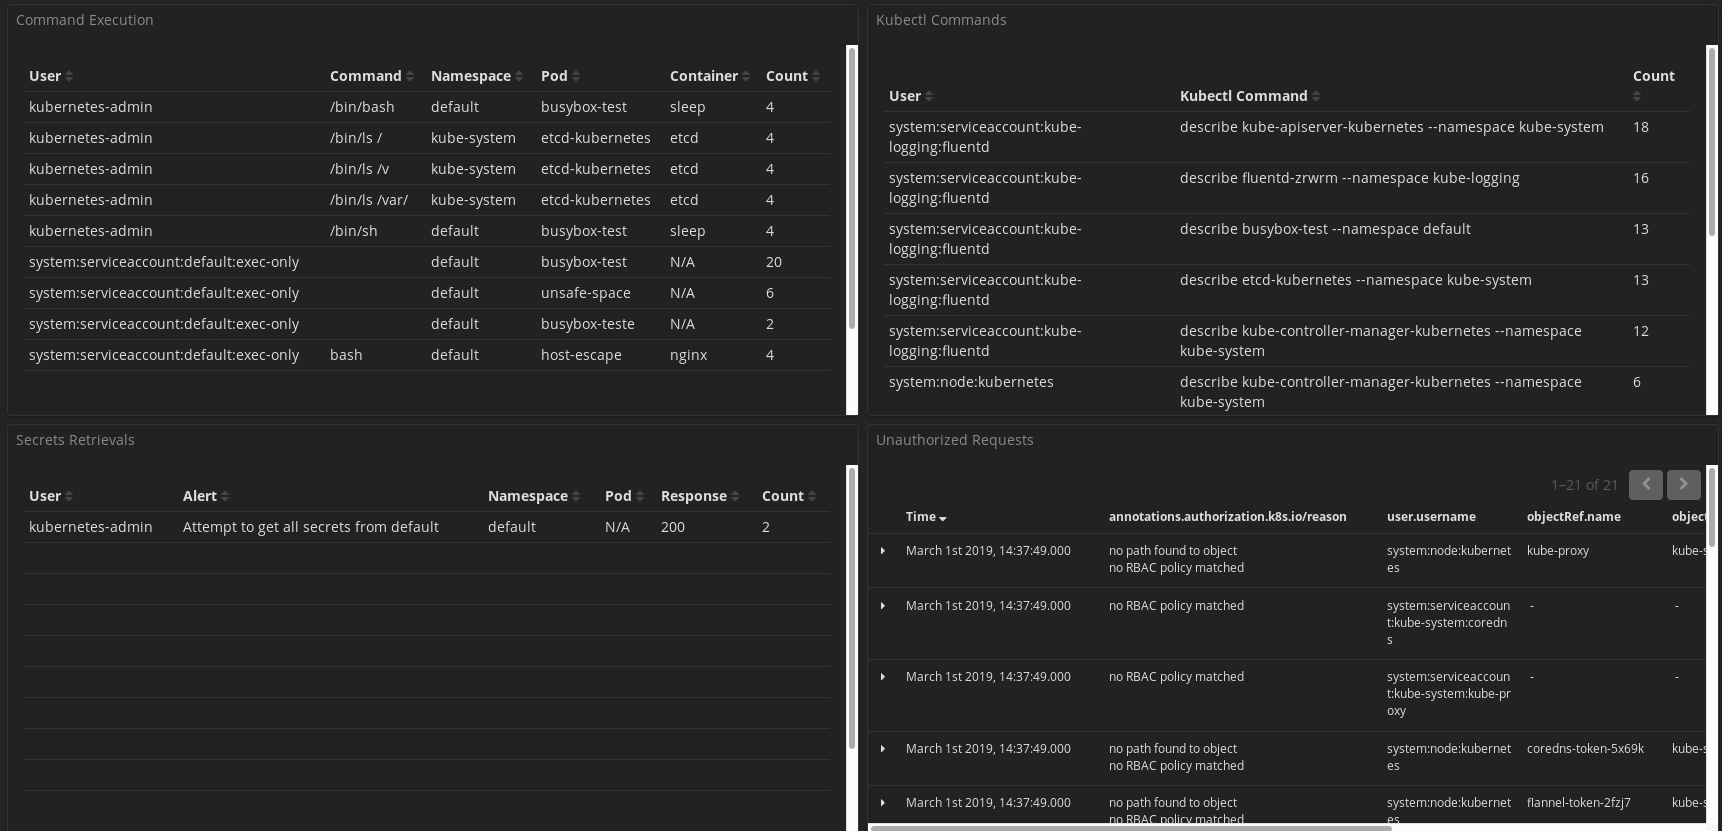
An overview of shell commands executed and kubectl interaction, with a list of attempts at secrets retrieval and requests that have been unauthorised.
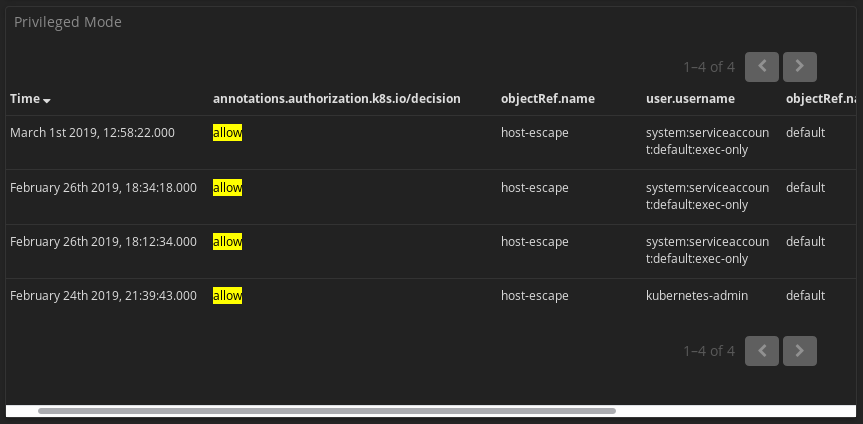
An overview of privileged pod spawning.
- Navigate to the management interface of Kibana
- Go into Saved Objects
- Import the json objects file
