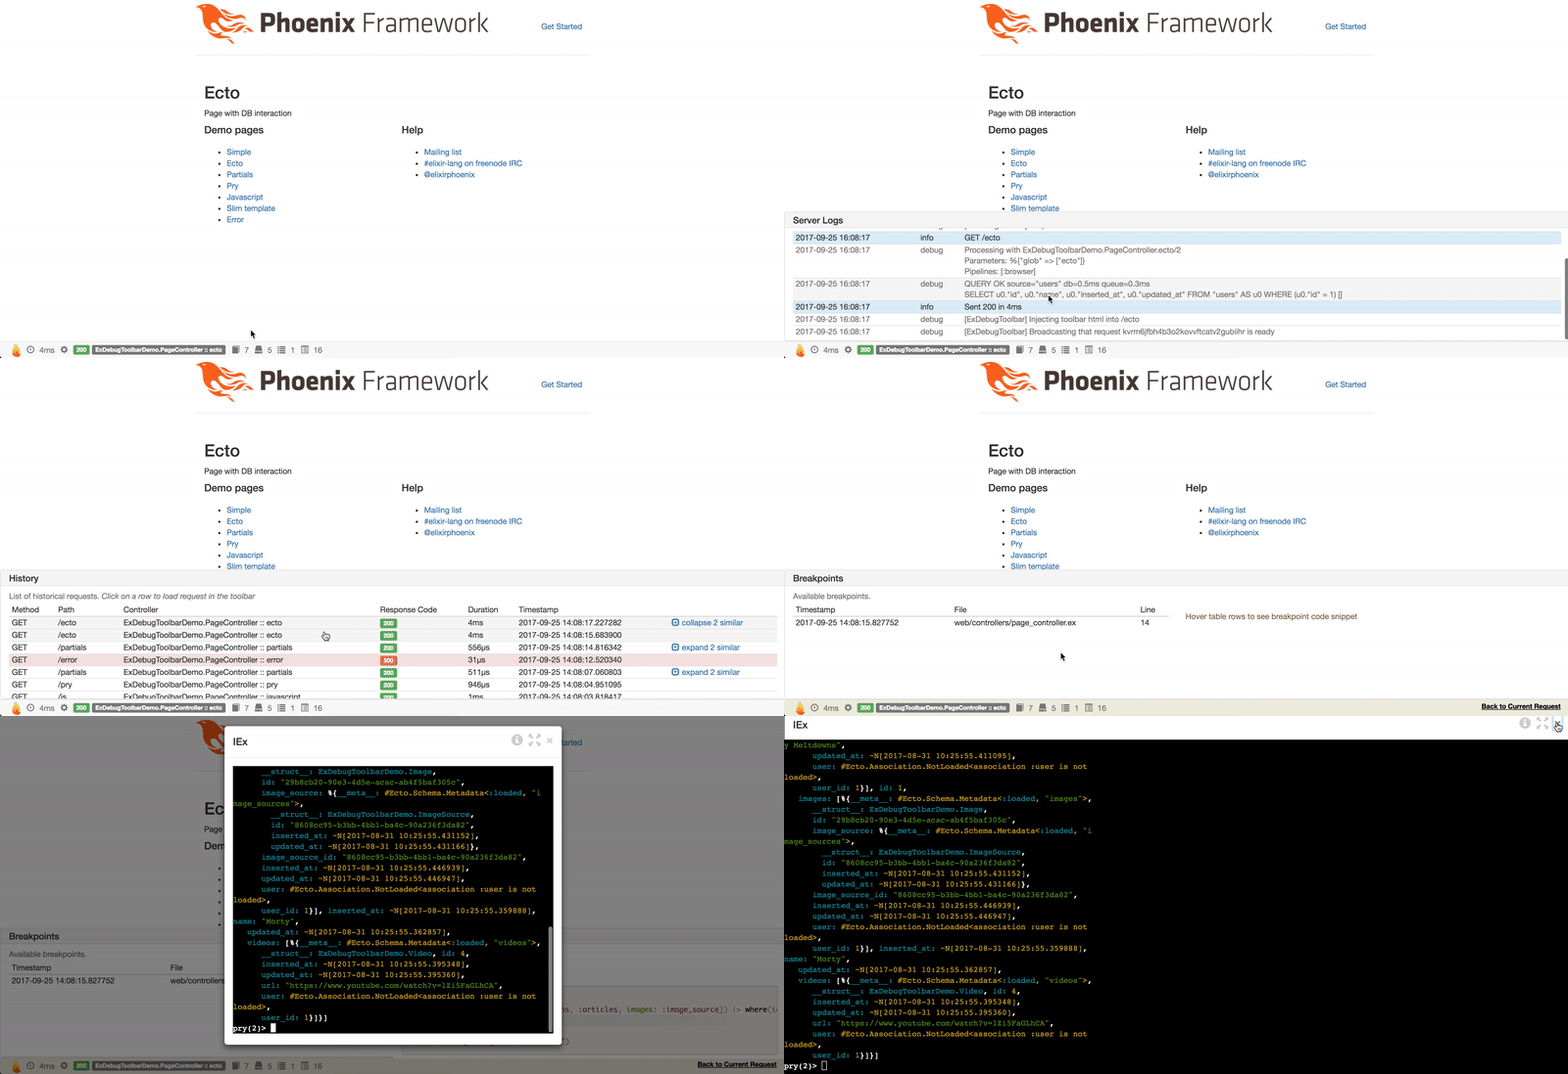
A toolbar for Phoenix projects to display all sorts of information about current and previous requests: logs, timelines, database queries etc.
Project is in its early stages and under active development. Contributions to code, feedback and suggestions will be much appreciated!
- (new) phoenix 1.3
- (new) support bootstrap 4
- (new) requests history panel
- (new) support Slim templates (
phoenix_slimpackage) - (new)
debugconfig key to enable to verbose logs - (new)
ignore_pathsconfig key to skip tracking certain requests by paths - (improved) breakpoints no longer use distribution code
Toolbar is built with development environment in mind. It's up to you to enable or disable it in configuration.
Calls to toolbar functions such as Toolbar.pry are no-op when it is disabled.
After enabling the toolbar, it automatically injects itself at the bottom of html pages.
Some panels on the toolbar are optional and only appear when relevant data is available (ecto queries, for example).

Let's take a look at available panels:
It shows overall time spent rendering current controller as reported by Phoenix instrumentation.
In addition, it provides aggregated stats for each template.

A list of previous request.
 Clicking on historical request loads it into toolbar so you can inspect it closer.

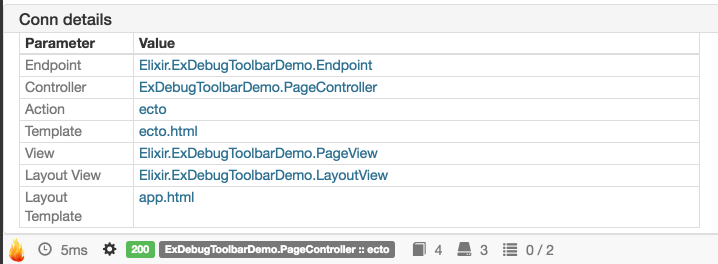
Surfaces information from conn struct of current request.

Log entries relevant to current request only

A list of executed ecto queries including parallel preloads when possible.

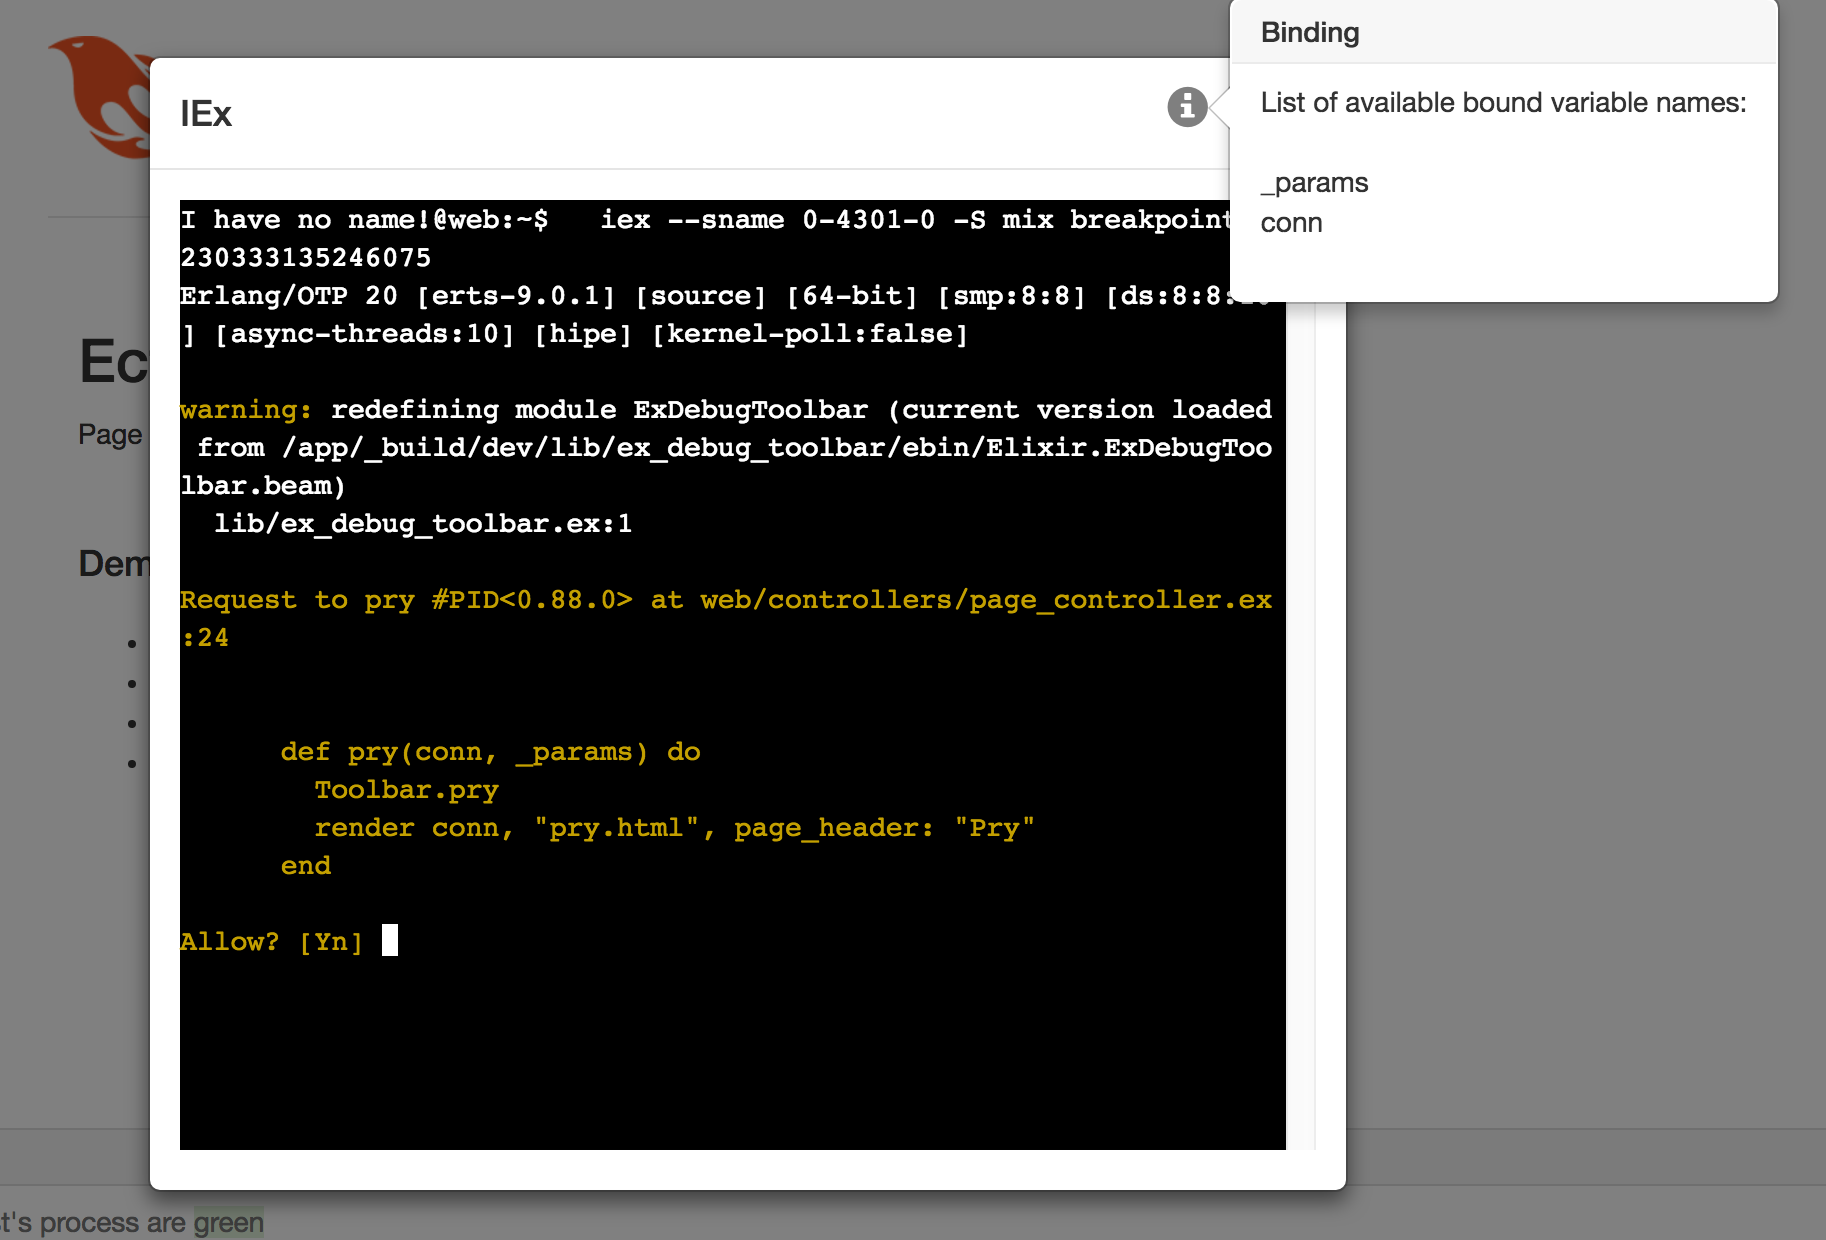
Think of having multiply IEx.pry breakpoints available on demand right from the toolbar.
Note, unlike IEx.pry, this does not interfere with execution flow of phoenix server.
Usage is similar to IEx.
Drop require ExDebugToolbar; ExDebugToolbar.pry in a file you'd like to debug
and breakpoint will appear in this panel. Breakpoints are capped at configurable number per
request (10 by default).

A click on any breakpoint will take you to familiar iex session with context as it was at execution time.

- Add
ex_debug_toolbarto your list of dependencies inmix.exs:
def deps do
  [{:ex_debug_toolbar, "~> 0.4.0"}]
end- Ensure
:ex_debug_toolbaris started before your application:
def application do
  [applications: [:ex_debug_toolbar, :logger]]
end- Add
ExDebugToolbar.Phoenixto your endpoint inlib/my_app/endpoint.ex
  defmodule MyApp.Endpoint do
    use Phoenix.Endpoint, otp_app: :my_app
    use ExDebugToolbar.Phoenix
    ...
end-
Enable toolbar in config
config/dev.exsand setup collectors. Replace:my_appandMyAppwith your application nameNote: Slim templates support requires phoenix_slime package
  # ExDebugToolbar config
  config :ex_debug_toolbar,
    enable: true

  config :my_app, MyApp.Endpoint,
    instrumenters: [ExDebugToolbar.Collector.InstrumentationCollector]

  config :my_app, MyApp.Repo,
    loggers: [ExDebugToolbar.Collector.EctoCollector, Ecto.LogEntry]

  config :phoenix, :template_engines,
    eex: ExDebugToolbar.Template.EExEngine,
    exs: ExDebugToolbar.Template.ExsEngine,
    #slim: ExDebugToolbar.Template.SlimEngine,
#slime: ExDebugToolbar.Template.SlimEngine- To display parallel Ecto preloads you have to use
masterbranch
  defp deps do
    [
     {:ecto, github: "elixir-ecto/ecto", branch: "master", override: true}
    ]
endTo change configuration, update :ex_debug_toolbar config key in your config/dev.exs. For example:
    config :ex_debug_toolbar,
enable: true| Option | Values | Default | Description |
|---|---|---|---|
| enable | boolean | false | Enable/disable toolbar. When disabled, toolbar code is not injected in page and toolbar functions are mostly no-op. |
| iex_shell | string | "/bin/sh" | Shell executable to be used for breakpoint session |
| iex_shell_cmd | string | "stty echo; clear; iex -S mix breakpoint.client --breakpoint-file %{breakpoint_file}" | Shell command to launch breakpoint iex session. %{breakpoint_file} is a placeholder for tmp file with data |
| breakpoints_limit | integer | 10 | Maximum number of breakpoints per request. After reaching this cap, new breakpoints will be ignored |
| remove_glob_params | boolean | true | Plug.Router adds glob params to conn.params and conn.path_params on forward. This option removes them |
| ignore_paths | list | [~r{^/images/}, ~r{^/css/}, ~r{^/js/}, ~r{^/phoenix/live_reload/}] | A list of paths that should not be recorded by toolbar. Each item can be either string for exact match or a Regex. |
| debug | boolean | false | Toggles debug logs. Requires recompilation for some logs |
If you see poison encode related errors in your logs:
- update to latest
poisonpackage version - enable debug mode and open an issue with detailed logs
When enabled, toolbar prints debug logs. This information is very helpful for issues with encoding, missing requests, etc.
Turn on debug mode
    config :ex_debug_toolbar,
      enable: true,
      debug: true
Turn off Logger log truncation and put it into debug level
    config :logger,
      level: :debug,
      truncate: :infinity
Recompile toolbar to see channel logs
mix deps.compile ex_debug_toolbar --force
Special thanks goes to Juan Peri!
Contributions in the form of bug reports, pull requests, or thoughtful discussions in the GitHub issue tracker are welcome!
- Toolbar panels
- Messages output panel (Toolbar.inspect and Toolbar.puts)
- System info panel (versions, vm info, etc)
- Help/Docs Panel (links to dev resources)
- Request time panel
- Request history (historical graphs?)
- Visualize timeline
- Ajax requests panel
- Channels info panel
- Visualize gettext
- Toolbar API
- Decorator for functions to time them
- Add metadata to events and use groupable names (template.render, controller.render etc)
- Tests
- breakpoints
- client test
- terminal test
- breakpoints
- Simple installer mix task
- Upgrade to Phoenix 1.3
- Elm/React instead of jquery?
Use demo app to simplify development process.


