Research project for CSYS5030: Information Theory and Self-Organisation at the University of Sydney
The aim of this study is to apply information theory to financial data in order to understand the magnitude and direction of information transfer between economies and industries. Datasets used includes daily price of stock market indices, exchange traded funds (ETFs), and stock, all of which were obtained from Yahoo! Finance. List of data used is described in tables 1, 2, and 3 below. Stock market indices will be used to represent respective markets, while ETFs will be used to represent industry sectors.
Table 1: Stock market indices representing different markets.
| Ticker | Name | Market | n | Source |
|---|---|---|---|---|
^GSPC |
S&P 500 | USA | 500 | Link |
^N100 |
Euronext 100 | Europe | 100 | Link |
^N225 |
Nikkei 225 | Japan | 225 | Link |
^BVSP |
Bovespa Index | Brazil | 70 | Link |
Table 2: Exchange Traded Funds (ETFs) representing industry sectors.
| Ticker | Name | Industry | Source |
|---|---|---|---|
USO |
United States Oil Fund | Oil | Link |
ICLN |
iShares Global Clean Energy ETF | Renewable Energy | Link |
JETS |
U.S. Global Jets ETF | Airline | Link |
IYT |
iShares Transportation Average ETF | Transportation | Link |
XLP |
Consumer Staples Select Sector SPDR Fund | Consumer staples | Link |
SMH |
VanEck Vectors Semiconductor ETF | Semiconductor | Link |
IXP |
iShares Global Comm Services ETF | Telecom | Link |
VGT |
Vanguard Information Technology Index Fund | Technology | Link |
XPH |
SPDR S&P Pharmaceuticals ETF | Pharmaceutical | Link |
Table 3: Stocks
| Index | Name | Industry | Source |
|---|---|---|---|
XOM |
ExxonMobil | Oil | Link |
DAL |
Delta Airline | Airline | Link |
The primary motivation of this study is to explore whether information theory can be applied to uncover the dynamics between economies, as well as industries. In particular, we are interested in the amount and direction of information transfer. Through data analysis, we aim to test the hypothesis: The United States economy, represented by S&P 500, has more influence on Japanese economy, represented by Nikkei 225, than the other way around.
To test the above hypothesis, transfer entropy will be used. Transfer entropy,
Transfer entropy is calculated by:
$$
T_{X \rightarrow Y} = \sum p\left(y_{t+1}, y_{t}, x_{t}\right) \log \frac{p\left(y_{t+1} \mid y_{t}, x_{t}\right)}{p\left(y_{t+1} \mid y_{t}\right)}
$$
Net Information Flow
If the net information flow
To calculate transfer entropy, instead of using the daily adjusted closing price, we first calculated the natural log of the daily return.
To calculate
For calculating transfer entropy, we used the Java Information Dynamics Toolkit1, which is an open-source tool for computing information-theoretic measures available to many programming languages. Since we are dealing with time-series, we used Kraskov estimator, instead of using discretization, gaussian model or box-kernel estimation. The reason is that box-kernel estimation and discretization are sensitive to the size of the box or bin used, and gaussian model only detects linear component of interactions between the variables. In other words, the analysis will be based on the assumption that there is nonlinear dependency between the variables
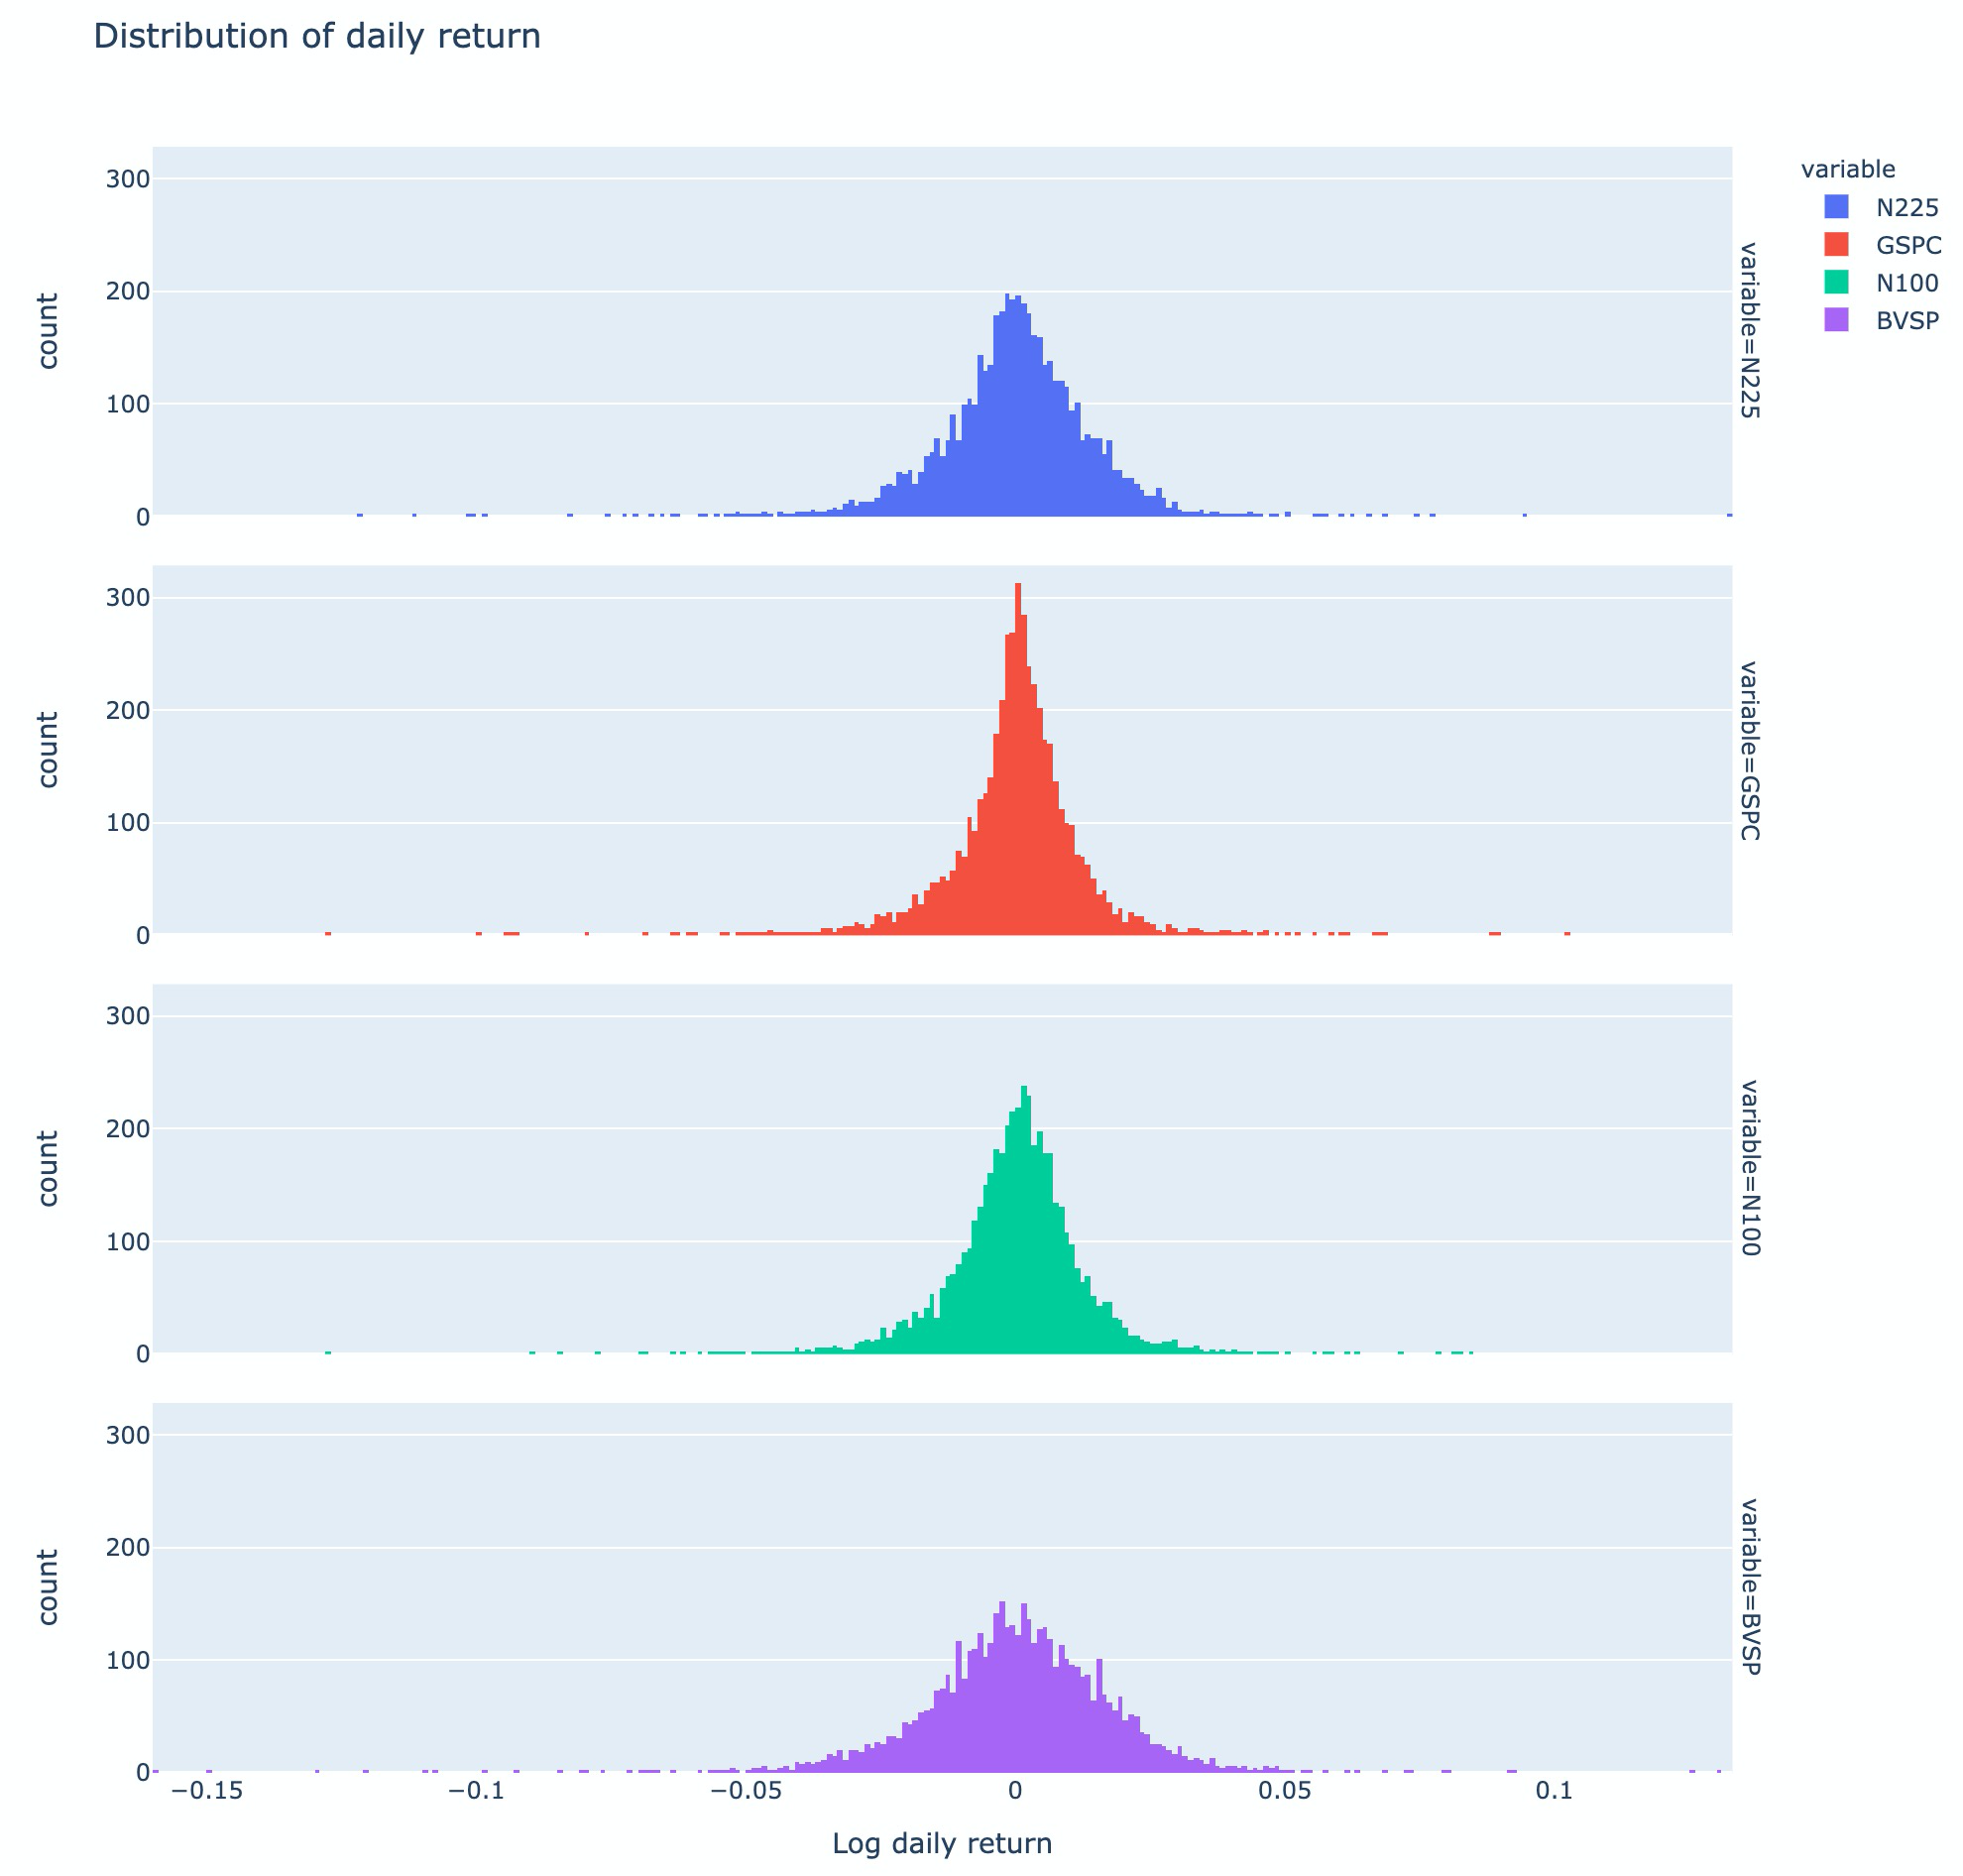
First step of the analysis is converting daily adjusted closing price of each market index to log daily return. Histograms in figure 1 below shows the distribution of daily return for each of the markets. We can see that log daily return is approximately normal and symmetrically distributed with different tail lengths. If we consider Brazil as an "emerging economy," the longer tails makes sense, as emerging economies are less predictable and tends to be more volatile than developed economies like the United States.
Figure 1: Histogram of log daily return: N225 = Japan, GSPC = United States, N100 = Europe, BVSP = Brazil.
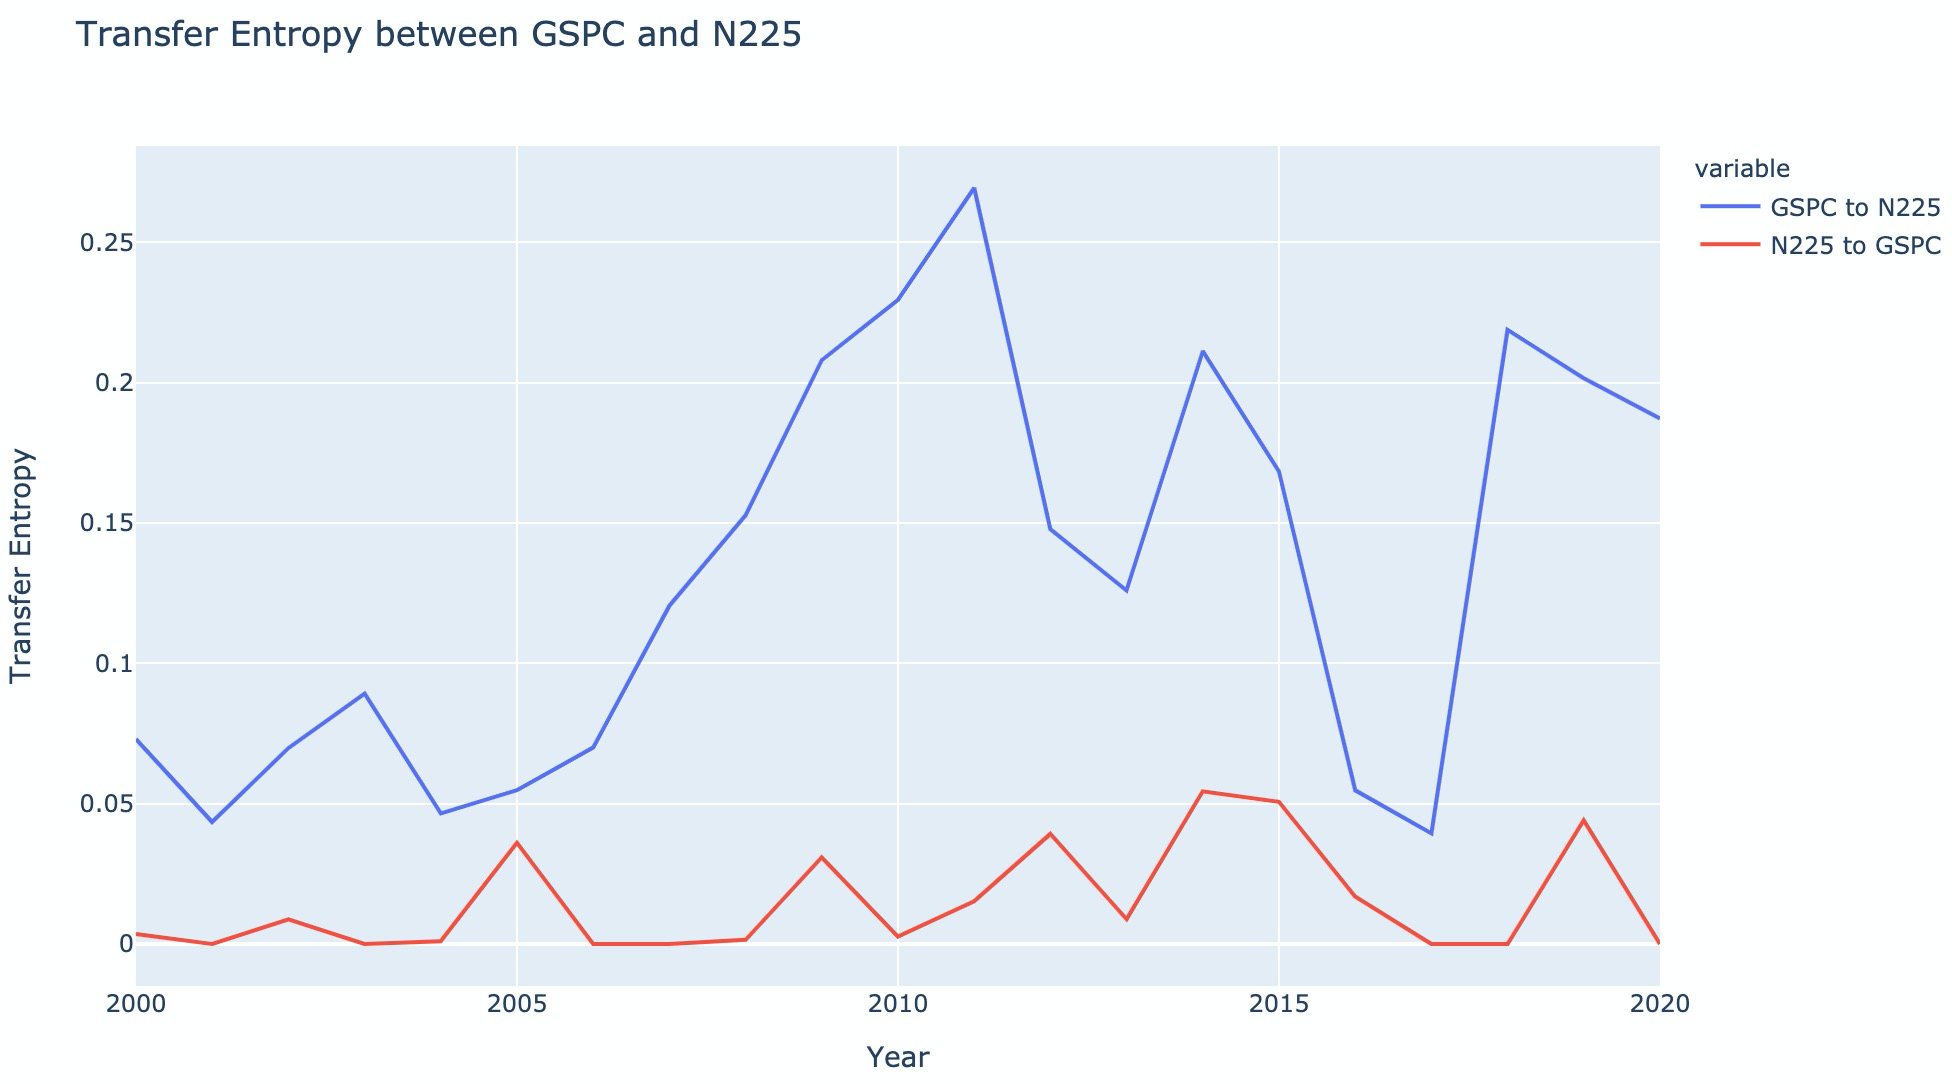
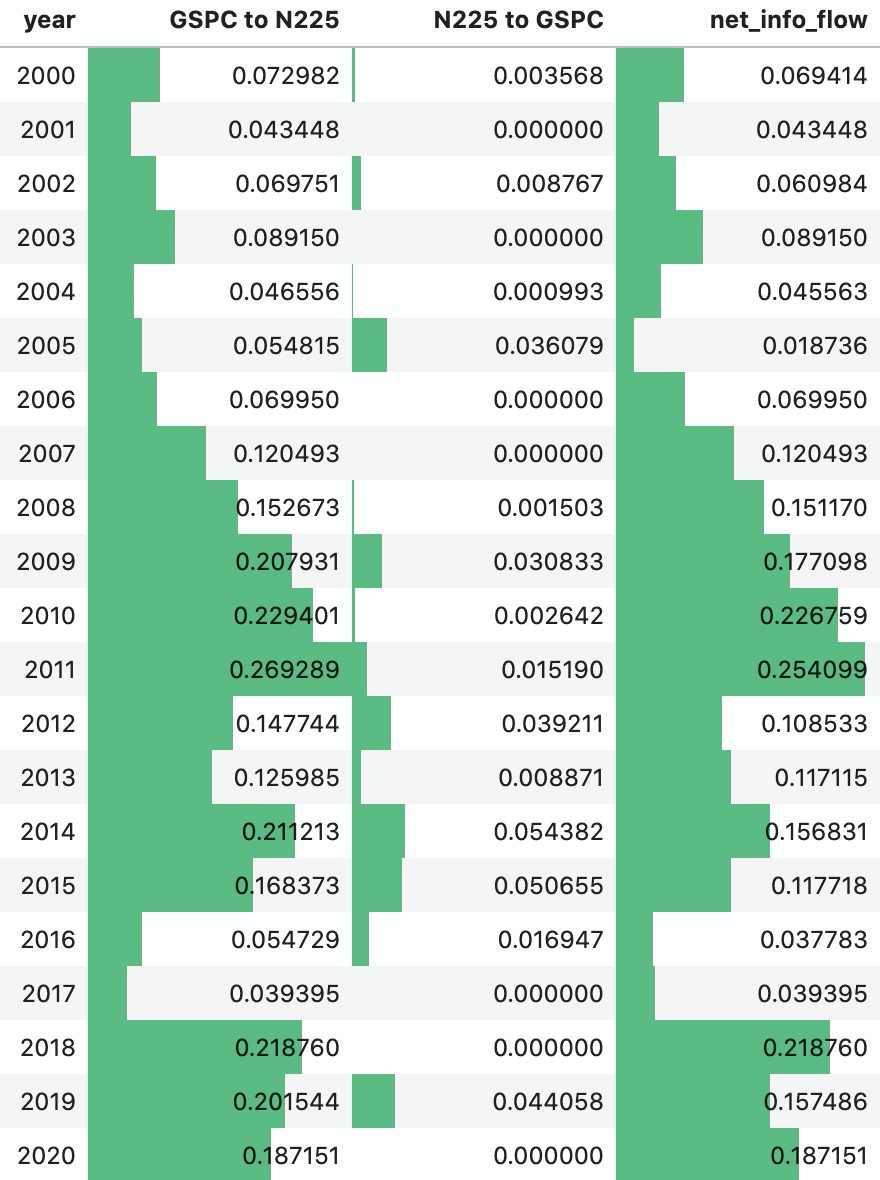
To test the hypothesis that the United States economy has more influence on Japanese economy, transfer entropy was calculated for both directions, GSPC to N225, and N225 to GSPC, for each year since 2000. As shown in figure 2 below, transfer entropy from GSPC to N225 is greater than N225 to GSPC for every time period. The transfer entropy in both directions and net information flow from GSPC to N225 is shown in figure 3. From these two figures, it is evident that while there's information transfer in both directions, the United States economy has far more influence on the Japanese economy than vice versa.
Figure 2: Transfer Entropy between the United States (GSPC) and Japan (N225), from 2000 to 2020.
Figure 3: Transfer Entropy between GSPC (USA) and N225 (Japan), and Net Information Flow from GSPC to N225.
Using all of the data available from the year 2000, we also calculated the overall transfer entropy. The transfer entropy from the United States to Japan is 0.1327 nats with p-value of 0, while the transfer entropy from Japan to the United States is 0.018 nats with p-value of 0.01. Using a threshold of 0.05, we fail to reject the null hypothesis that the United States has more influence on Japan, with a result that is statistically significant. The result of the data analysis suggests that the log return of N225 can be predicted to an extent from the log return of S&P500 (GSPC).
Transfer entropy was also calculated in both directions for every pair of markets: Japan, the United States, Europe, and Brazil. Figure 4 below shows each of the transfer entropy values. The United States (GSPC) indeed has the highest influence on both Japan and Europe, but Japan seems to have more influence on Brazilian economy than the United States. Performing row-wise summation and normalizing the sum by dividing by the total transfer entropy also gives us the transfer entropy contribution, which tells us the percentage of contribution each of the source market made to the overall transfer entropy (table 4). From the transfer entropy contribution, we can see that the United States has the most influence on the rest of the markets, followed by Europe and Japan. With contribution of 0.474, the United States has almost as much influence as Europe, Japan, and Brazil combined.
Figure 4: Transfer Entropy Matrix
Table 4: Transfer Entropy Contribution of US, Europe, Japan, and Brazil.
| Source Index | Transfer Entropy Contribution |
|---|---|
| GSPC (USA) | 0.4740 |
| N100 (Europe) | 0.2995 |
| N225 (Japan) | 0.1279 |
| BVSP (Brazil) | 0.0987 |
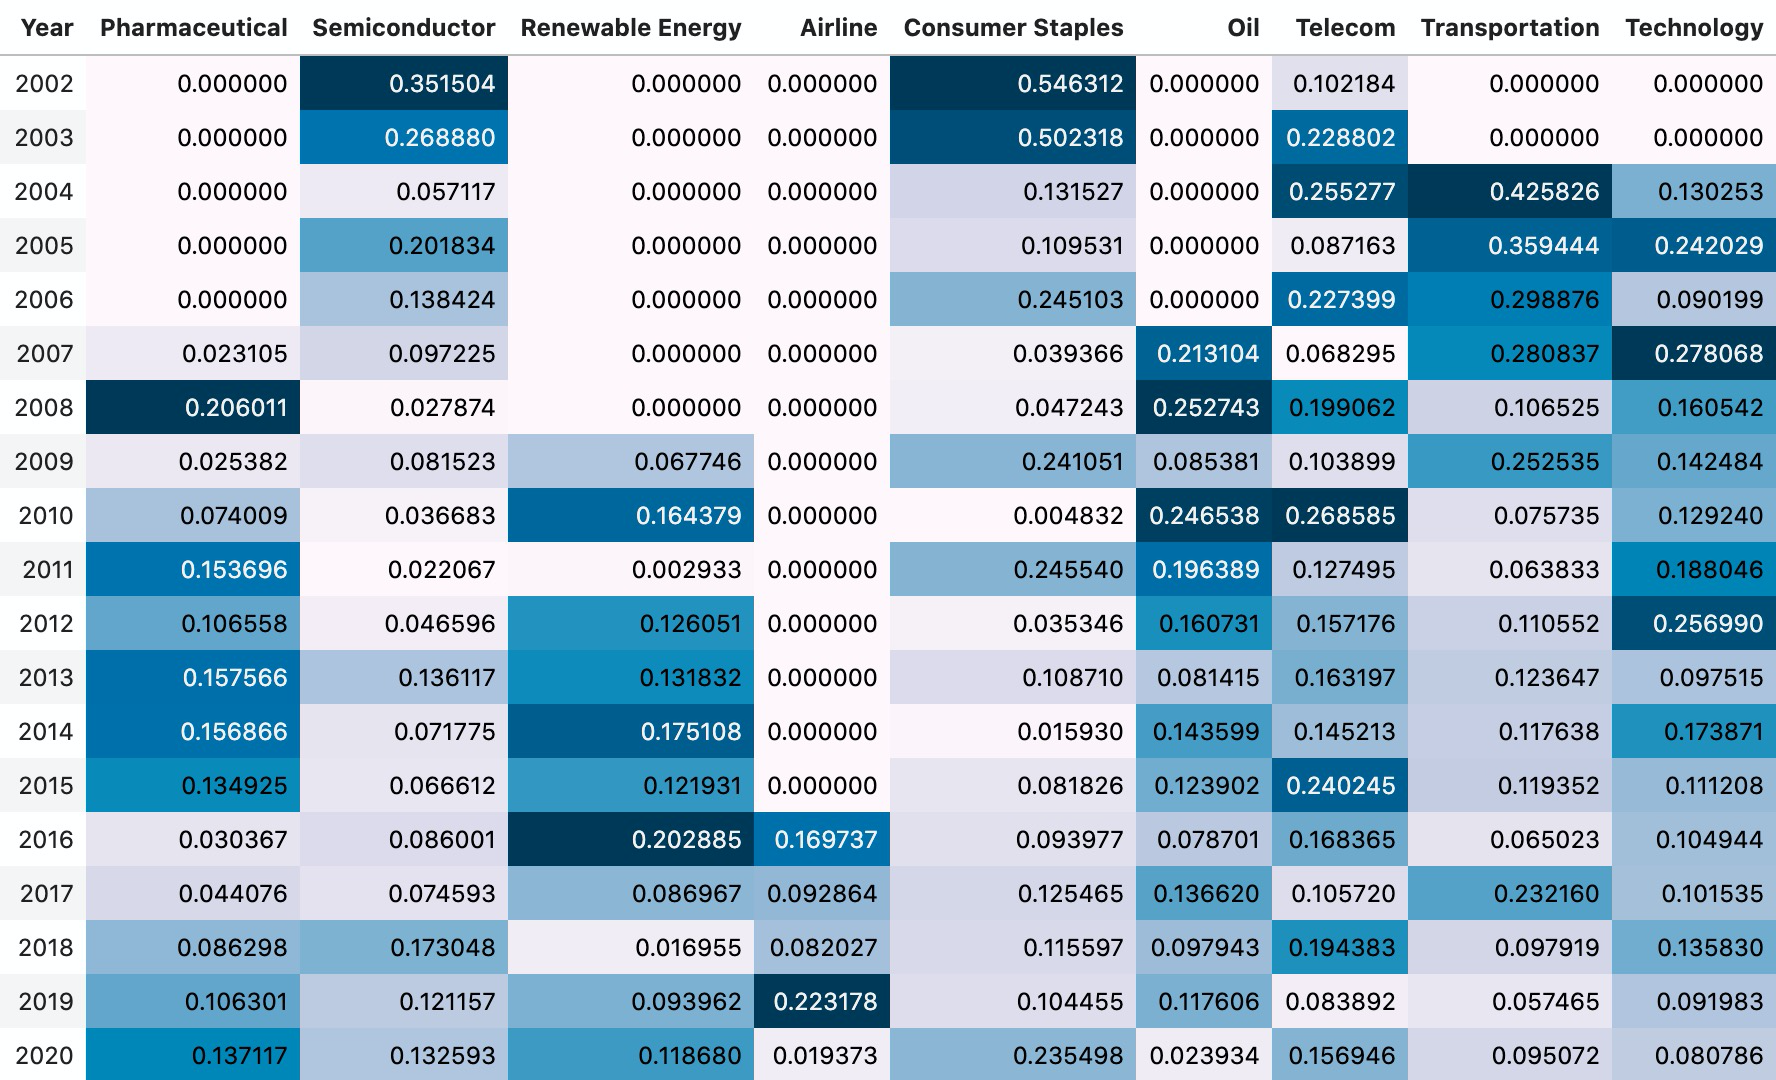
Using selected ETFs to represent various industries, transfer entropy contribution was calculated for each year (figure 5). Since some ETFs have existed for longer than others, consecutive years starting from the year 2000 with transfer entropy contribution of 0 indicate newer ETFs, such as the Airline ETF, which has only existed from 2016. For each year, color scale was applied to emphasize influential industries within each year. Some of the emphasized values were selected and validated by looking at relevant news articles from that year relating to the industry.
Figure 5: Yearly Transfer Entropy Contribution by Industry Sector (Color scale applied row-wise. Darkest color indicate the maximum TE contribution for that year.)
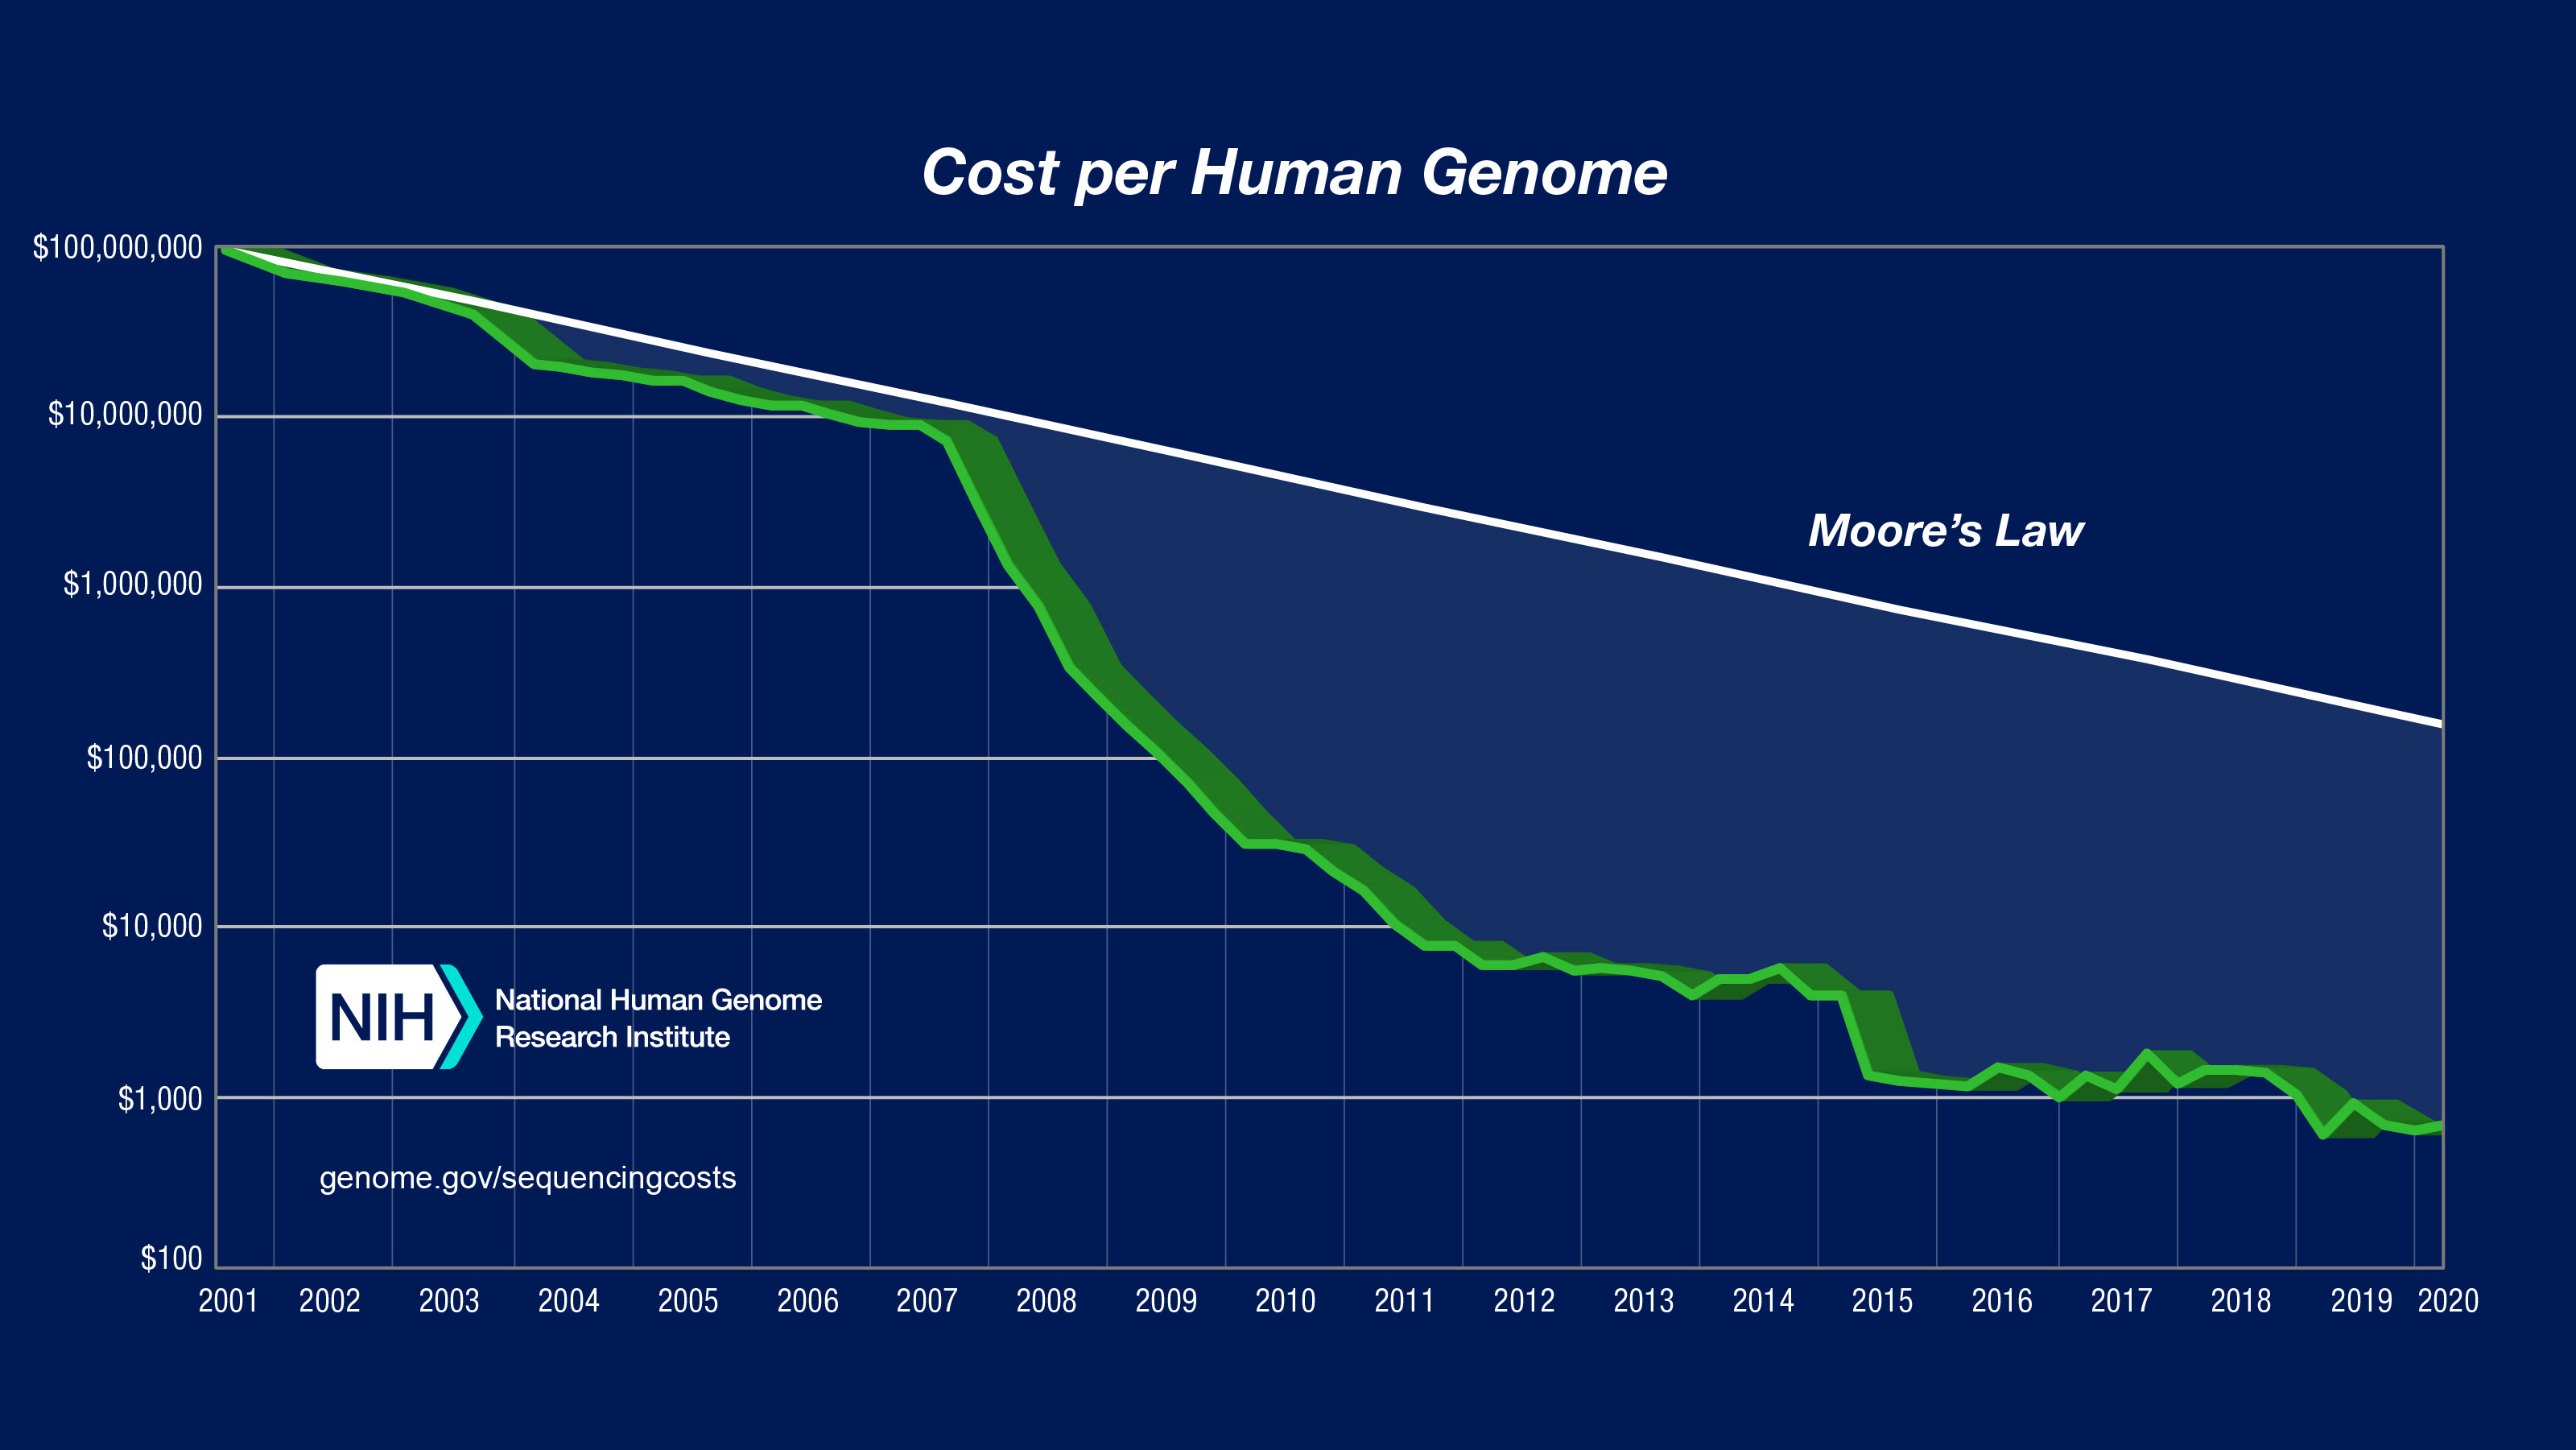
2007 to 2008 was an important year for pharmaceutical industry, and represented an important milestone in human genome sequencing. Between 2007 and 2008, the cost of human genome sequencing dropped sharply from $10 million USD to less than $500,000 USD2 (figure 6).
Figure 6: Cost of Human Genome Sequencing
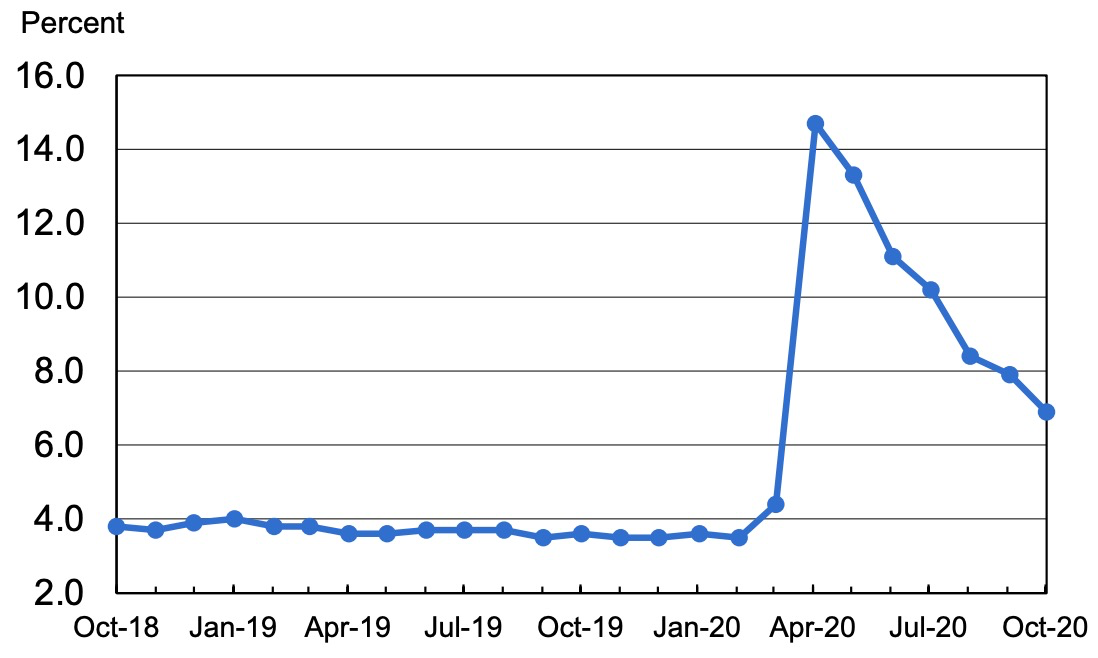
Consumer staples refers to essential products such as food, beverage, household goods, and hygiene products3. The transfer entropy contribution in 2020 being significantly higher than the preceeding years makes sense, as unemployment rate in the United States surged in 2020 due to COVID-19 pandemic causing consumers to refrain from leaving their homes. The high unemployment rate likely led to cutback in consumer spending on nonessential goods. In other words, consumer staples is one of the industries that are most resilient to economic downturn.
Figure 7: United States unemployment rate, seasonally adjusted, October 2018 - October 2020
Source: United States Bureau of Labor Statistics4
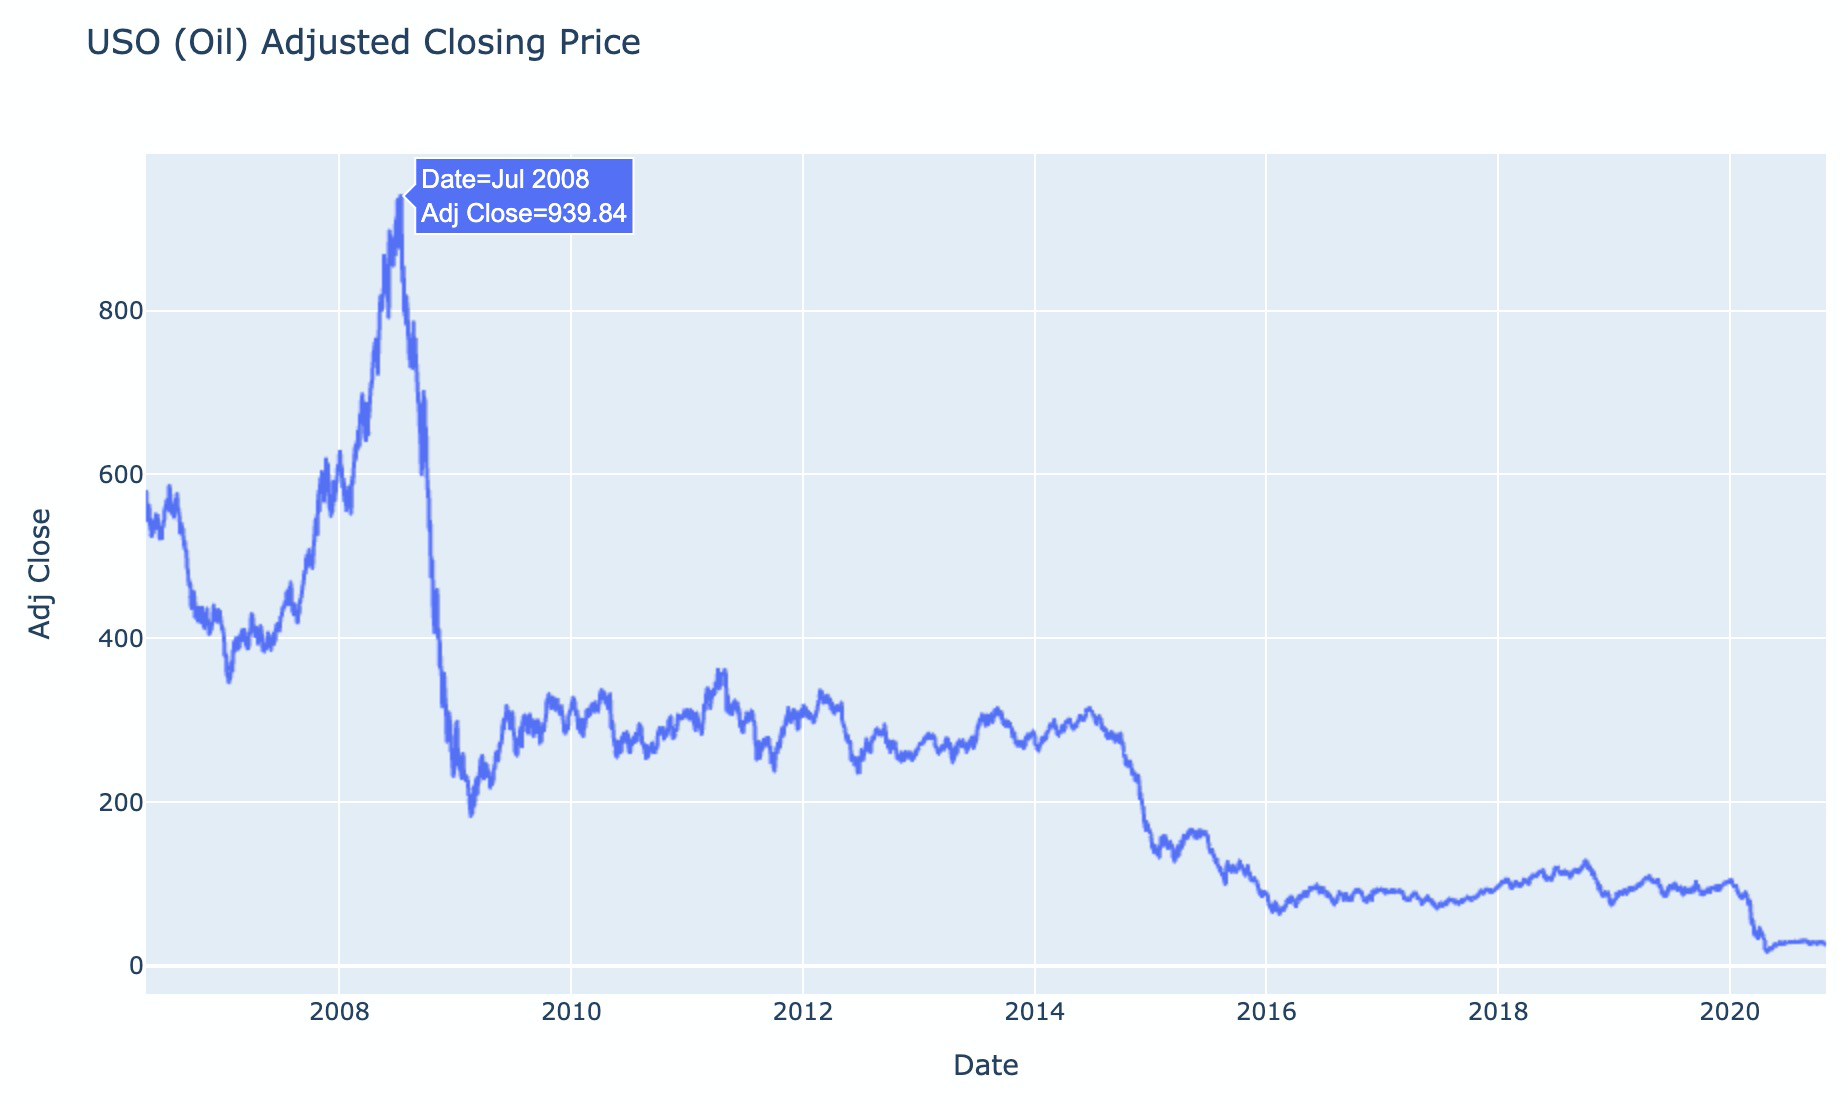
In the year 2008, price of crude oil reached an all time high of 147.5 USD per barrel before a massive crash. This was partially caused by the weakening of the USD currency after $70 billion USD Wallstreet bailout following the financial crisis of 2008. There was also a significant increase in unemployment and cutback on consumer spending due to the recession, and demand for energy fell drastically as a result5.
Figure 8: Adjusted Daily Closing Price of USO (United States Oil Fund)
Based on the findings discussed in the Results section, transfer entropy has shown to be an effective measure of the direction and magnitude of information transfer between markets and industries, which can be used to distinguish influential markets and industries. Transfer entropy also seems to capture the dynamics regardless of whether the correlation is inverse or not between two processes. The analysis done in this research can also be extended or improved in different ways. First, choice of using ETFs to represent industries should be avoided, as the ETFs are diversified to different extents, and some of the ETFs were not mutually exclusive. The benefit of using transfer entropy is that it removes active information storage. However, if the two processes contain the same stock, then the resulting transfer entropy also contains active information storage. Instead of ETFs, a number of stocks with the largest market capitalization should be selected from each industry to ensure disjointness of stocks between industries. Second, the input data can be discretized so that entropy estimators are not necessary. The financial data can be discretized by whether the daily return was positive or negative, or whether the return increased or decreased from the previous time step.
Footnotes
-
https://www.genome.gov/about-genomics/fact-sheets/Sequencing-Human-Genome-cost ↩
-
https://www.investopedia.com/terms/c/consumerstaples.asp#:~:text=Consumer%20staples%20are%20essential%20products,items%20as%20alcohol%20and%20tobacco. ↩
-
https://www.investopedia.com/ask/answers/052715/how-did-financial-crisis-affect-oil-and-gas-sector.asp ↩
