A Probability Model for the Joint Distribution of Wind Speed and Direction (Gaussian Mixture Models, GMM)
This is a Python program for modeling the joint distribution of wind speed and direction.
The method is based on:
-
Harris, Cook, The parent wind speed distribution: Why Weibull?, http://www.sciencedirect.com/science/article/pii/S0167610514001056
-
Gaussian Mixture Models, http://scikit-learn.org/stable/modules/mixture.html
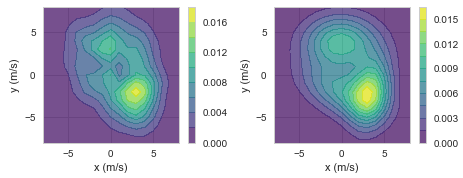
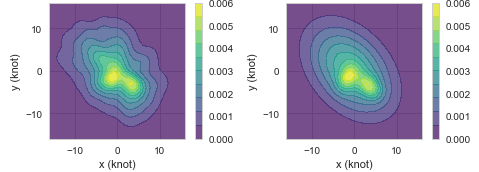
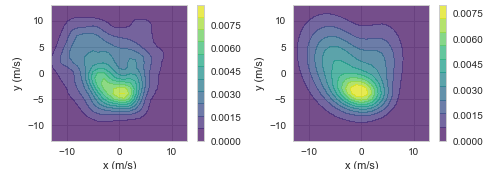
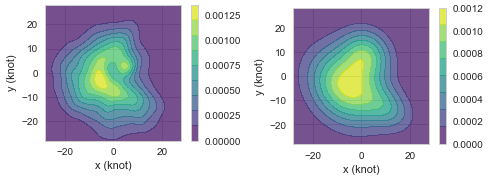
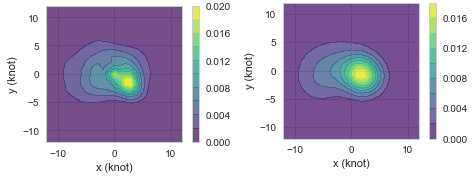
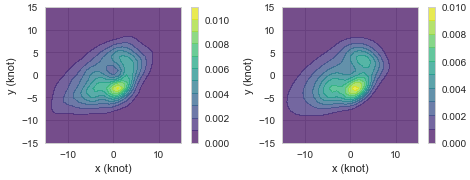
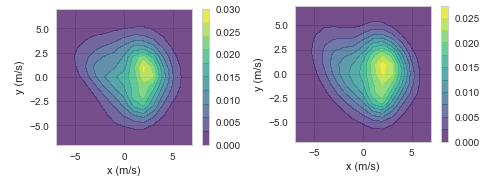
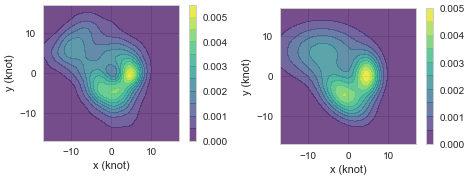
Take Shanghai Hongqiao Intl as an example
Left: Empirical PDF, Right: Model PDF
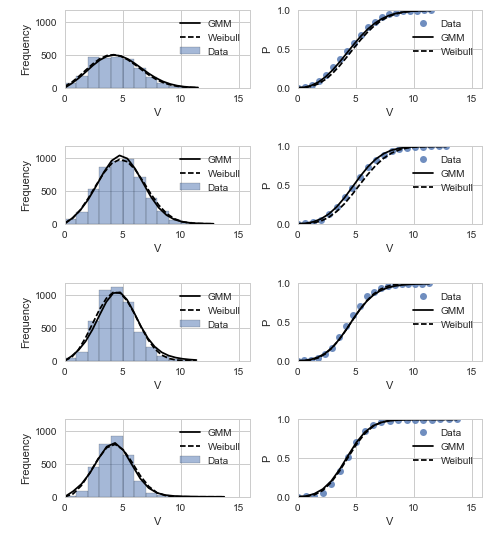
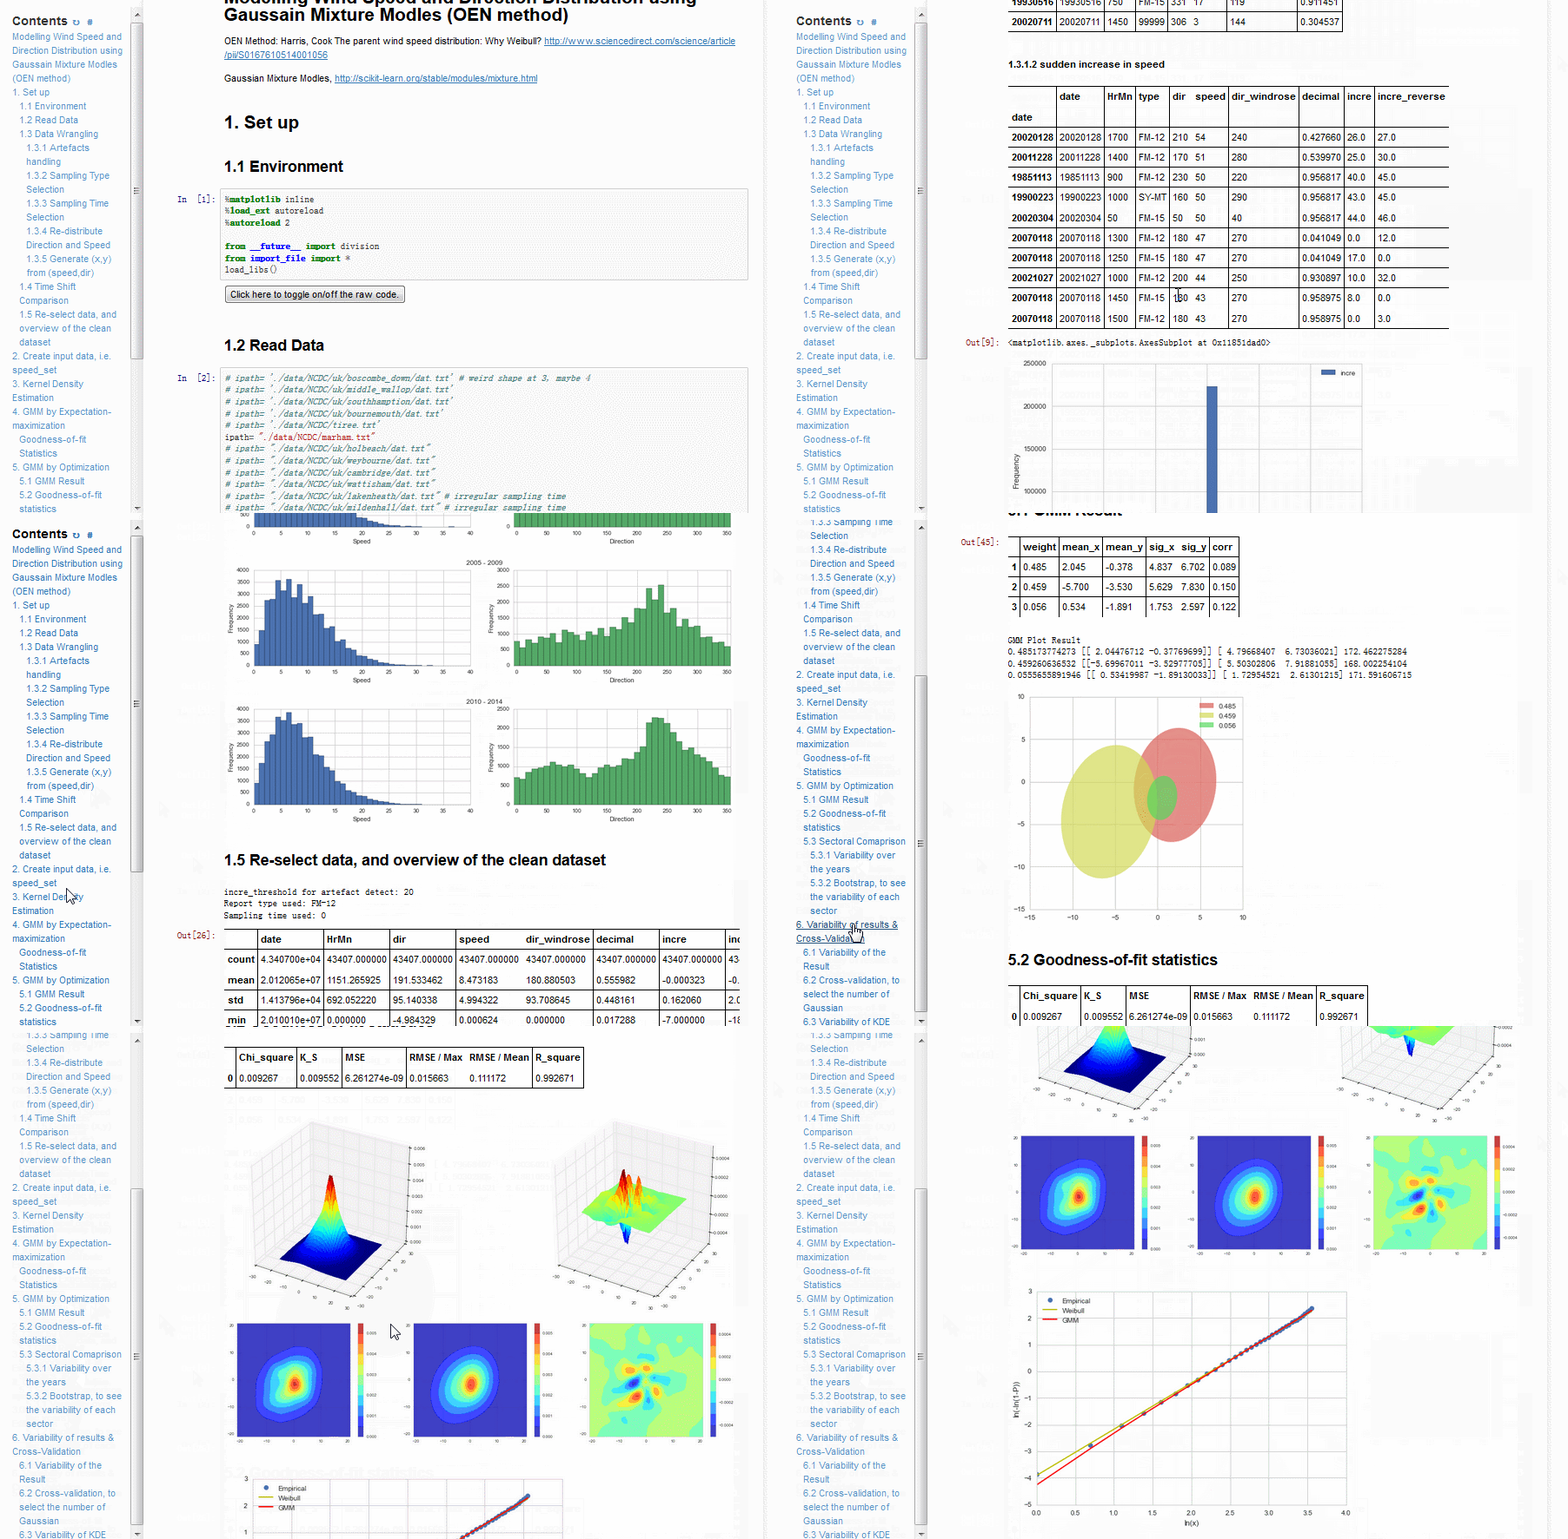
Histogram vs. Model
Left: Histogram vs. Model, Right: Empirical vs. Model CDF
The above results are available at https://cdn.rawgit.com/cqcn1991/Wind-Speed-Analysis/master/output_HTML/hongqiao_intl.html , along with other analysis.
This model can be used to obtain the wind speed distribution, wind direction distribution and the joint distribution of wind speed and direction distribution with good accuracy.
Its potential applications include:
-
Wind energy evaluation, wind resource assessment (long term). For example, the optimization of wind farm layout.
-
Wind load analysis on structures, such as fatigue analysis. For example, the wind load on highrise buidings.
-
Pedestrian-level wind environment assessment.
Here is how the method applies to different places across the world. The Weibull distribution is listed as the traditional model for comparison.
You can use the code toggle button and sidebar to navigate these reports.
The model I'm using is Gaussian Mixture Model, or simply put, the sum of some normal distributions. The idea is very simple:
1. For a certain wind character, the wind vector (speed and direction) follows the normal distribution:
2. For specific location, its wind speed direction distribution is composed of several such wind characters, and hence the sum of several normal distributions:
fi is the PDF of normal distribution component, pi is its weight.
The chief beauty of this model is its elegance (simplicity). You can use such a simple model (GMM) to describe wind, contrary to previous Weibull combination and others.
For a complete explanation of how GMM fit the joint distribution of wind speed and direction, you can read
Harris, Cook, The parent wind speed distribution: Why Weibull?, http://www.sciencedirect.com/science/article/pii/S0167610514001056
And I'm also working on a paper about it, this is my Master Thesis. And if you have any interest (question, collaboration...) feel free to ask me. I open source the project is meant to help you try it.
Download at https://www.continuum.io/downloads
This repo use Python 3, so you should use the 3 as well.
After installing Anaconda, there are still some additional packages you need to install:
Just run these in your command line to install them
pip install -r requirements.txt
You may need some datasets to get started. For this reason, I have include some in https://github.com/cqcn1991/Wind-Speed-Analysis/tree/master/data If you want additional data, you can find them at http://www.ncdc.noaa.gov/
If you have any question, you could post it at issue, or mail me at 38306608#qq.com
The program now uses some R packages to fit von Mises mixture model. You can either delete related code, or install R and Rpy 2 to enable this feature. Specifically:
-
Install R and R studio from https://cran.r-project.org/ and https://www.rstudio.com
-
Install R packge movMF from https://cran.r-project.org/web/packages/movMF/index.html, by running
install.packages("movMF")in R studio -
Install Rpy2 for running R with Python
This work would be impossible without the help from Cook and Harris. Thank you!
