This package contains color palettes for RStudio, inspired by soil profiles. Palettes are colorblind-friendly and were created using Chroma.js and Coolors.
Source images and color hex values can be found in the
images.md
file in the root directory.
# install.packages("devtools")
devtools::install_github("kaizadp/soilpalettes")Examples
library(ggplot2)

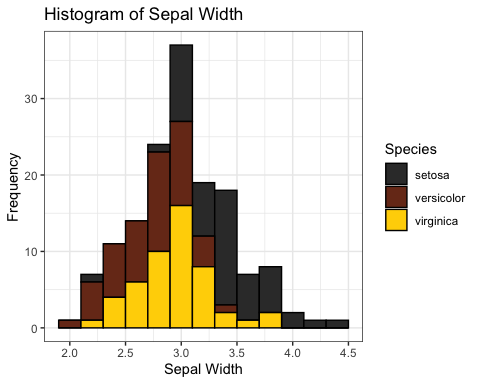
ggplot(data=iris, aes(x=Sepal.Width, fill = Species))+
  geom_histogram(binwidth=0.2, color="black") +
  xlab("Sepal Width") +  ylab("Frequency") +
  ggtitle("Histogram of Sepal Width") + theme_bw()+

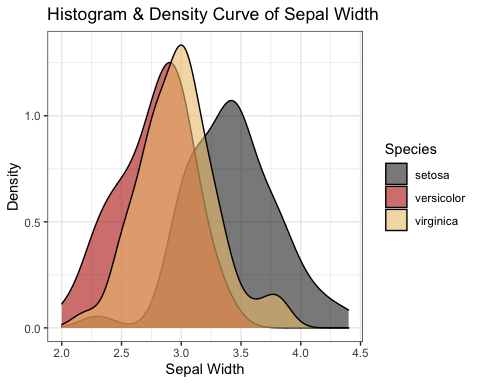
scale_fill_manual(values = soil_palette("rendoll",3))ggplot(data=iris, aes(x=Sepal.Width, fill=Species)) +
geom_density(stat="density", alpha=(0.6)) +
xlab("Sepal Width") + ylab("Density") +
ggtitle("Histogram & Density Curve of Sepal Width") + theme_bw()+
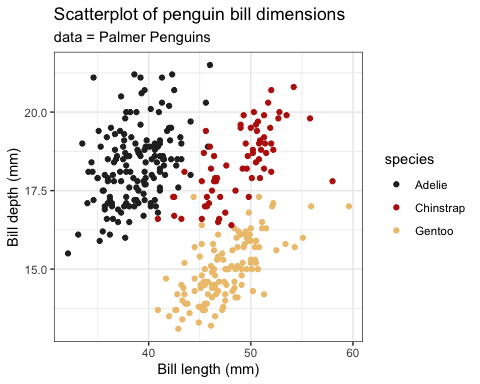
scale_fill_manual(values = soil_palette("paleustalf",3))library(palmerpenguins)
ggplot(penguins, aes(x = bill_length_mm, y = bill_depth_mm, color = species))+
geom_point()+
labs(x = "Bill length (mm)", y = "Bill depth (mm)",
title = "Scatterplot of penguin bill dimensions",
subtitle = "data = Palmer Penguins")+
theme_bw()+
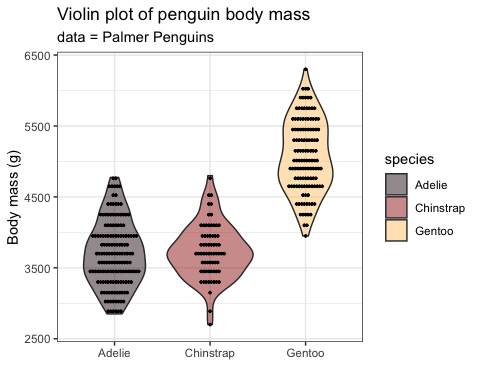
scale_color_manual(values = soil_palette("paleustalf", 3)) ggplot(penguins, aes(y = body_mass_g, x = species, fill = species))+
geom_violin(alpha = 0.5)+
geom_dotplot(binaxis = "y", color = "black", fill="black", dotsize=0.3, stackdir = "center", binpositions="all")+
labs(y = "Body mass (g)", x = "",
title = "Violin plot of penguin body mass",
subtitle = "data = Palmer Penguins")+
theme_bw()+
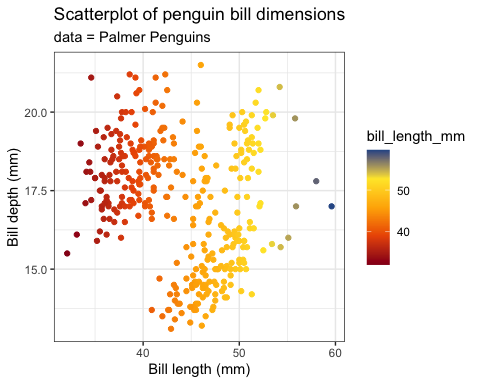
scale_fill_manual(values = soil_palette("podzol", 3)) ggplot(penguins, aes(x = bill_length_mm, y = bill_depth_mm, color = bill_length_mm))+
geom_point()+
labs(x = "Bill length (mm)", y = "Bill depth (mm)",
title = "Scatterplot of penguin bill dimensions",
subtitle = "data = Palmer Penguins")+
theme_bw()+
scale_color_gradientn(colors = rev(soil_palette("redox2",5))) Acknowledgments and Contributions
Code structure was modelled after the
PNWColors and
wesanderson packages.
Contribute soil palettes in the
issues.
