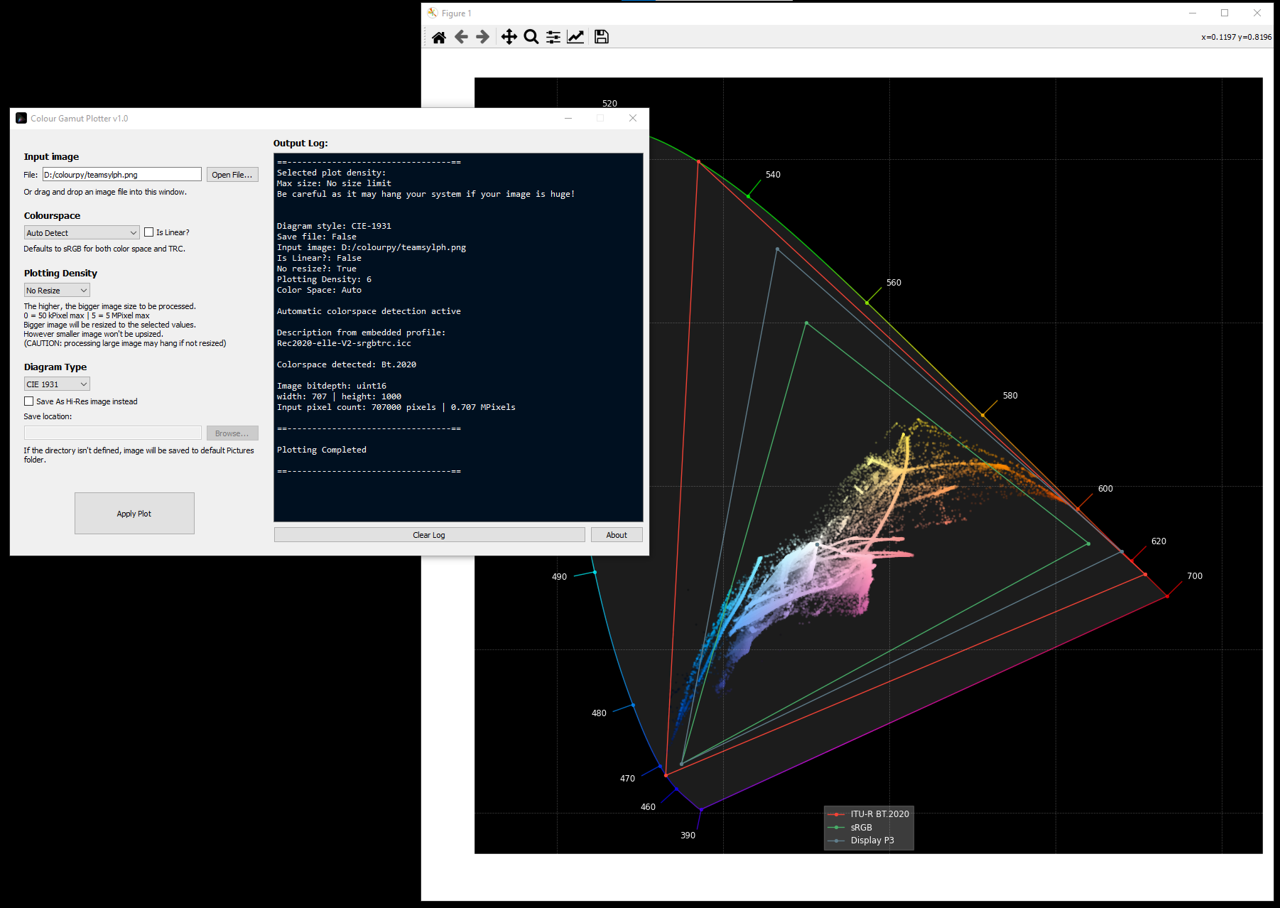
A simple GUI for Colour-Science plot_RGB_chromaticities_in_chromaticity_diagram function.
(Beta: Draft plotting with vispy and image loading with libvips)
Written in Python 3.10.7
- colour-science 0.4.1 (primary, optional, graphviz, plotting, meshing, freeimage)
- matplotlib 3.6.0 (for some reason in my case, it didn't installed from color-science optional)
- pyqt5 5.15.7
- opencv-python 4.6.0.66
tifffile 2022.8.12- vispy 0.11.0
- pyvips 2.2.1 along with libvips >= 8.13.2
- Image file opened with OpenCV instead, so image bit depth is preserved. As colour science read_image is using imageio and downsampled the image to 8 bit.
- Automatic colour profile detection parsed from embedded profile.
- Automatic detection if the embedded profile have different per-channel TRC
- Selectable plotting density. If image is bigger than the plotting density, image is resized with Nearest Neighbour so no interpolation is happening.
- Selectable diagram mode, between CIE 1930 or CIE 1976 UCS Chromaticity diagram.
- Rapid preview with vispy. Check 'Vispy preview (beta)' to try it.
- Extended format support from libvips, including JPEG XL support.
- Only supports image with RGB model.
- When opening a multiple page TIFF, only the first page that will be plotted.
- Plotting large image with large plotting density will cause the app to be unresponsive until the calculation is complete.
