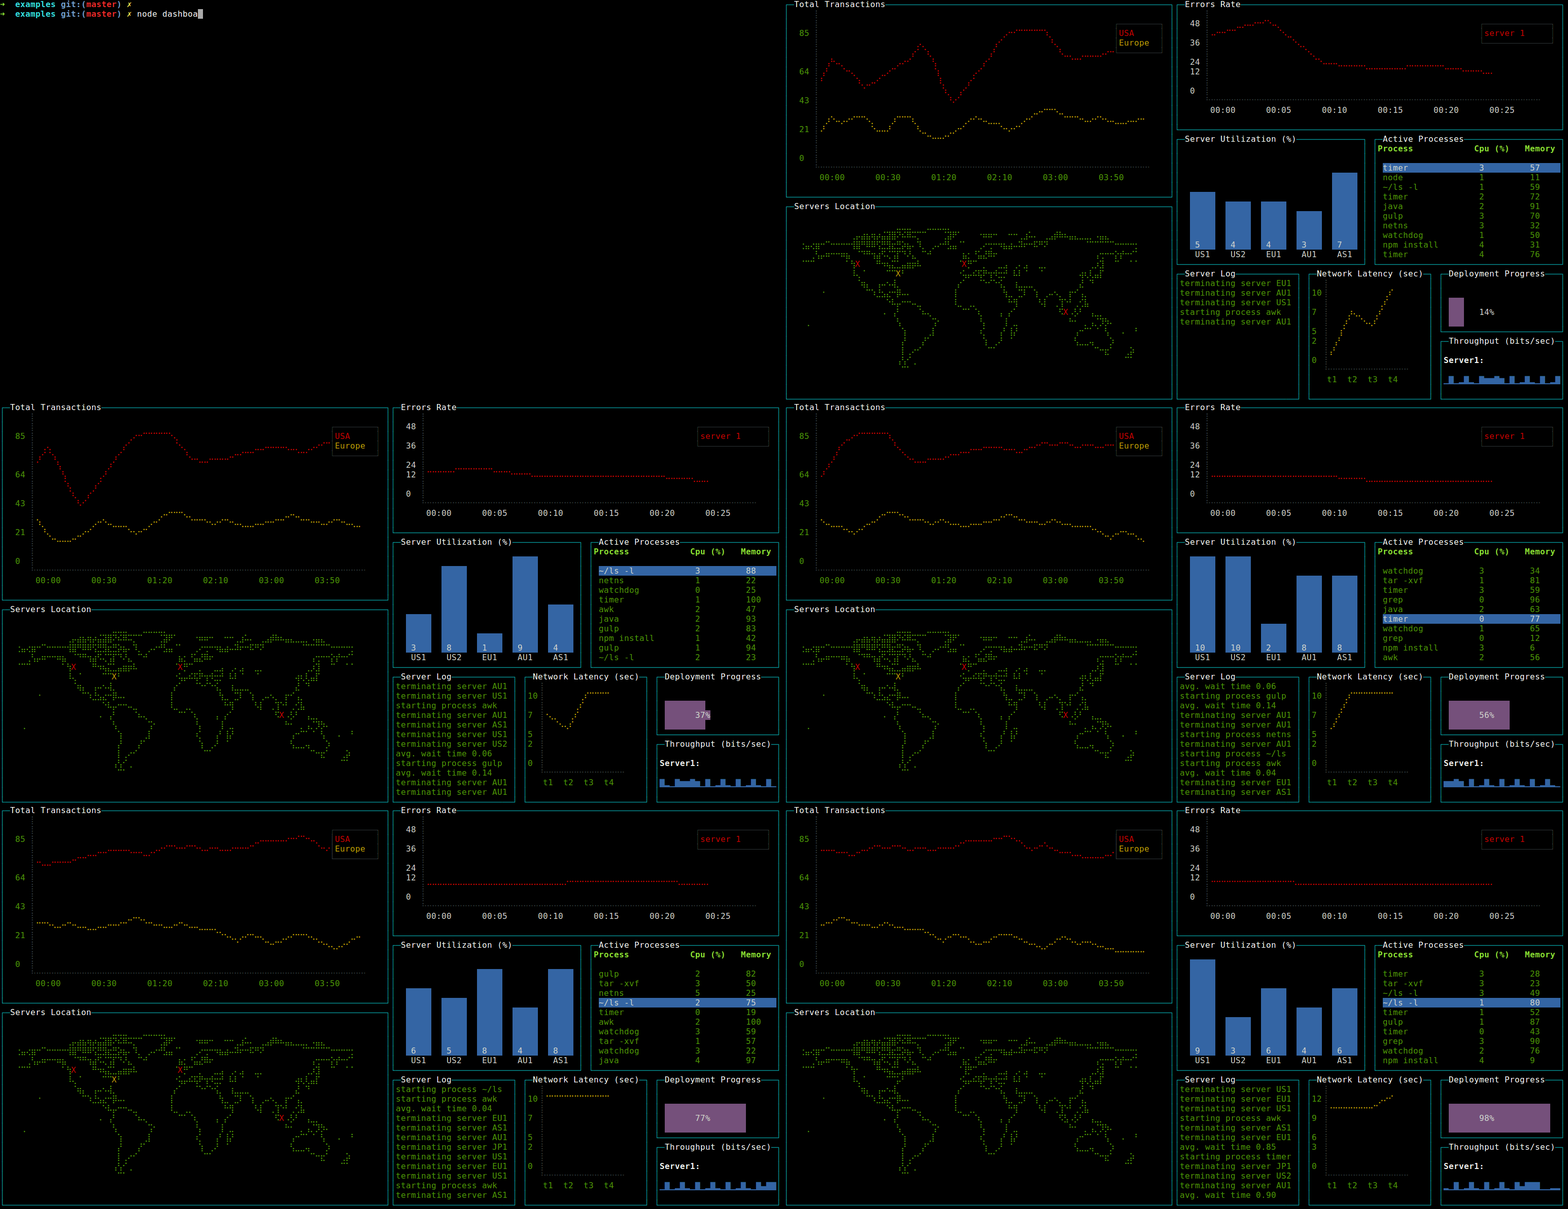
Build dashboards (or any other application) using ascii/ansi art and javascript.
Friendly to terminals, ssh and developers. Extends blessed with custom drawille and other widgets.
Contributors:
Yaron Naveh (@YaronNaveh)
Demo (full size):
Running the demo
git clone https://github.com/yaronn/blessed-contrib.git
cd blessed-contrib
npm install
node ./examples/dashboard.js
Tested on Linux and OS X. In order to use on windows need to install Braille fonts (not tested).
npm install blessed blessed-contrib
##Usage
You can use any of the default widgets of blessed (texts, lists and etc) or the widgets added in blessed-contrib (described bellow). A layout is optional but usefull for dashboards. The widgets in blessed-contrib follow the same usage pattern:
   var blessed = require('blessed')
     , contrib = require('blessed-contrib')
     , screen = blessed.screen()
     , line = contrib.line(
         { style:
           { line: "yellow"
           , text: "green"
           , baseline: "black"}
         , xLabelPadding: 3
         , xPadding: 5
         , label: 'Title'})
     , data = {
         x: ['t1', 't2', 't3', 't4'],
         y: [5, 1, 7, 5]
      }
   screen.append(line) //must append before setting data
   line.setData([data])

   screen.key(['escape', 'q', 'C-c'], function(ch, key) {
     return process.exit(0);
   });

   screen.render()
See bellow for a complete list of widgets.
   var line = contrib.line(
         { style:
           { line: "yellow"
           , text: "green"
           , baseline: "black"}
         , xLabelPadding: 3
         , xPadding: 5
         , showLegend: true
         , wholeNumbersOnly: false //true=do not show fraction in y axis
         , label: 'Title'})
   var series1 = {
         title: 'apples',
         x: ['t1', 't2', 't3', 't4'],
         y: [5, 1, 7, 5]
      }
   var series2 = {
         title: 'oranges',
         x: ['t1', 't2', 't3', 't4'],
         y: [5, 1, 7, 5]
      }
   screen.append(line) //must append before setting data
   line.setData([series1, series2])
Examples: simple line chart, multiple lines
    var bar = contrib.bar(
       { label: 'Server Utilization (%)'
       , barWidth: 4
       , barSpacing: 6
       , xOffset: 0
       , maxHeight: 9})
    screen.append(bar) //must append before setting data
    bar.setData(
       { titles: ['bar1', 'bar2']
, data: [5, 10]}) var map = contrib.map({label: 'World Map'})
map.addMarker({"lon" : "-79.0000", "lat" : "37.5000", color: "red", char: "X" }) var gauge = contrib.gauge({label: 'Progress'})
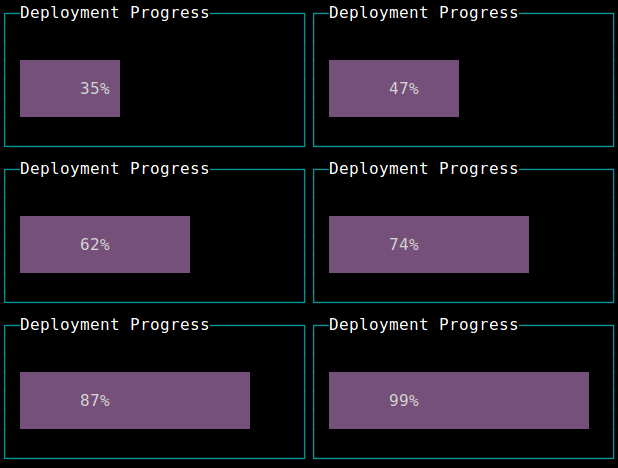
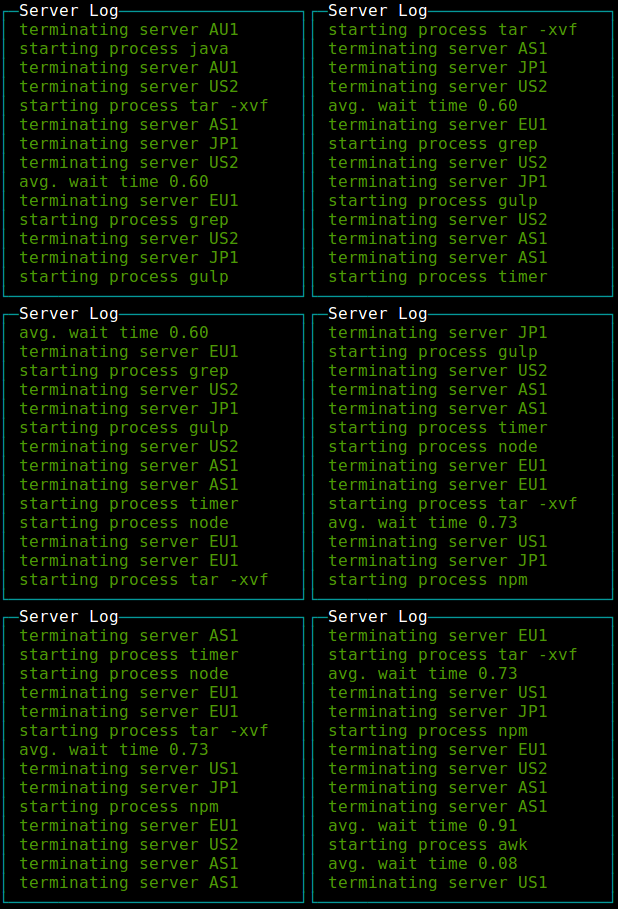
gauge.setPercent(25) var log = contrib.log(
{ fg: "green"
, selectedFg: "green"
, label: 'Server Log'})
log.log("new log line") var pic = contrib.picture(
{ file: './flower.png'
, cols: 25
, onReady: ready})
function ready() {screen.render()}note: only png images are supported
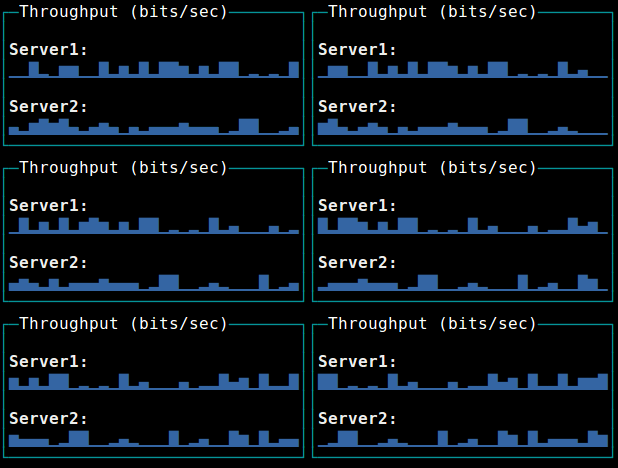
   var spark = contrib.sparkline(
     { label: 'Throughput (bits/sec)'
     , tags: true
     , style: { fg: 'blue' }})

   sparkline.setData(
   [ 'Sparkline1', 'Sparkline2'],
   [ [10, 20, 30, 20]
, [40, 10, 40, 50]]) var table = contrib.table(
{ keys: true
, fg: 'green'
, label: 'Active Processes'
, columnSpacing: 10 //in chars
, columnWidth: [16, 12, 12] /*in chars*/ })
//allow control the table with the keyboard
table.focus()
table.setData(
{ headers: ['col1', 'col2', 'col3']
, data:
[ [1, 2, 3]
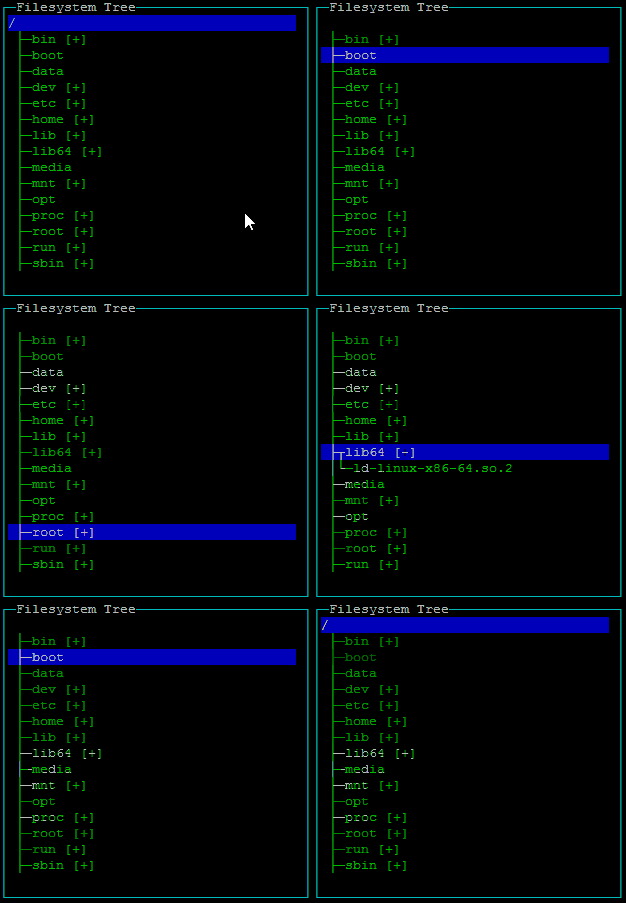
, [4, 5, 6] ]}) var tree = contrib.tree({fg: 'green'})
//allow control the table with the keyboard
tree.focus()
tree.on('select',function(node){
if (node.myCustomProperty){
console.log(node.myCustomProperty);
}
console.log(node.name);
}
// you can specify a name property at root level to display root
tree.setData(
{ extended: true
, children:
{
'Fruit':
{ children:
{ 'Banana': {}
, 'Apple': {}
, 'Cherry': {}
, 'Exotics': {
children:
{ 'Mango': {}
, 'Papaya': {}
, 'Kiwi': { name: 'Kiwi (not the bird!)', myCustomProperty: "hairy fruit" }
}}
, 'Pear': {}}}
, 'Vegetables':
{ children:
{ 'Peas': {}
, 'Lettuce': {}
, 'Pepper': {}}}}})- keys : Key to expand nodes. Default : ['enter','default']
- extended : Should nodes be extended/generated by default? Be careful with this setting when using a callback function. Default : false
- template :
- extend : Suffix "icon" for closed node. Default : '[+]'
- retract : Suffix "icon" for opened node. Default : '[-]'
- lines : Show lines in tree. Default : true
Every node is a hash and it can have custom properties that can be used in "select" event callback. However, there are several special keys :
- name
- Type :
string - Desc : Node name
- If the node isn't the root and you don't specify the name, will be set to hash key
- Example :
{ name: 'Fruit'} - children
- Type :
hashorfunction(node){ return children } - Desc : Node children.
- The function must return a hash that could have been used as children property
- If you use a function, the result will be stored in
node.childrenContentandchildren - Example :
- Hash :
{'Fruit':{ name: 'Fruit', children:{ 'Banana': {}, 'Cherry': {}}}} - Function : see
examples/explorer.js
- Hash :
- childrenContent
- Type :
hash - Desc : Children content for internal usage DO NOT MODIFY
- If
node.childrenis a hash,node.children===node.childrenContent - If
node.childrenis a function, it's used to store thenode.children()result - You can read this property, but you should never write it.
- Usually this will be used to check
if(node.childrenContent)in yournode.childrenfunction to generate children only once - extended
- Type :
boolean - Desc : Determine if this node is extended
- No effect when the node have no child
- Default value for each node will be
treeInstance.options.extendedif the nodeextendedoption is not set - Example :
{'Fruit':{ name: 'Fruit', extended: true, children:{ 'Banana': {}, 'Cherry': {}}}}
A grid layout can auto position your elements in a grid layout. When using a grid, you should not create the widgets, rather specify to the grid which widget to create and with which params. Each widget can span multiple rows and columns.
   var screen = blessed.screen()

   var grid = new contrib.grid({rows: 12, cols: 12, screen: screen})

   //grid.set(row, col, rowSpan, colSpan, obj, opts)
   var map = grid.set(0, 0, 2, 2, contrib.map, {label: 'World Map'})
   var box = grid.set(0, 6, 2, 2, blessed.box, {content: 'My Box'})

screen.render()A carousel layout switchs between differen views based on time or keyboard activity. One use case is office dashboard with rotating views
    var blessed = require('blessed')
      , contrib = require('./')
      , screen = blessed.screen()

    function page1(screen) {
       var map = contrib.map()
       screen.append(map)
    }

    function page2(screen) {
      var line = contrib.line(
       { width: 80
       , height: 30
       , left: 15
       , top: 12
       , xPadding: 5
       , label: 'Title'
       })

      var data = [ { title: 'us-east',
                 x: ['t1', 't2', 't3', 't4'],
                 y: [0, 0.0695652173913043, 0.11304347826087, 2],
                 style: {
                  line: 'red'
                 }
               }
            ]

      screen.append(line)
      line.setData(data)
    }

    screen.key(['escape', 'q', 'C-c'], function(ch, key) {
      return process.exit(0);
    });

    var carousel = new contrib.carousel( [page1, page2]
                                       , { screen: screen
                                         , interval: 3000 //how often to switch views (set 0 to never swicth automatically)
                                         , controlKeys: true  //should right and left keyboard arrows control view rotation
                                         })
carousel.start()Running the sample
git clone https://github.com/yaronn/blessed-contrib.git
cd blessed-contrib
npm install
node ./examples/dashboard.js
Installation (for a custom dashbaord)
npm install blessed
npm install blessed-contrib
A simple dashboard
   var blessed = require('blessed')
     , contrib = require('blessed-contrib')
     , screen = blessed.screen()
     , grid = new contrib.grid({rows: 1, cols: 2, screen: screen})

   var line = grid.set(0, 0, 1, 1, contrib.line,
     { style:
       { line: "yellow"
       , text: "green"
       , baseline: "black"}
     , xLabelPadding: 3
     , xPadding: 5
     , label: 'Stocks'})

   var map = grid.set(0, 1, 1, 1, contrib.map, {label: 'Servers Location'})

   var lineData = {
      x: ['t1', 't2', 't3', 't4'],
      y: [5, 1, 7, 5]
   }

   line.setData([lineData])

   screen.key(['escape', 'q', 'C-c'], function(ch, key) {
     return process.exit(0);
   });

   screen.render()
Rich dashboard
See source code
This library is under the MIT License

