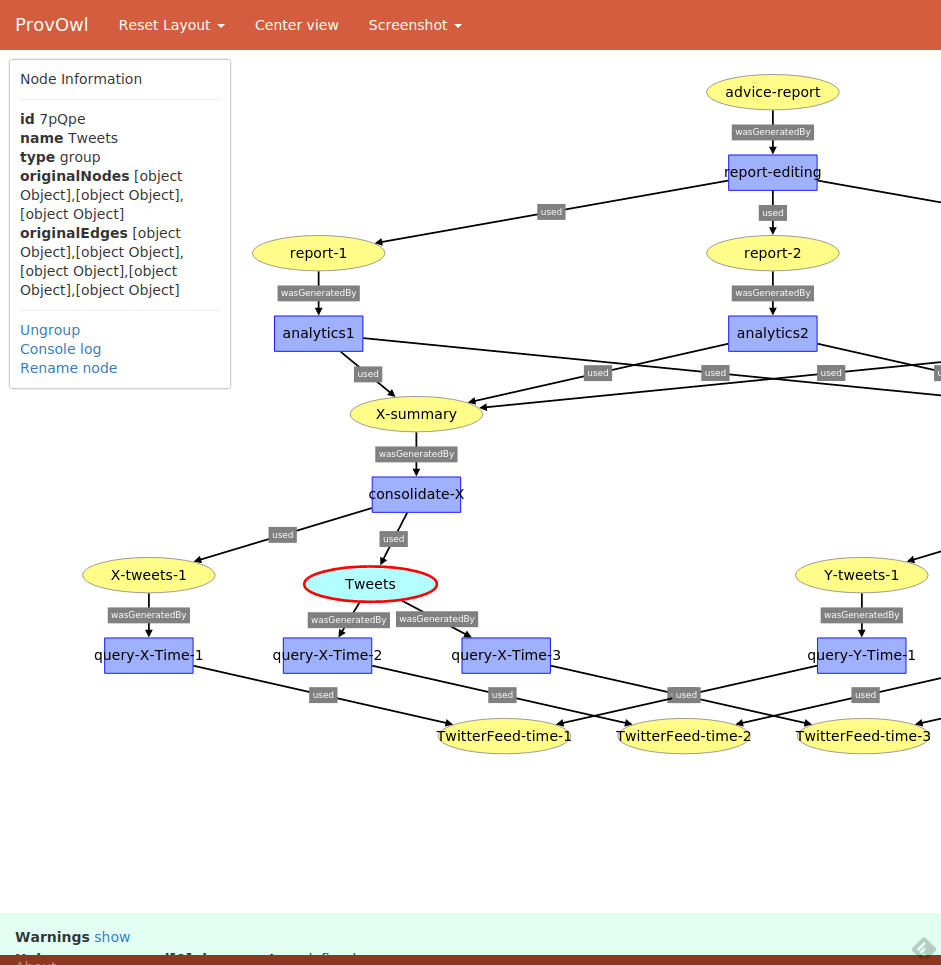
ProvOwl is a provenance visualiser. It renders provenance files in the PROV format (https://www.w3.org/TR/prov-overview/) into DAG graph that can be explored and interacted with. The primary feature at the moment is that of clustering, allowing nodes to be selected and grouped into a composite node for simplification of the graph.
There's a version of ProvOwl running at http://provowl.com/
ProvOwl only supports provenance information in the PROV format. You can view the standard over at https://www.w3.org/TR/prov-overview/. You can also find example provenance graphs in the prov-example directory.
Access the website (either locally or at provowl.com) and click the "Select Prov File" button, using the file selector find the provenance file you would like to explore.
When you click ok the file will be locally loaded and rendered into the webpage. A warnings bar at the bottom of the graph will show any lines that couldn't be interpreted. You should now be able to move around by clicking and dragging as well as selecting nodes by clicking or mutliple nodes by holding down control.
You can save an image of the graph in it's current state by using the screenshot options.
In order to compile sass files run the following gulp command:
gulp styles
You should then be able to view the website in development by using the src directory as the website root.
Running the following:
gulp production
Will copy and compile files into a public_html directory that you can then use as the root of deployment server.