Data Visualisation Web App
With enormous data in hand you would always want to visualize it for good understanding and better clarity with minimal efforts.
As the famous saying goes - "The greatest value of visualization is when it forces us to notice what we never expected to see" - John W. Tukey
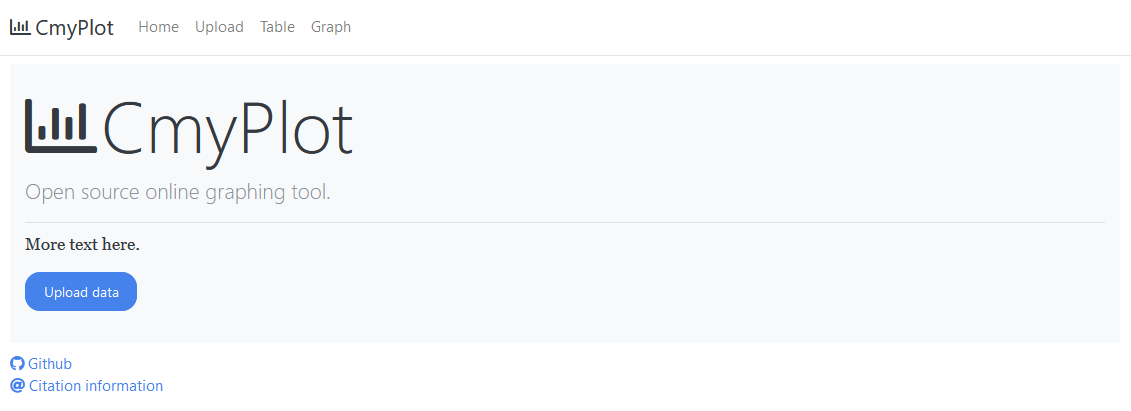
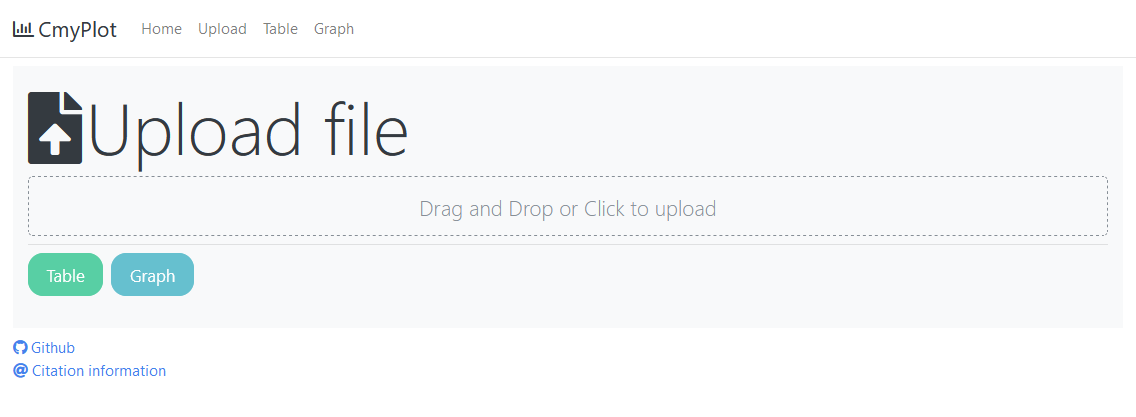
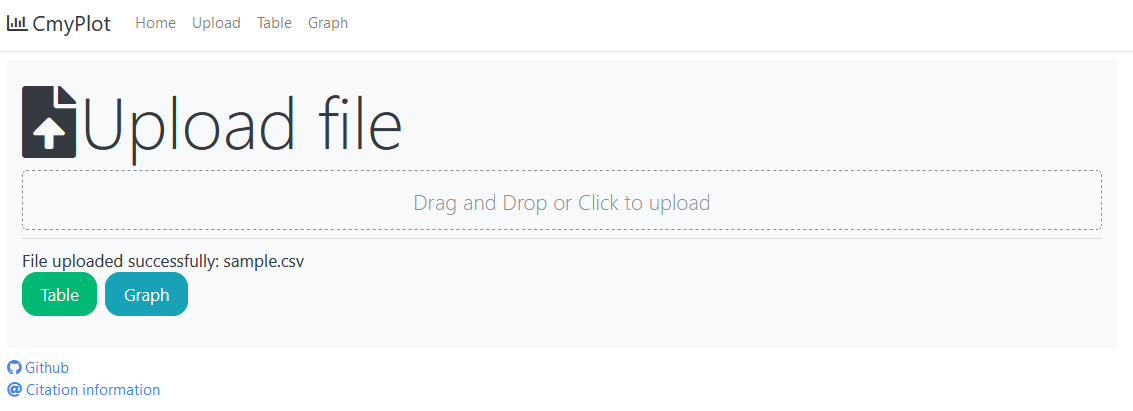
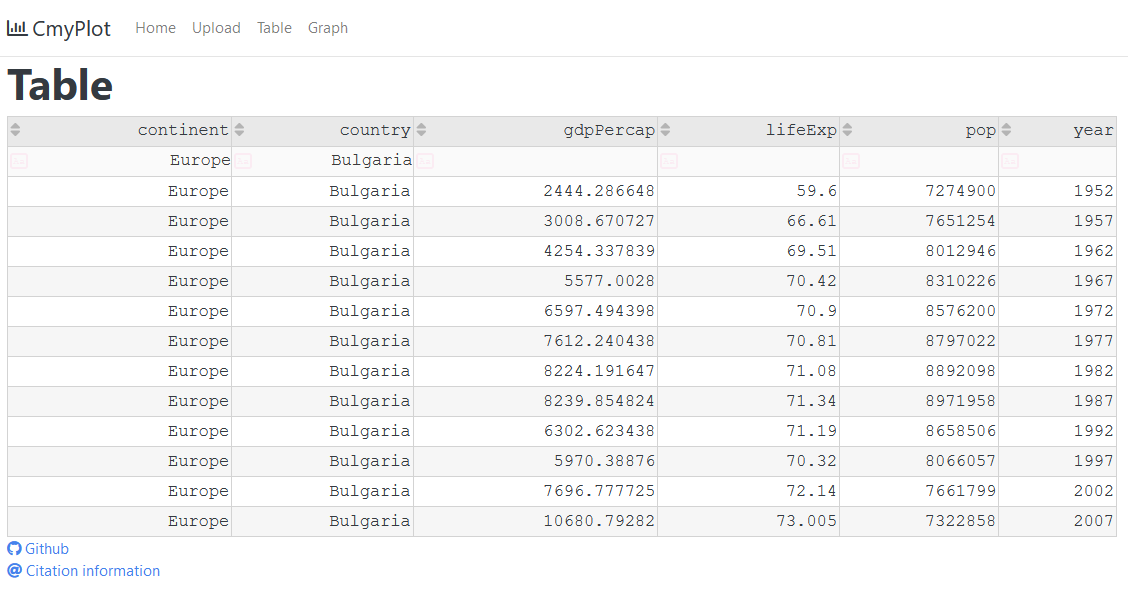
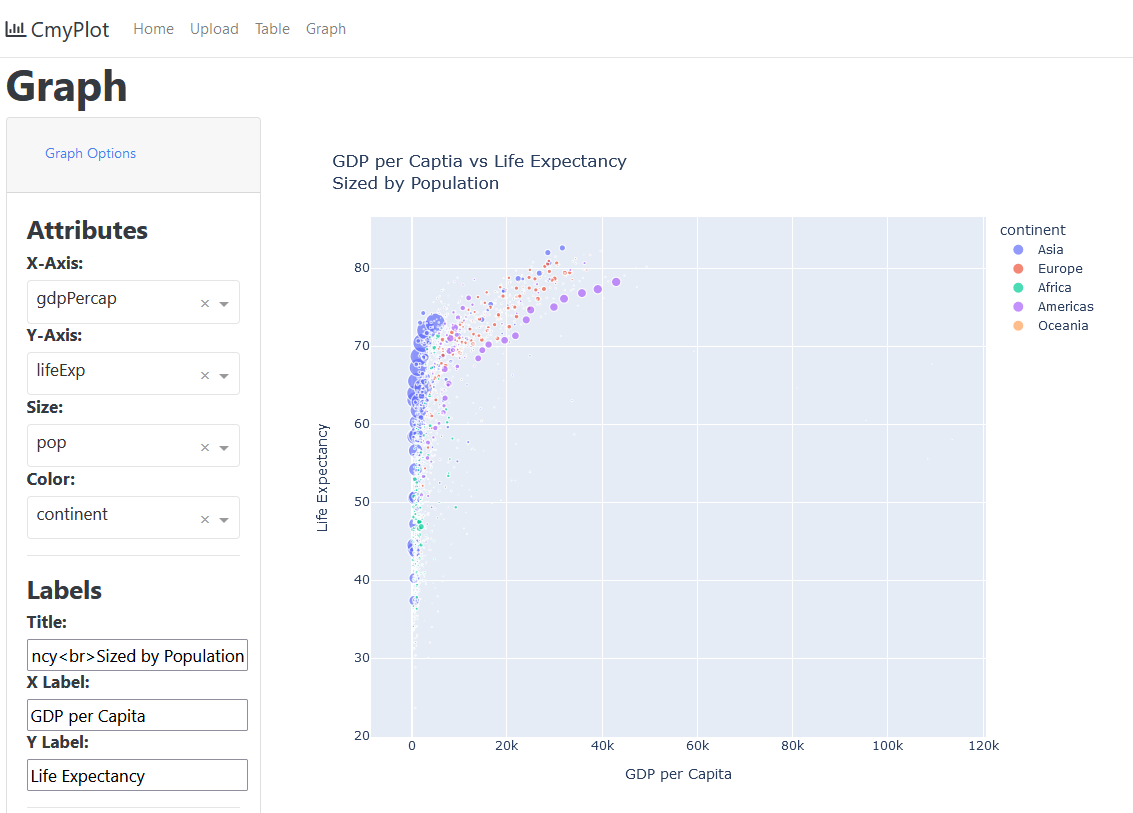
CmyPlot is a web app that provides interface for uploading a csv data file and convert it into Tables and interesting graphs with one click
cmyplotdemo.mp4
-
- Download Python3.x on your system.
-
E.g If you downloaded
Python 3.9.7above, thenSteps to setup virtual environment
-
Create a virtual environment:
python3.9 -m venv project1_env -
Activate the virtual environment:
source project1_env/bin/activate -
Build the virtual environment:(must be present in project directory)
pip install -r requirements.txt
-
-
To run/test the site locally:
-
Clone this (CmyPlot) github repo.
-
Navigate to project directory.
-
Create a virtual environment:
python -m venv project1_env -
Activate the virtual environment:
source project1_env/bin/activate -
Build the virtual environment:
pip install -r requirements.txt -
Install CmyPlot as package, this step is required due to the testing framework:
pip install -e . -
Run:
python src/plotting/index.py -
Site will be hosted at:
http://127.0.0.1:8085/
-


