Contents
This code is for manipulating data stored in multiple shapefiles and csv format files to make them amenable to the RunDMCMC project. Currently supported functionality includes:
- Generating a quick report on shapefiles including column data and stats on the underlying geographic units
- Proration: the process of applying voting/demographic data from one set of geographic units (e.g. counties) to another (e.g. precincts). This is done proportionally to either the area of overlap, or the population in the overlap between geographic units.
- Roundoff: When a districting plan does not respect precinct/county lines, this process wiggles the boundaries of the districts until they do align.
This tab allows for an easy get-to-know your data option.
- To merge data from a csv, check the merge csv data button, add the file, and specify the column name. This will perform a SQL-style join on the original shapefile and the csv data file. It matches each entry in the shapefile with a row in the csv by matching the Column Name from the shapefile and the CSV ID specified for the csv.
- To generate a report that has the names of the columns in the shapefile, a plot of the file itself, and summary statistics on the geometry of the geographic units involved, click the
Merge & Report!button- For a report that has more in-depth data about specific columns in the shapefile, type the names of those columns, comma separated, in the orange box.
To view the report, open the file titled Report_on_<FILE>.html where <FILE> is the name of the original shapefile
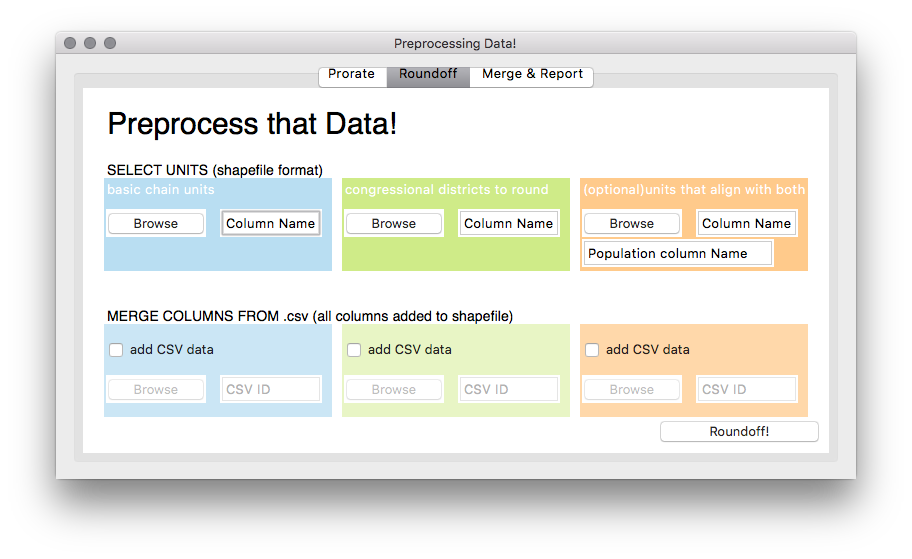
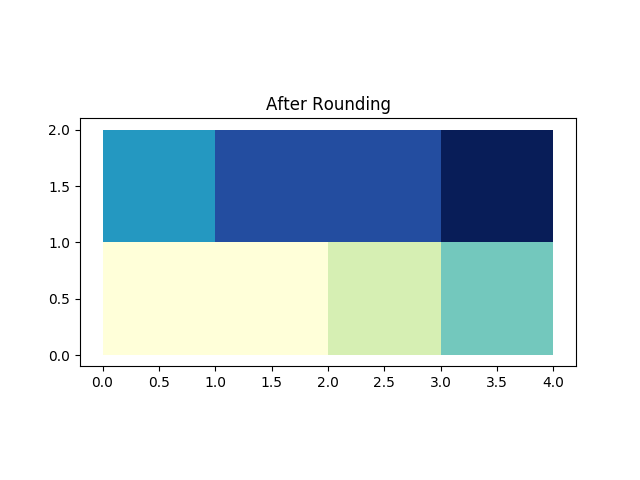
When 2 maps align, but the lines drawn on them don't, it can be useful to round the units of one into the other.
This process creates 2 files: a report and a shapefile, both located in the Preprocessing/ folder. These files are called Roundoff.html and Rounded.shp respectively.
The shapefile is based on the geographic units and data
in the basic chain units shapefile, but with an added column: CD.
This contains the value from the Column Name column in
the congressional districts to round file that most closely
corresponds to the units in basic chain units
The report contains data about the process of rounding off. Specifically, how many of the geographic units did not align well, and the general characteristics of the two shapefiles being used.
In the test_files/ folder, there are 2 useful shapefiles: biggestUnits.shp and basicUnits.shp
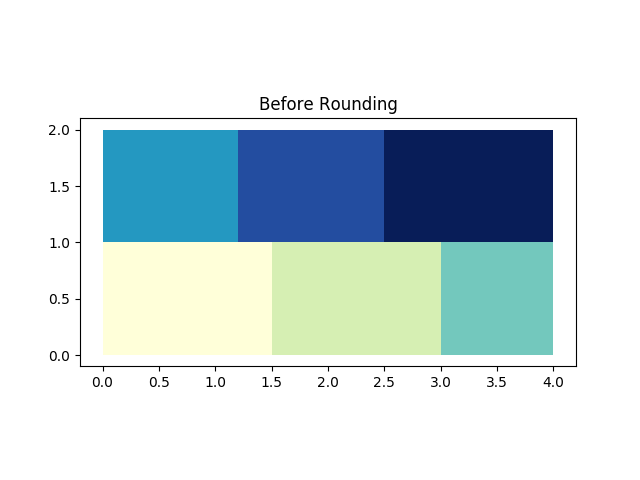
The biggestUnits.shp file covers all of basicUnits.shp, but the units do not overlap with the boundaries of basicUnits perfectly.
| biggestUnits.shp | basicUnits.shp |
|---|---|
 |
 |
In order to get an association where each unit in
basicUnits.shp is assigned to a unit in biggestUnits.shp, we
launch the GUI and in the blue (basic chain units) field,
navigate to the basicUnits.shp file. This file has a column
called ID that gives a unique identifier for each unit in
the file. Type ID into the Column Name field for basic chain units.
Now use the biggestUnits.shp file in the green field with
the unique identifier column BID and click Roundoff!
This generates the report and shapefile!
biggest Units Before Rounding |
biggest Units Rounded to Basic |
|---|---|
 |
 |
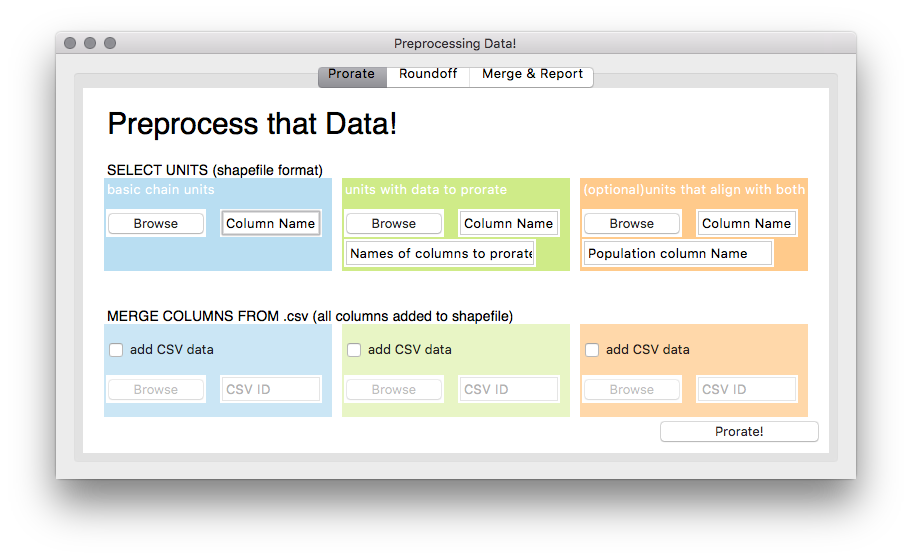
To prorate data from one shapefile to another, you need the two shapefiles as well as the names of the columns that have data to be copied from one to the other, and a column name for each shapefile that will uniquely identify each element so that the assigning of vote values to each element is well-defined.
The process returns a new shapefile based on the original
basic chain units shapefile with added vote data that has been
assigned proportionally by area of overlap from the
file specified in units with data to prorate. It also creates
a report that tallies the prorated data in each shapefile to make sure
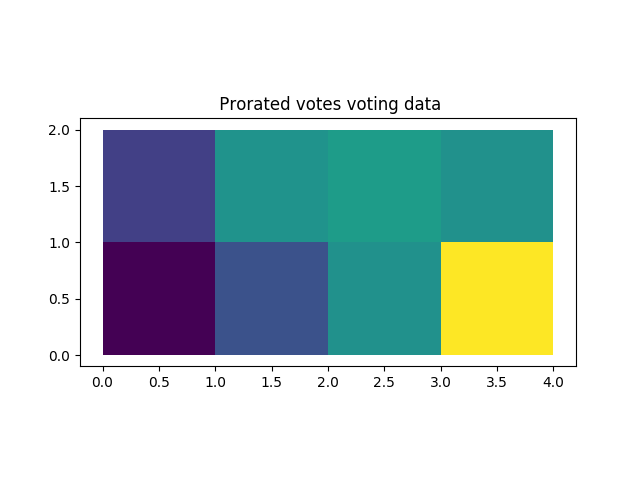
that no data was lost, and generates graphics of the results.
As in the previous example, we will use the two files biggestUnits.shp and basicUnits.shp, in the test_files/ folder.
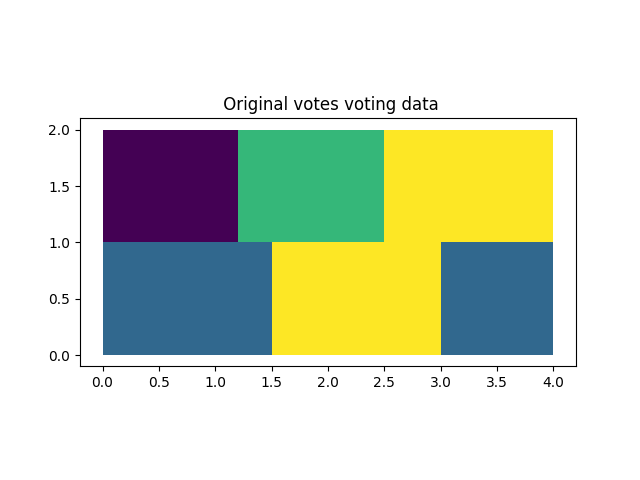
Note that biggestUnits.shp has a column called votes that stores some vote data for a made-up election. This vote data needs to be assigned to the basicUnits.shp units proportionally.
As before, for the blue basic chain units field,
use the browse button to choose basicUnits.shp, and
use ID as the Column Name for a unique ID to add data to.
Now use the biggestUnits.shp file in the green field with
the unique identifier column BID. The vote data we want to
add is stored in the column votes, so type votes in the
field Names of columns to prorate and click Prorate!
This generates the report and shapefile!
biggest Units with vote data |
basic Units with rounded data |
|---|---|
 |
 |
Note that sometimes the data to prorate does not actually live on the shapefile itself, but is in a separate csv file. In this test case, there is additional vote data in the file test_files/biggerUnitsData.csv.
We will merge the csv into the biggestUnits.shp file and
prorate directly onto basicUnits by checking the add CSV data
button in the green field and navigating to that file.
To merge, we need a column in the csv that will match
the ID column for biggestUnits.shp. In this case, the
name of the matching column is IDCOL. Add this to
the CSV ID field and then add the names of the
columns to prorate from this file to the list in the
field Names of columns to prorate, and click Prorate!
To use this code for any of the above options, open a terminal, navigate to the Preprocessing folder in terminal, and type
python main.pyThis launches an interactive prompt with 3 tabs, one for each of the proeccesses that can be done.
Note
this code produces reports for each process, as well as new shapefiles with added data if either proration or roundoff is used. These are automatically stored in the Preprocessing/ directory.
This code does not require any special installation to use. However, it does use geopandas, pandas, matplotlib, tkInter, and numpy. Prior to downloading and attempting to run, all of these libaries will need to be installed. After this, clone/download the repository to an easily accessible location, and start running!
In all of the notes above, the prorating and rounding were done based on the area of overlap between the biggestUnits and basicUnits. For certain cases, this is not perhaps the best way to assign boundaries. For example, when allocating votes, it can be helpful to consider the underlying distribution of population within the areas of overlap between basicUnits and biggestUnits and assign proportionally to the population in the overlap rather than the area of the overlap. To do this, we need a 3rd shapefile that has smaller units in common with both basicUnits and biggestUnits, that has population as well. This is what the orange field in both the proration and roundoff tabs are for. For more information on how to do population weighted proration and roundoff, see the documentation.

