https://public.tableau.com/profile/kay.royo#!/vizhome/citibike_analytics/NYCBIKEANALYSIS
https://us-west-2b.online.tableau.com/#/site/kayr/workbooks/250727?:origin=card_share_link
Since 2013, the Citi Bike Program has implemented a robust infrastructure for collecting data on the program's utilization. Through the team's efforts, each month bike data is collected, organized, and made public on the Citi Bike Data webpage. The downloaded dataset includes the recorded data for March, April, May, and June 2020.
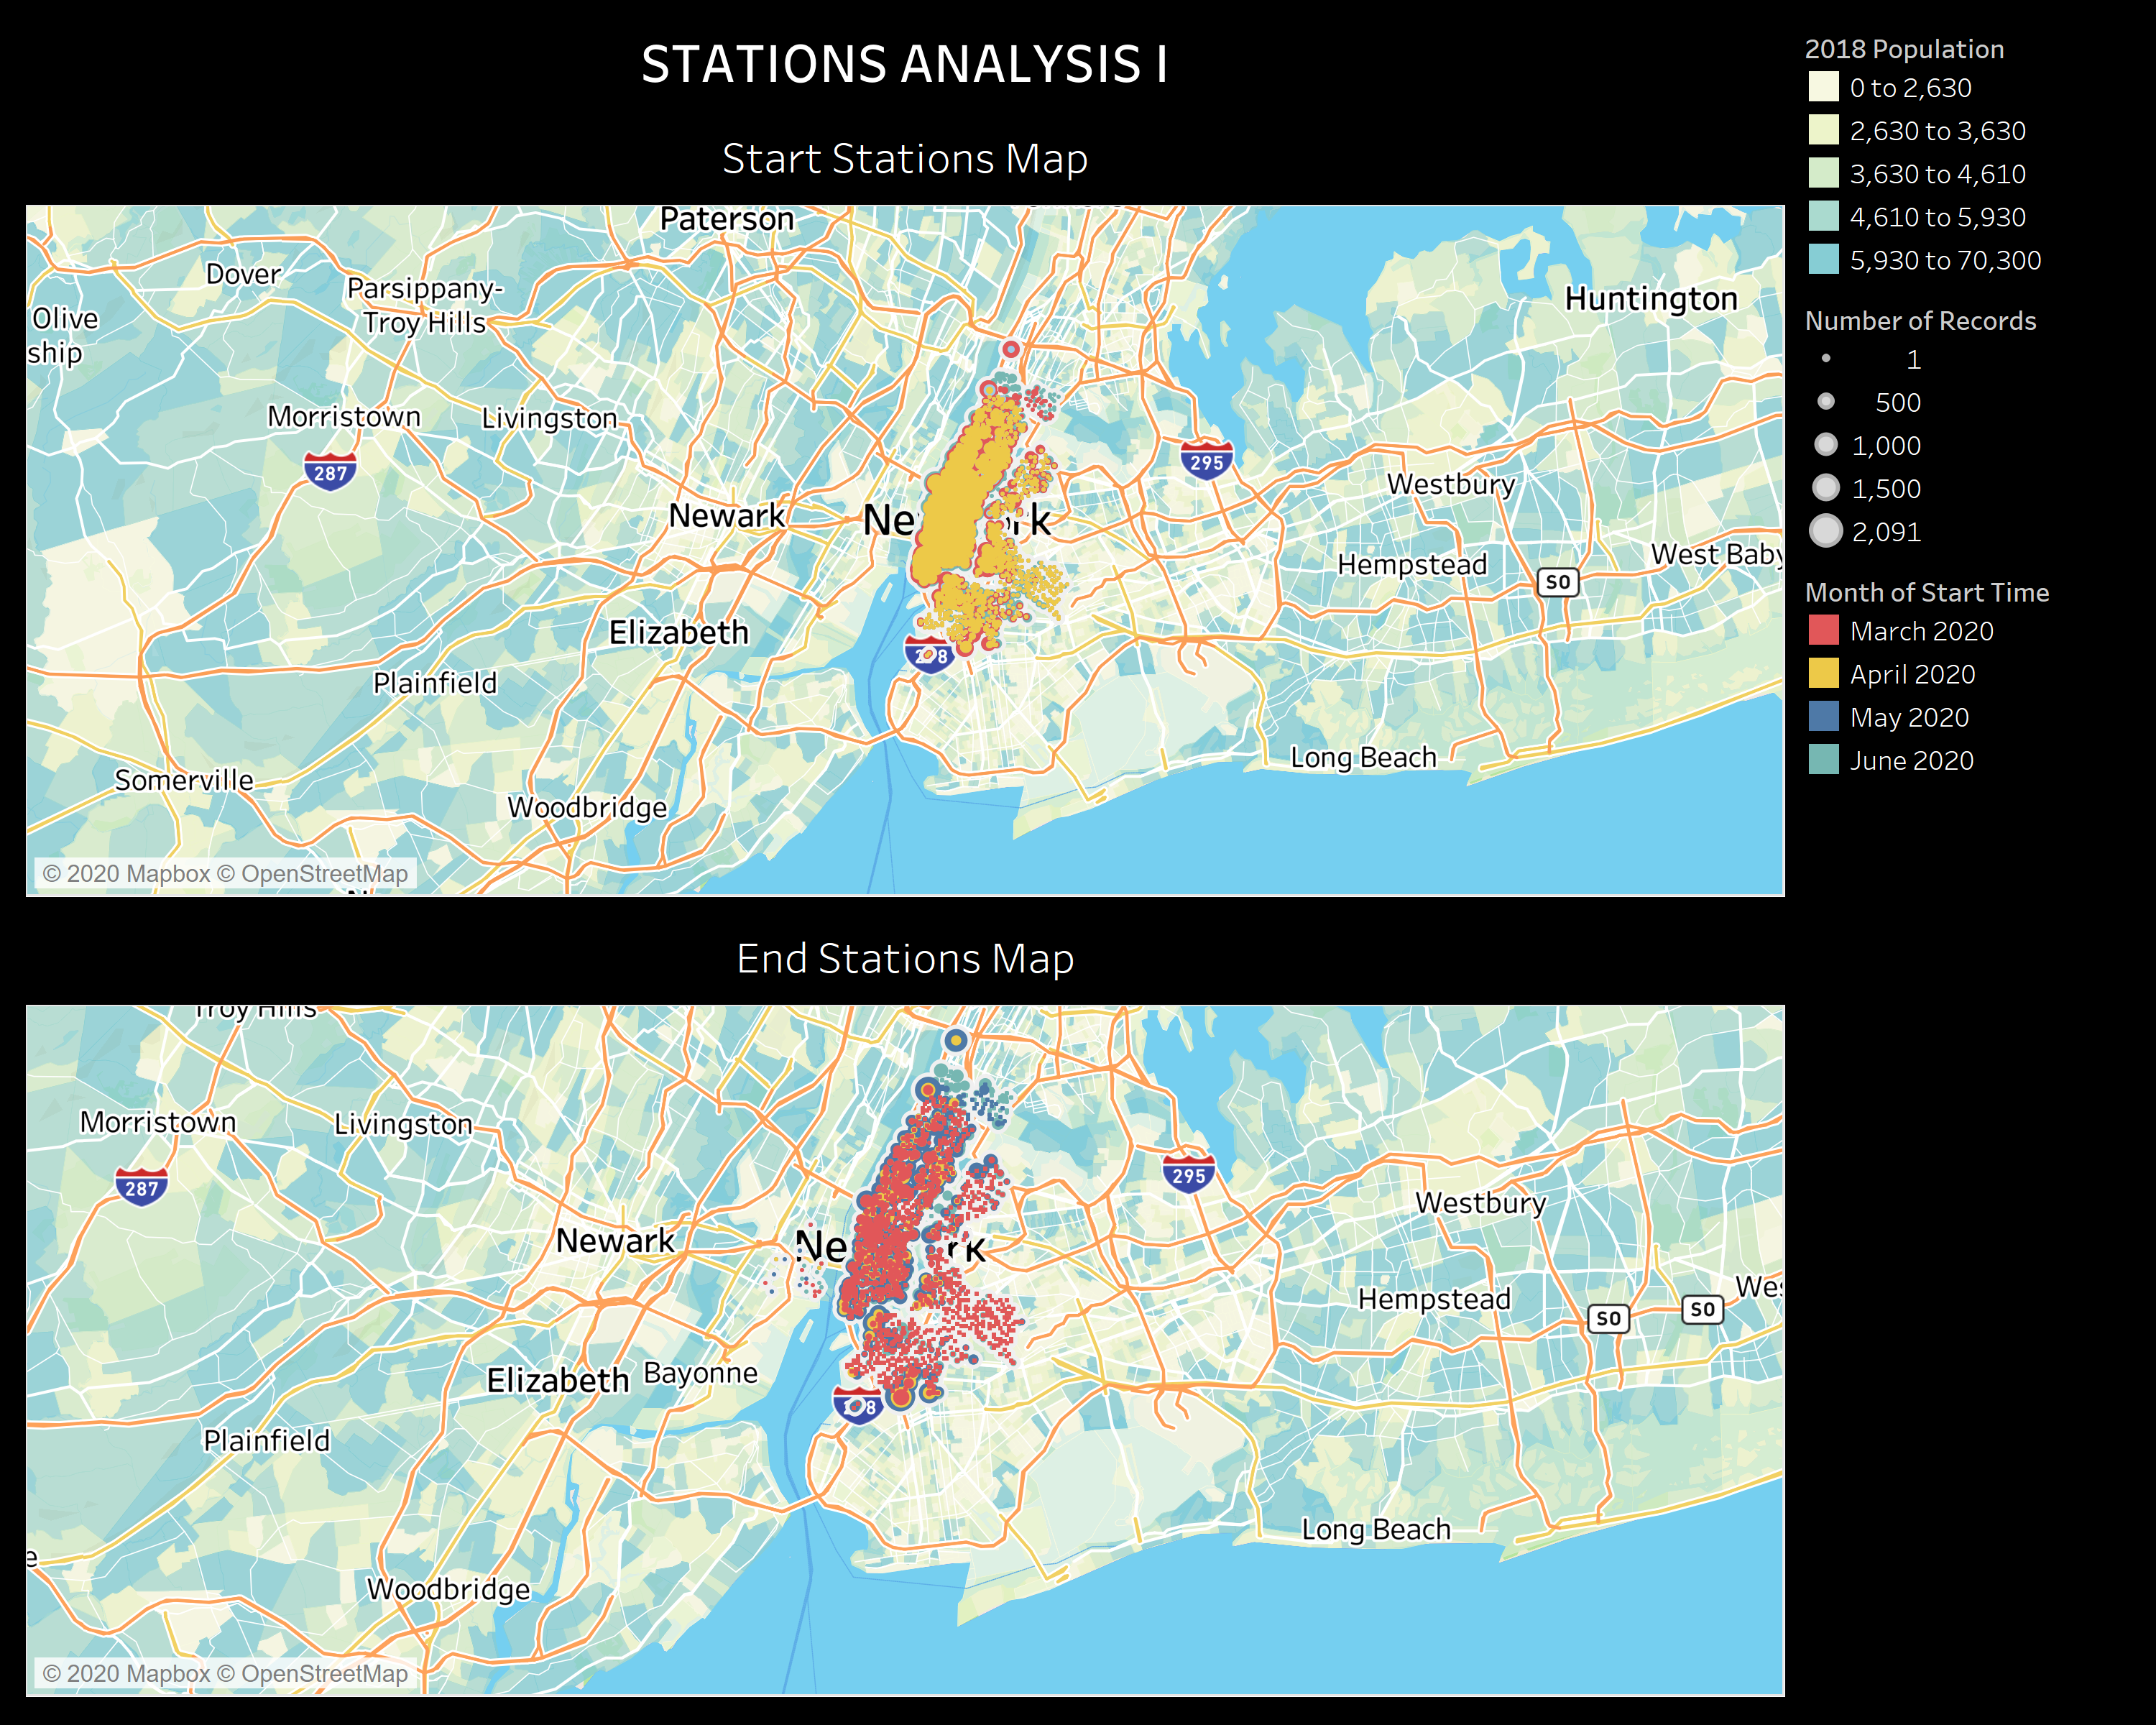
The maps show the locations of the start and end stations. The size of the markers is determined by the number of records for each station.
- The comparison between two maps reveals that the end stations are slightly more scattered than the start stations.
- There are more records for start stations during the first two months (March and April) of the Covid-19 lockdown than May and June.
- During the last two months of the lockdown (May and June), the start stations' number of records are lower and higher for some of the end stations than previous months.
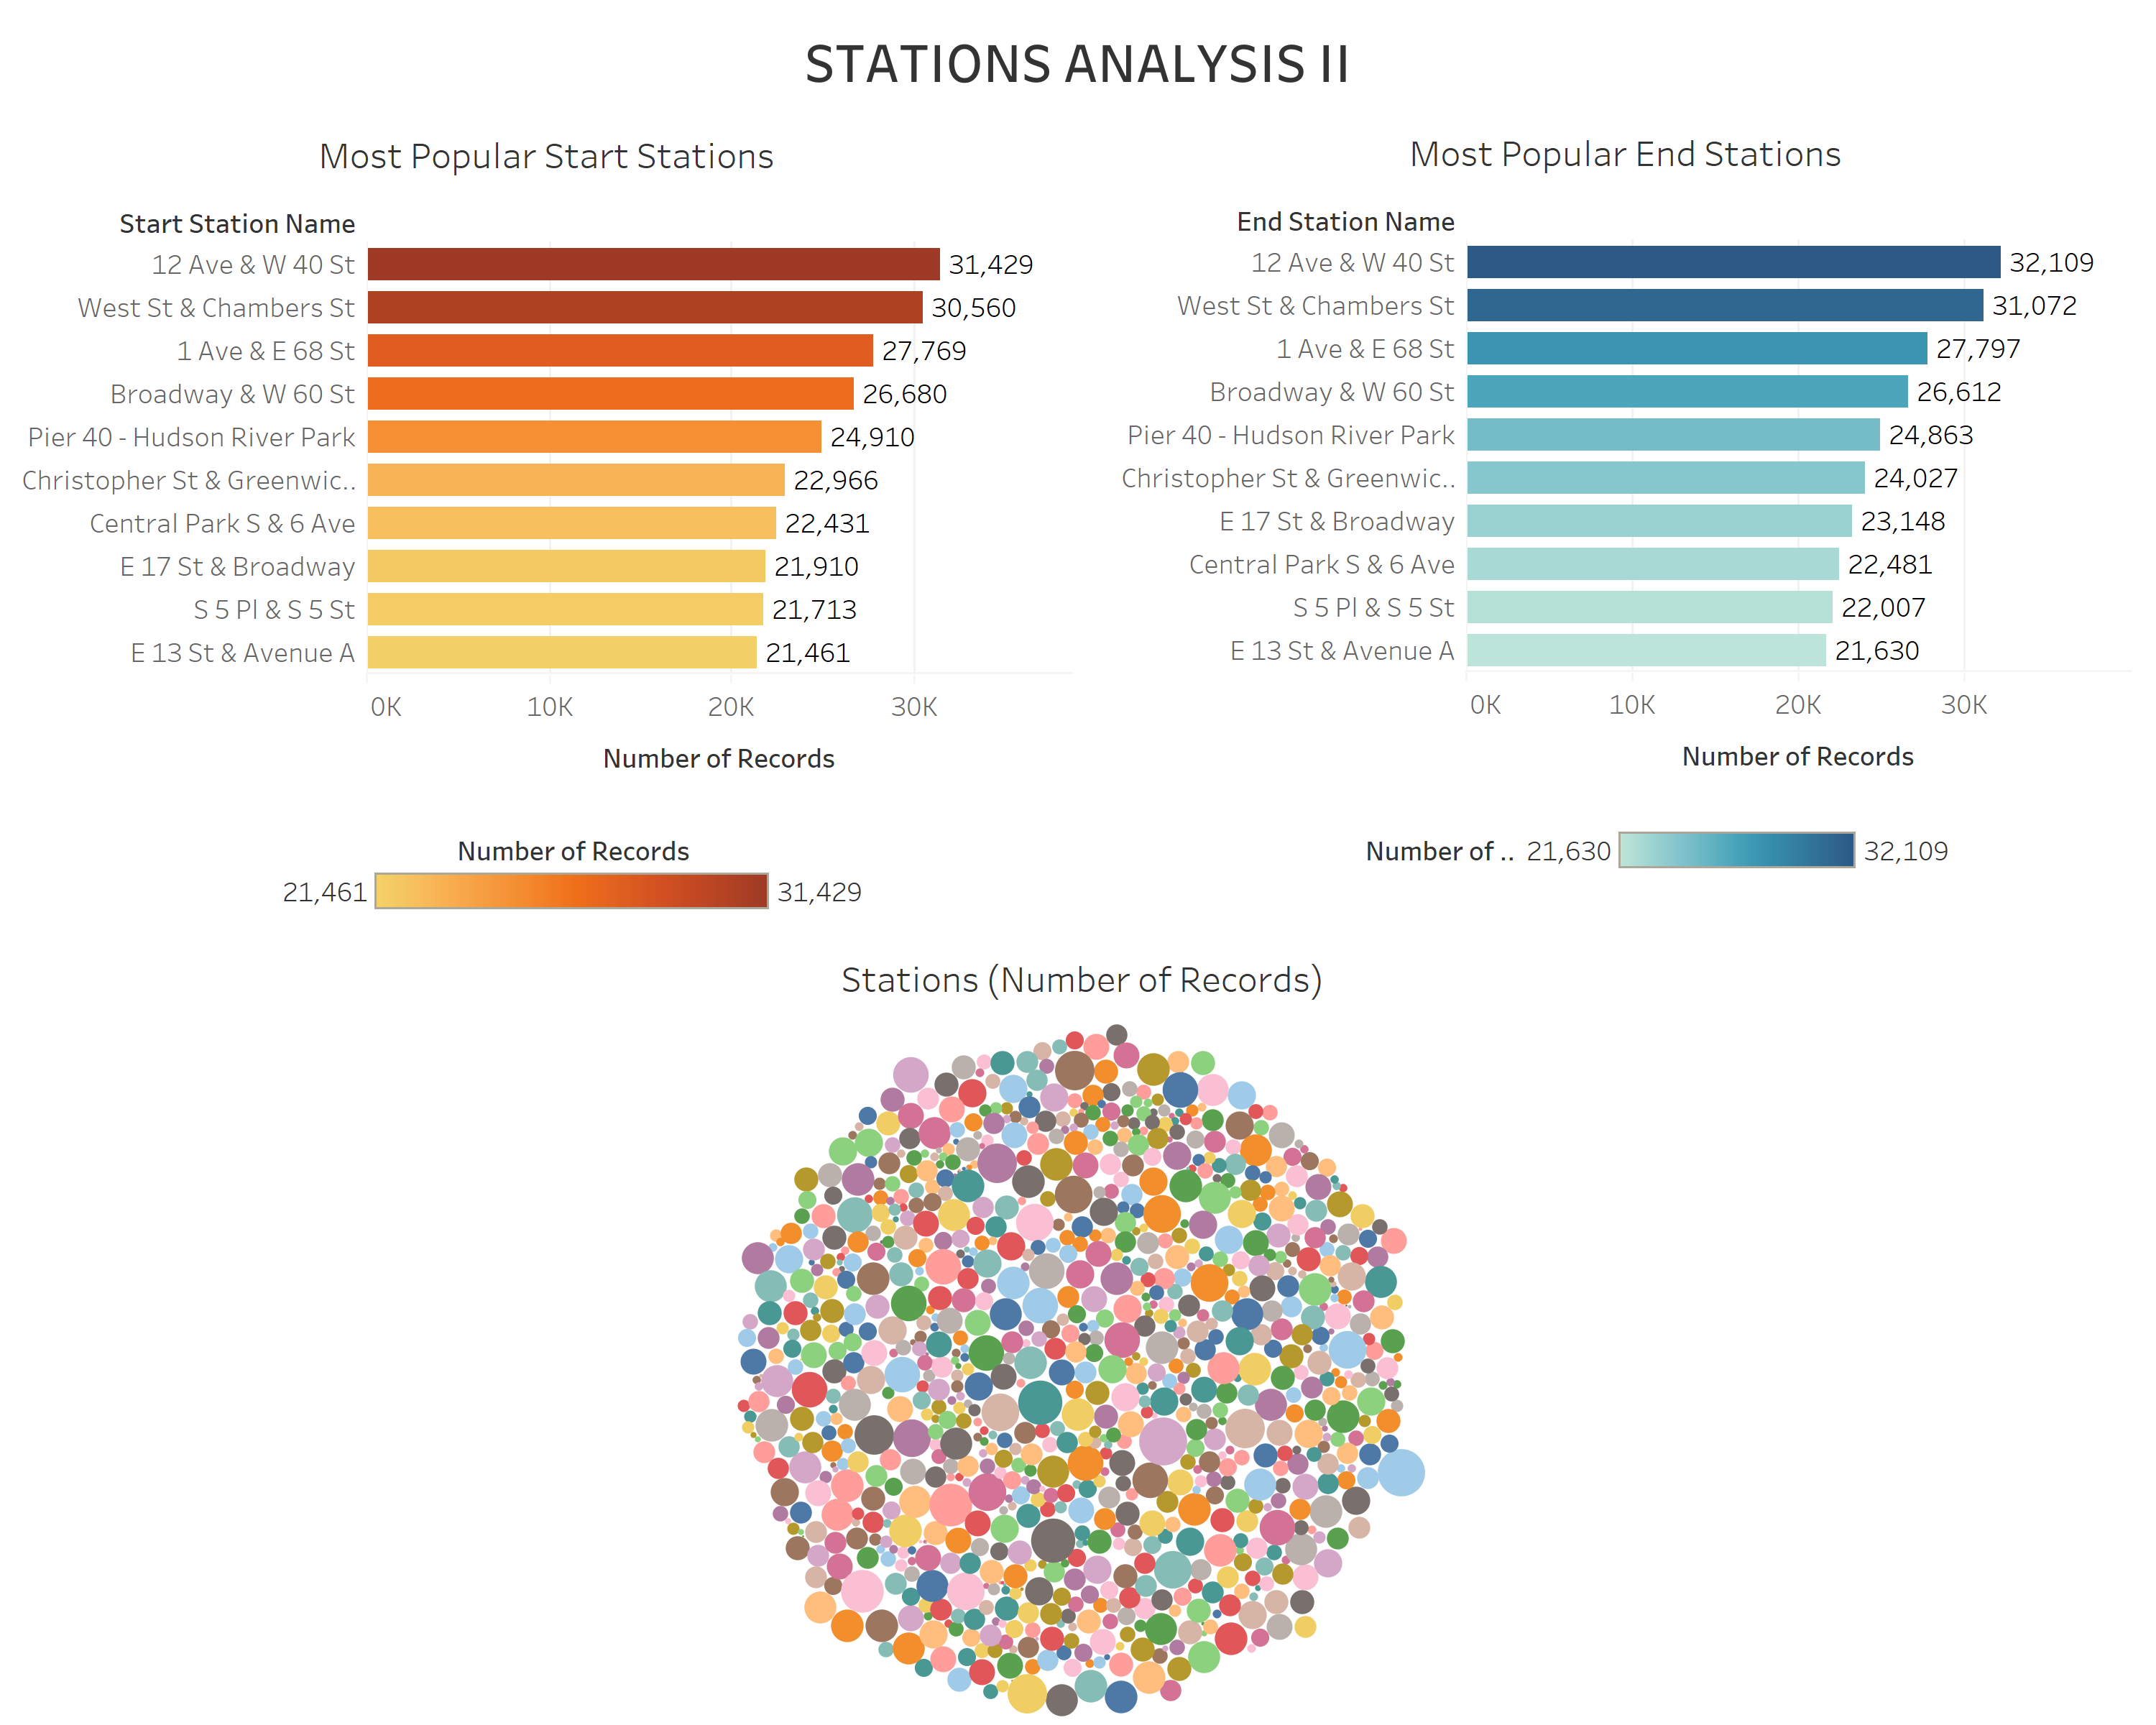
- The most popular start and end stations are located in the central part of the city.
- The top 10 most popular stations remain the same for both start and end.
- The most popular station (12 Ave & W 40 St) has over 30,000 number of records
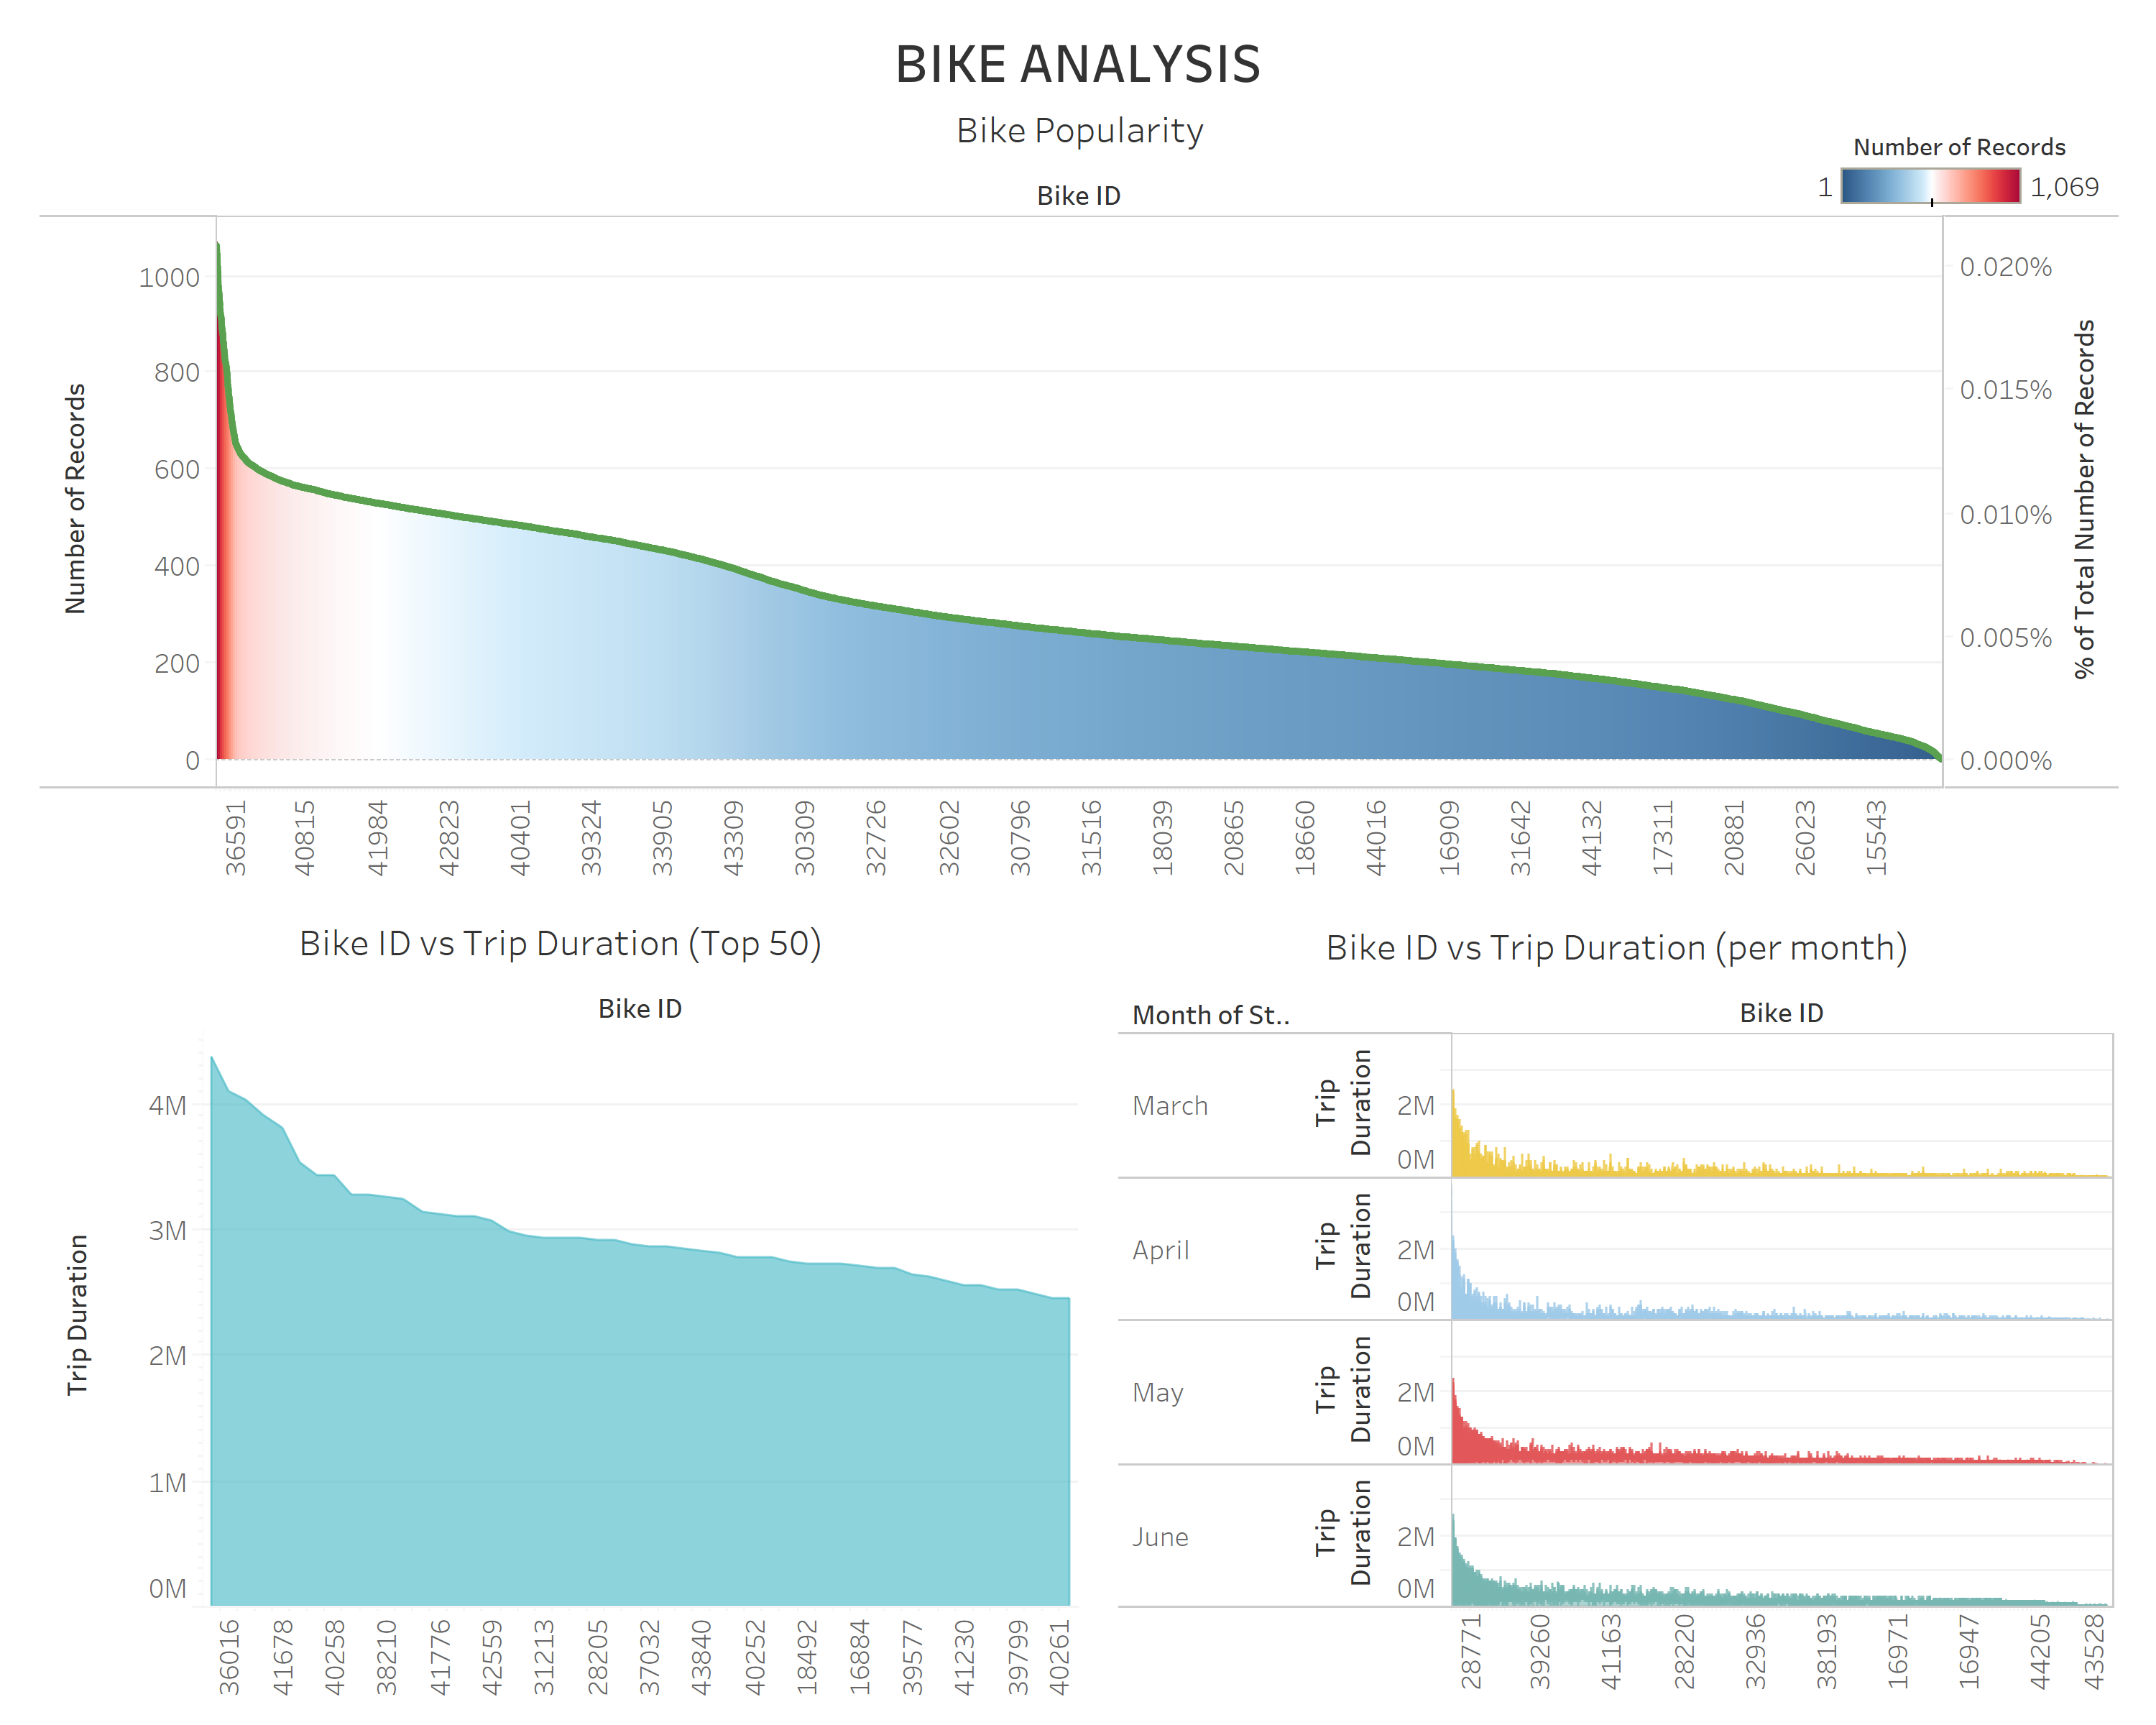
- The most popular bike has more than 1,000 number of records from March-June 2020.
- Bike ID 30627 has the highest trip duration based on the March-June 2020 data.
- Bike ID 36552 has the highest number of records (March-June 2020).
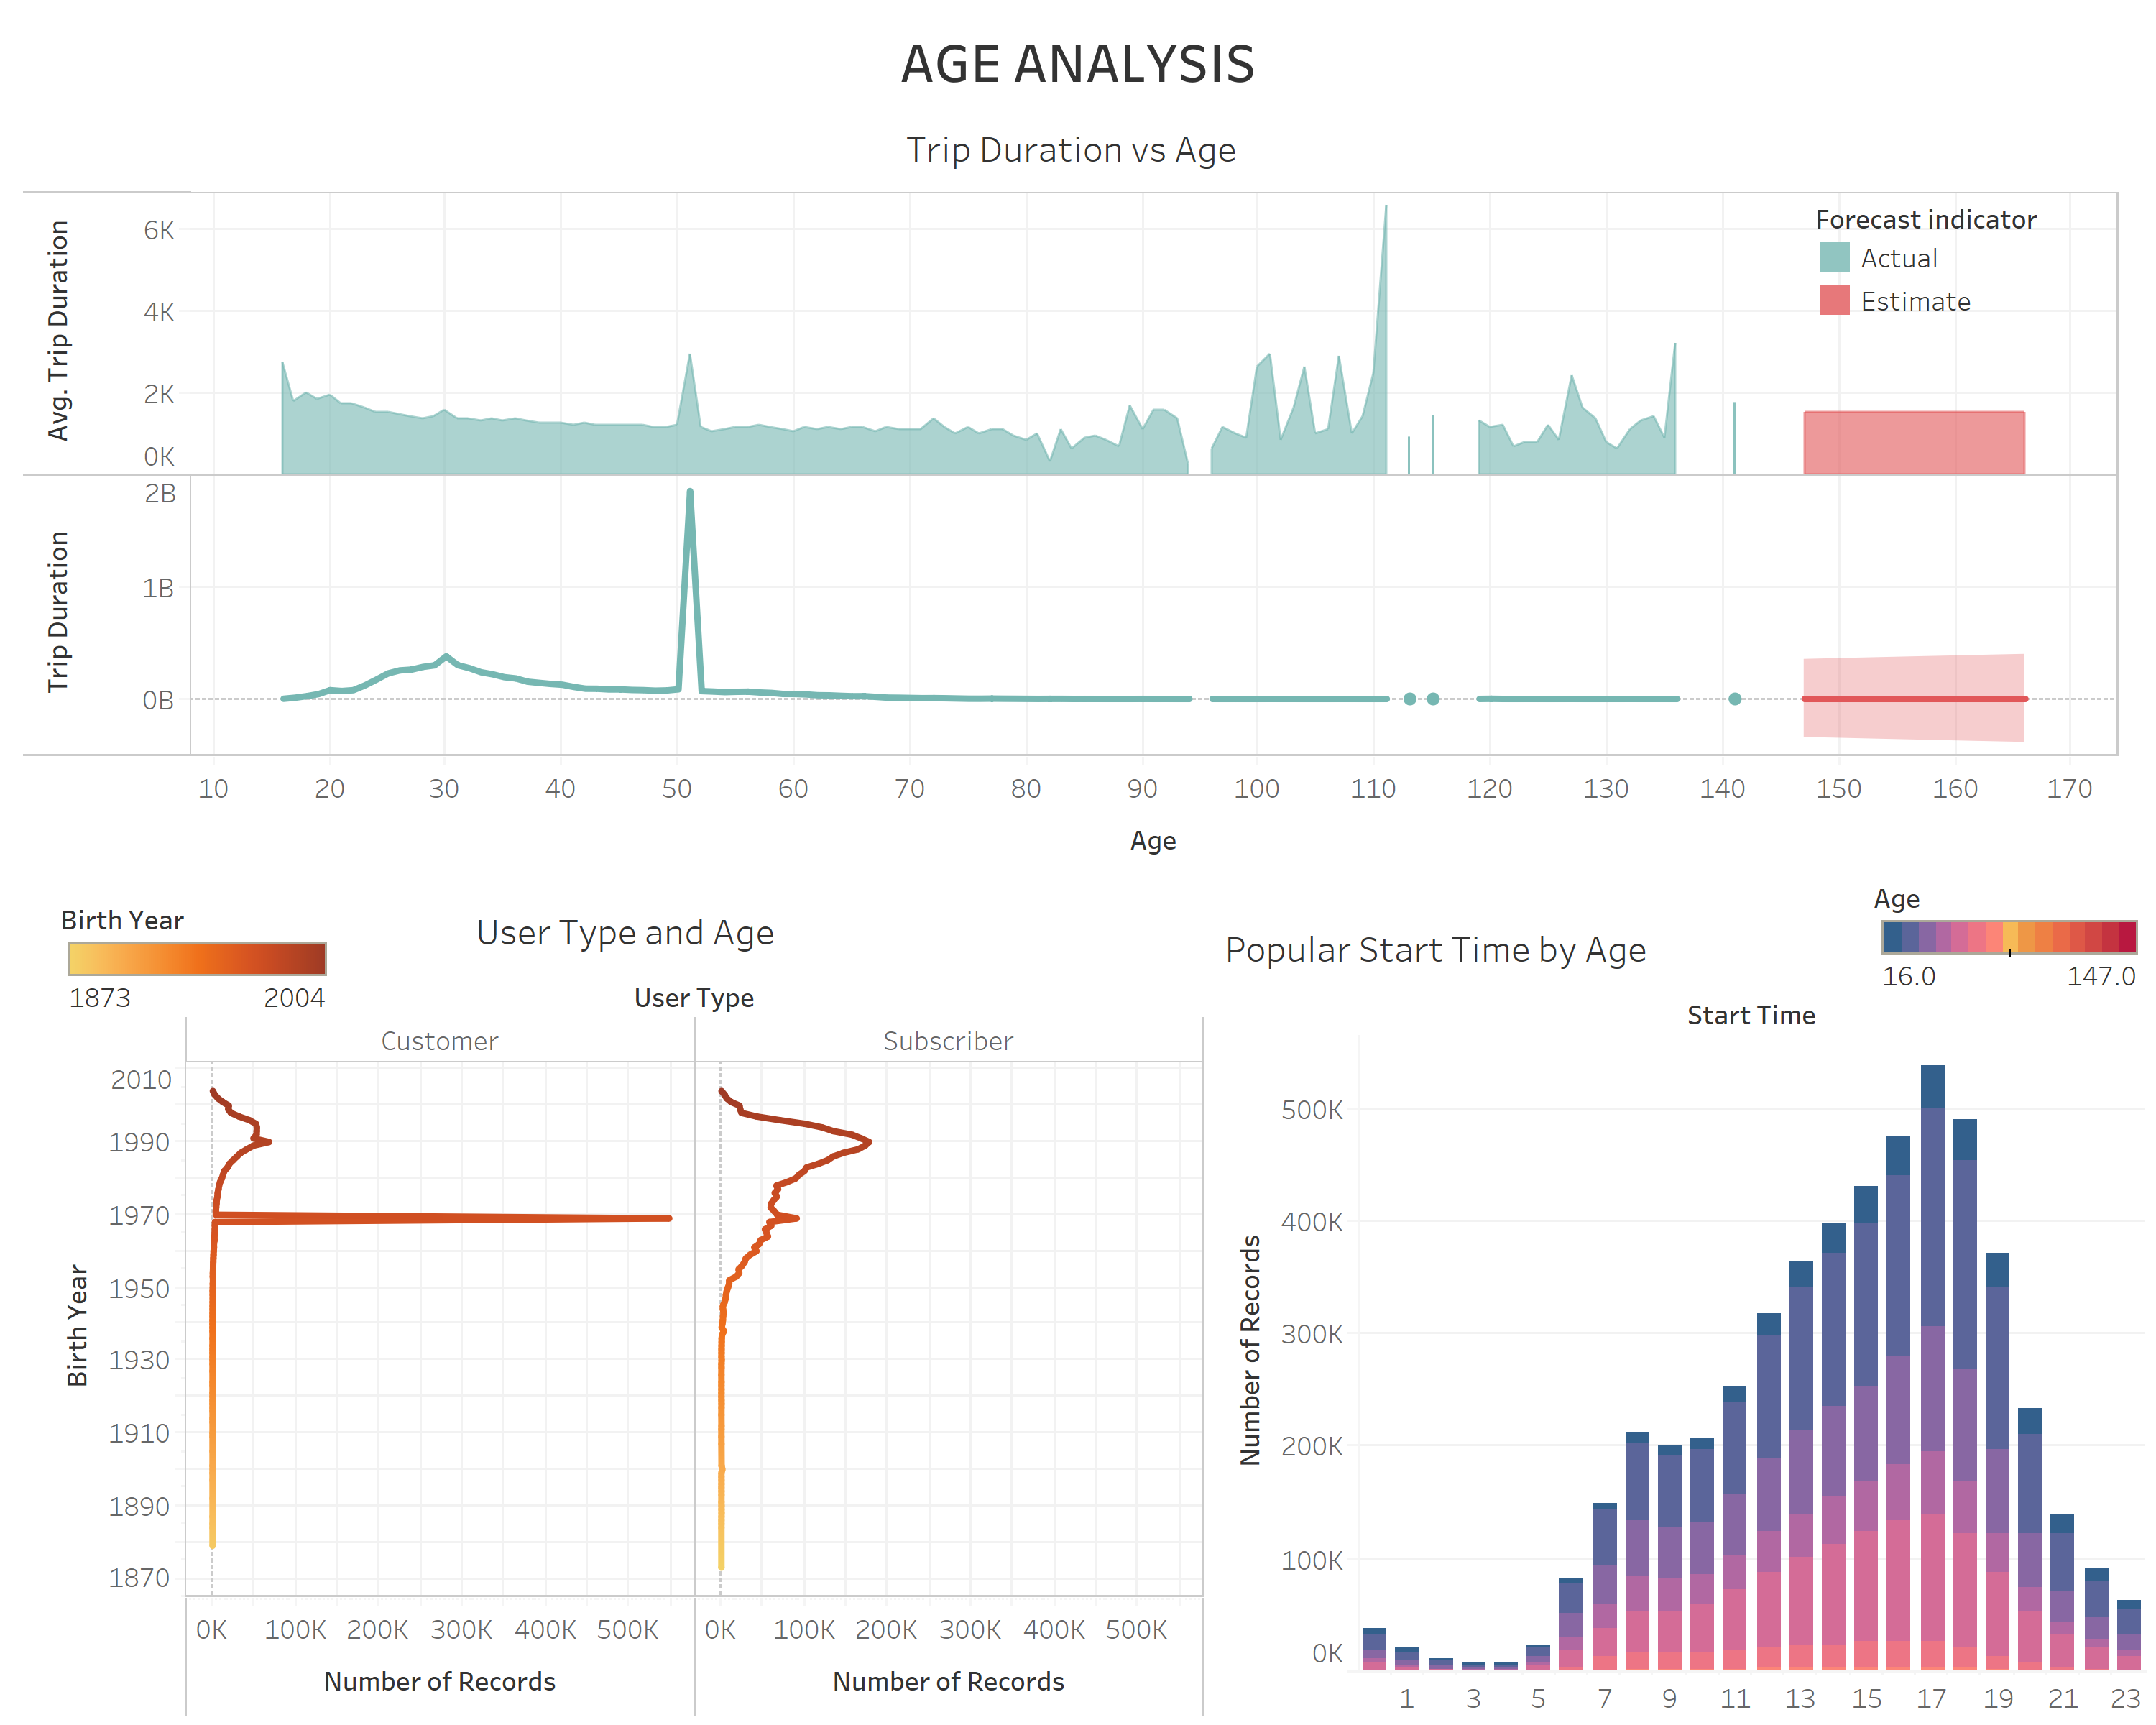
- The highest trip duration during the 4-month Covid-19 lockdown is at age 51.
- The peak at age 111 for average trip duration can be determined as erroneous.
- There are more costumers than subscribers at age 50.
- There are more subscribers than costumers at age 30.
- There number of subscribers and costumers is roughly the same for ages older than 50.
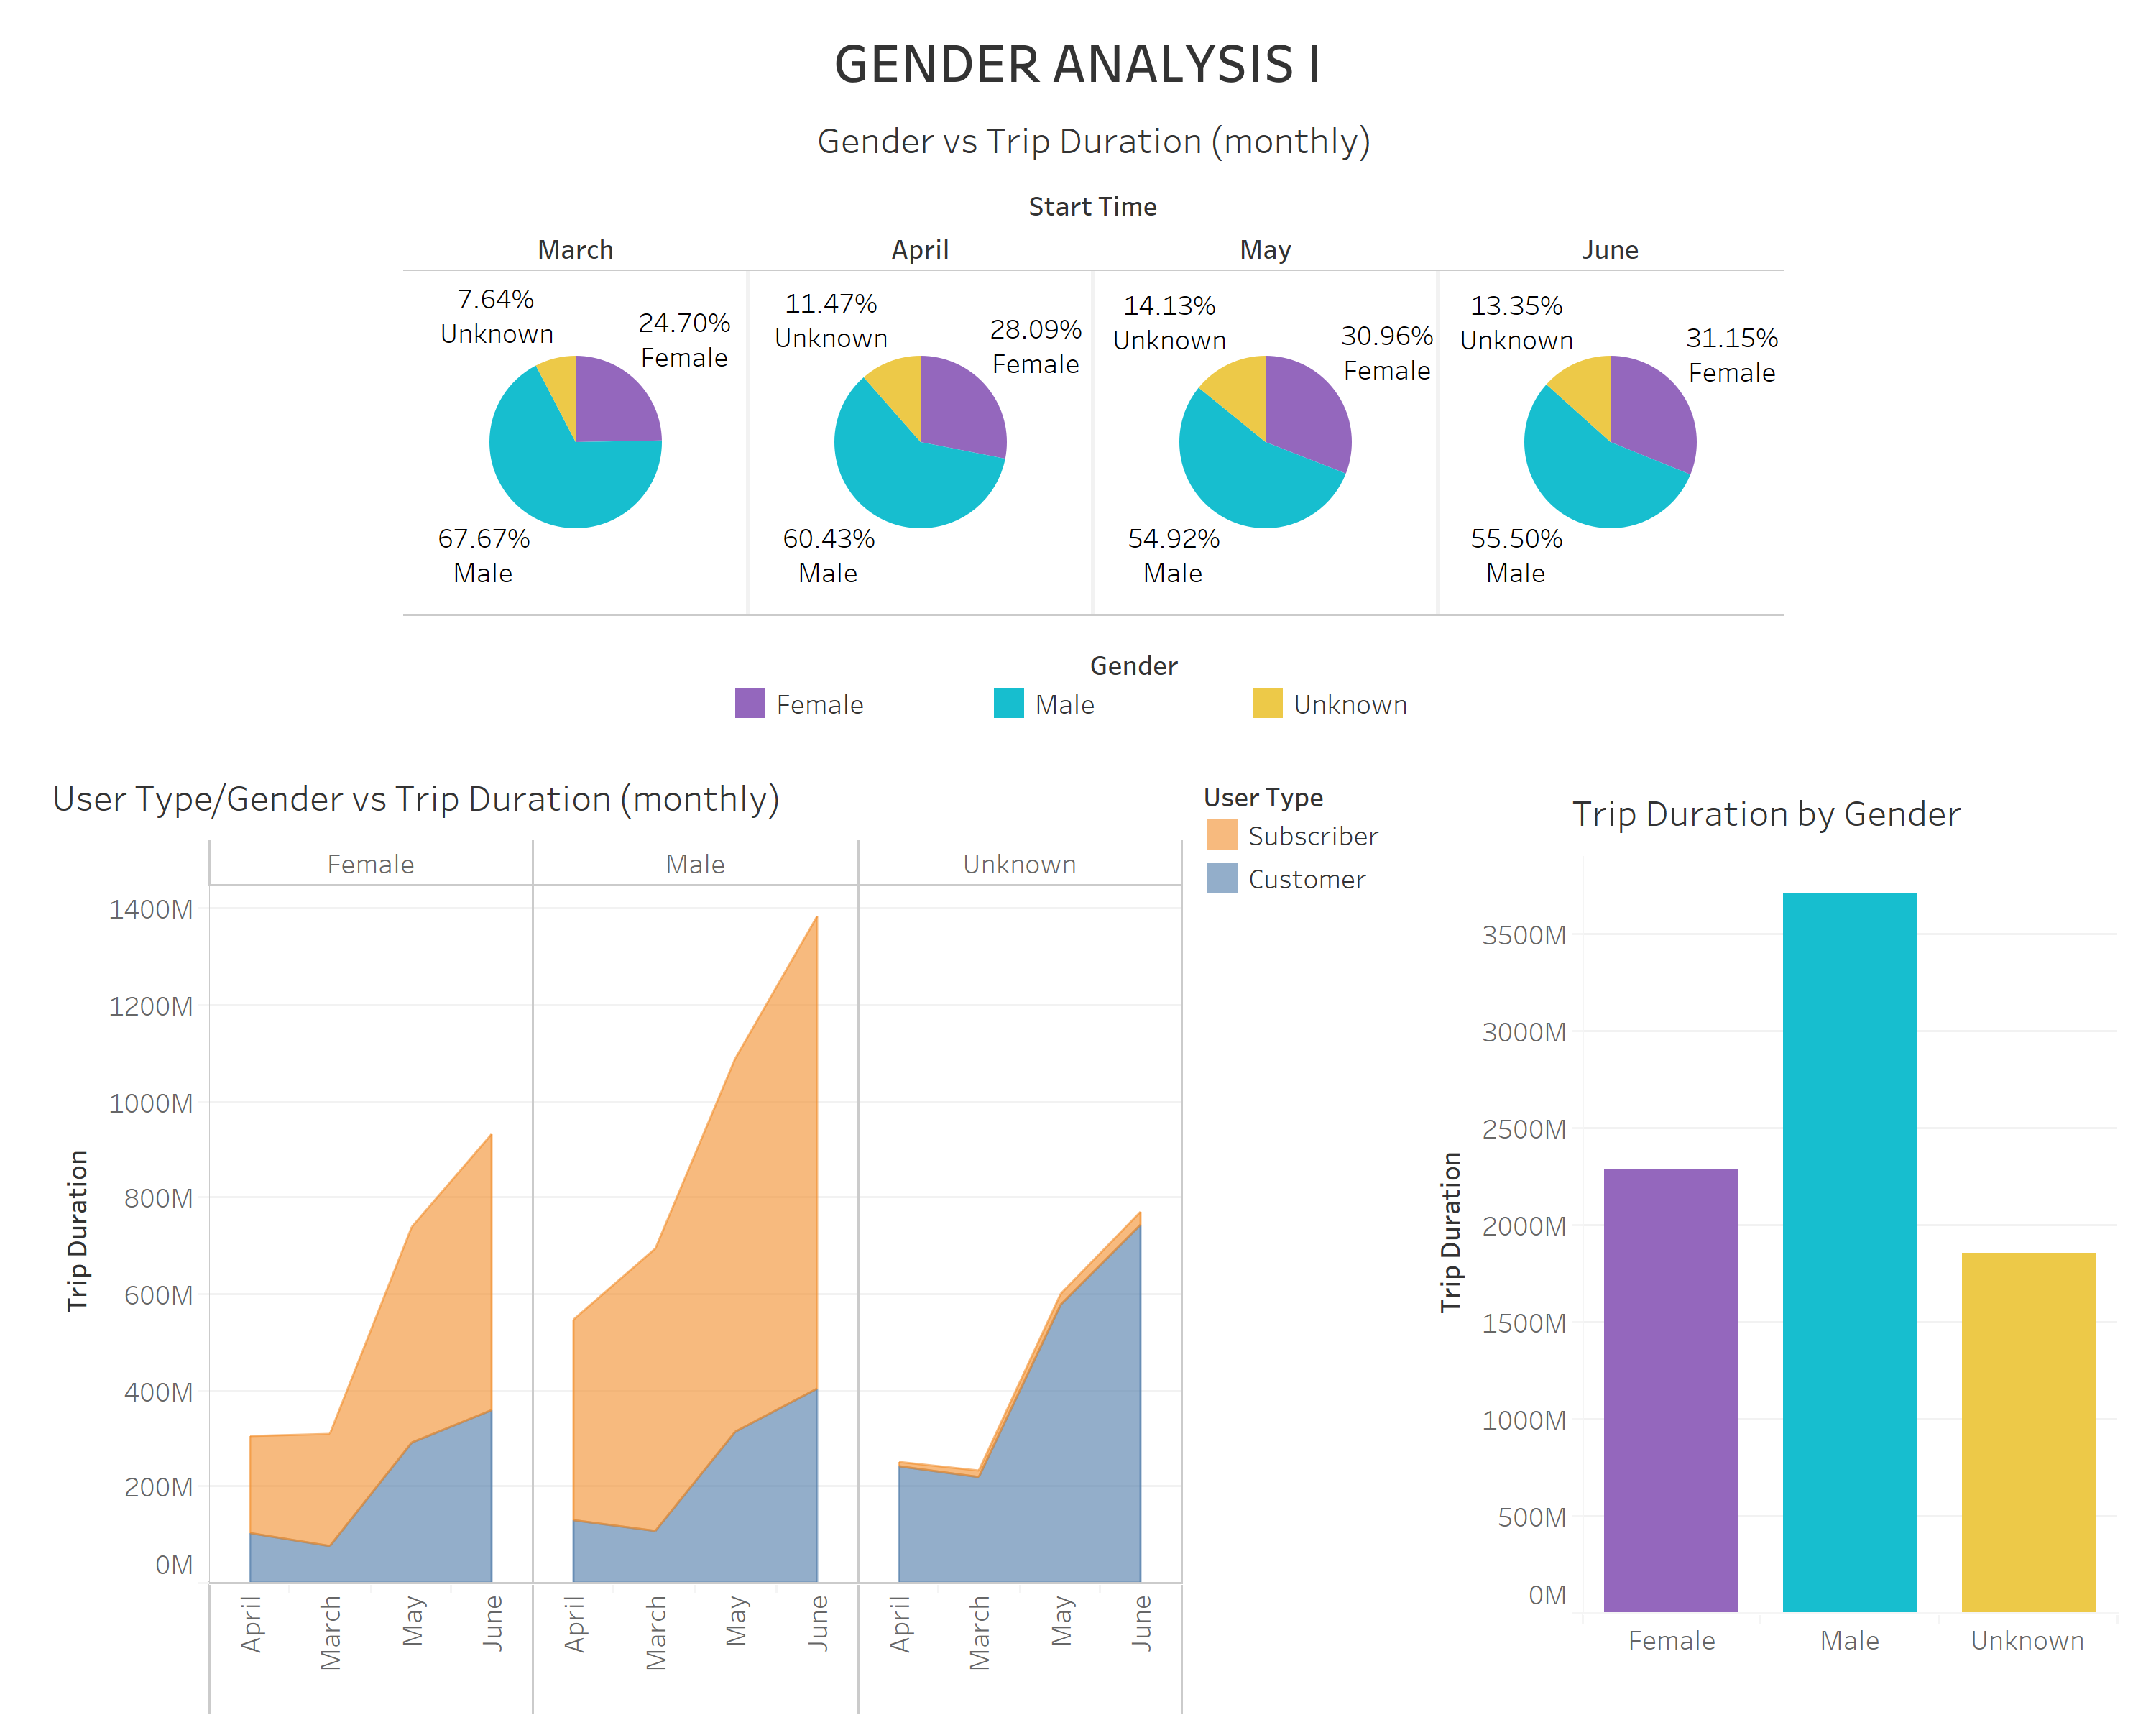
- Male has the longest trip duration for all 4 months during the lockdown.
- The trip duration of females and unknown slightly increased from March to June and slightly decreased for males.
- The lowest trip duration for all gender is during the month of April while the highest is during the month of June.
- Male and Female subscribers generally have longer trip duration than costumers.
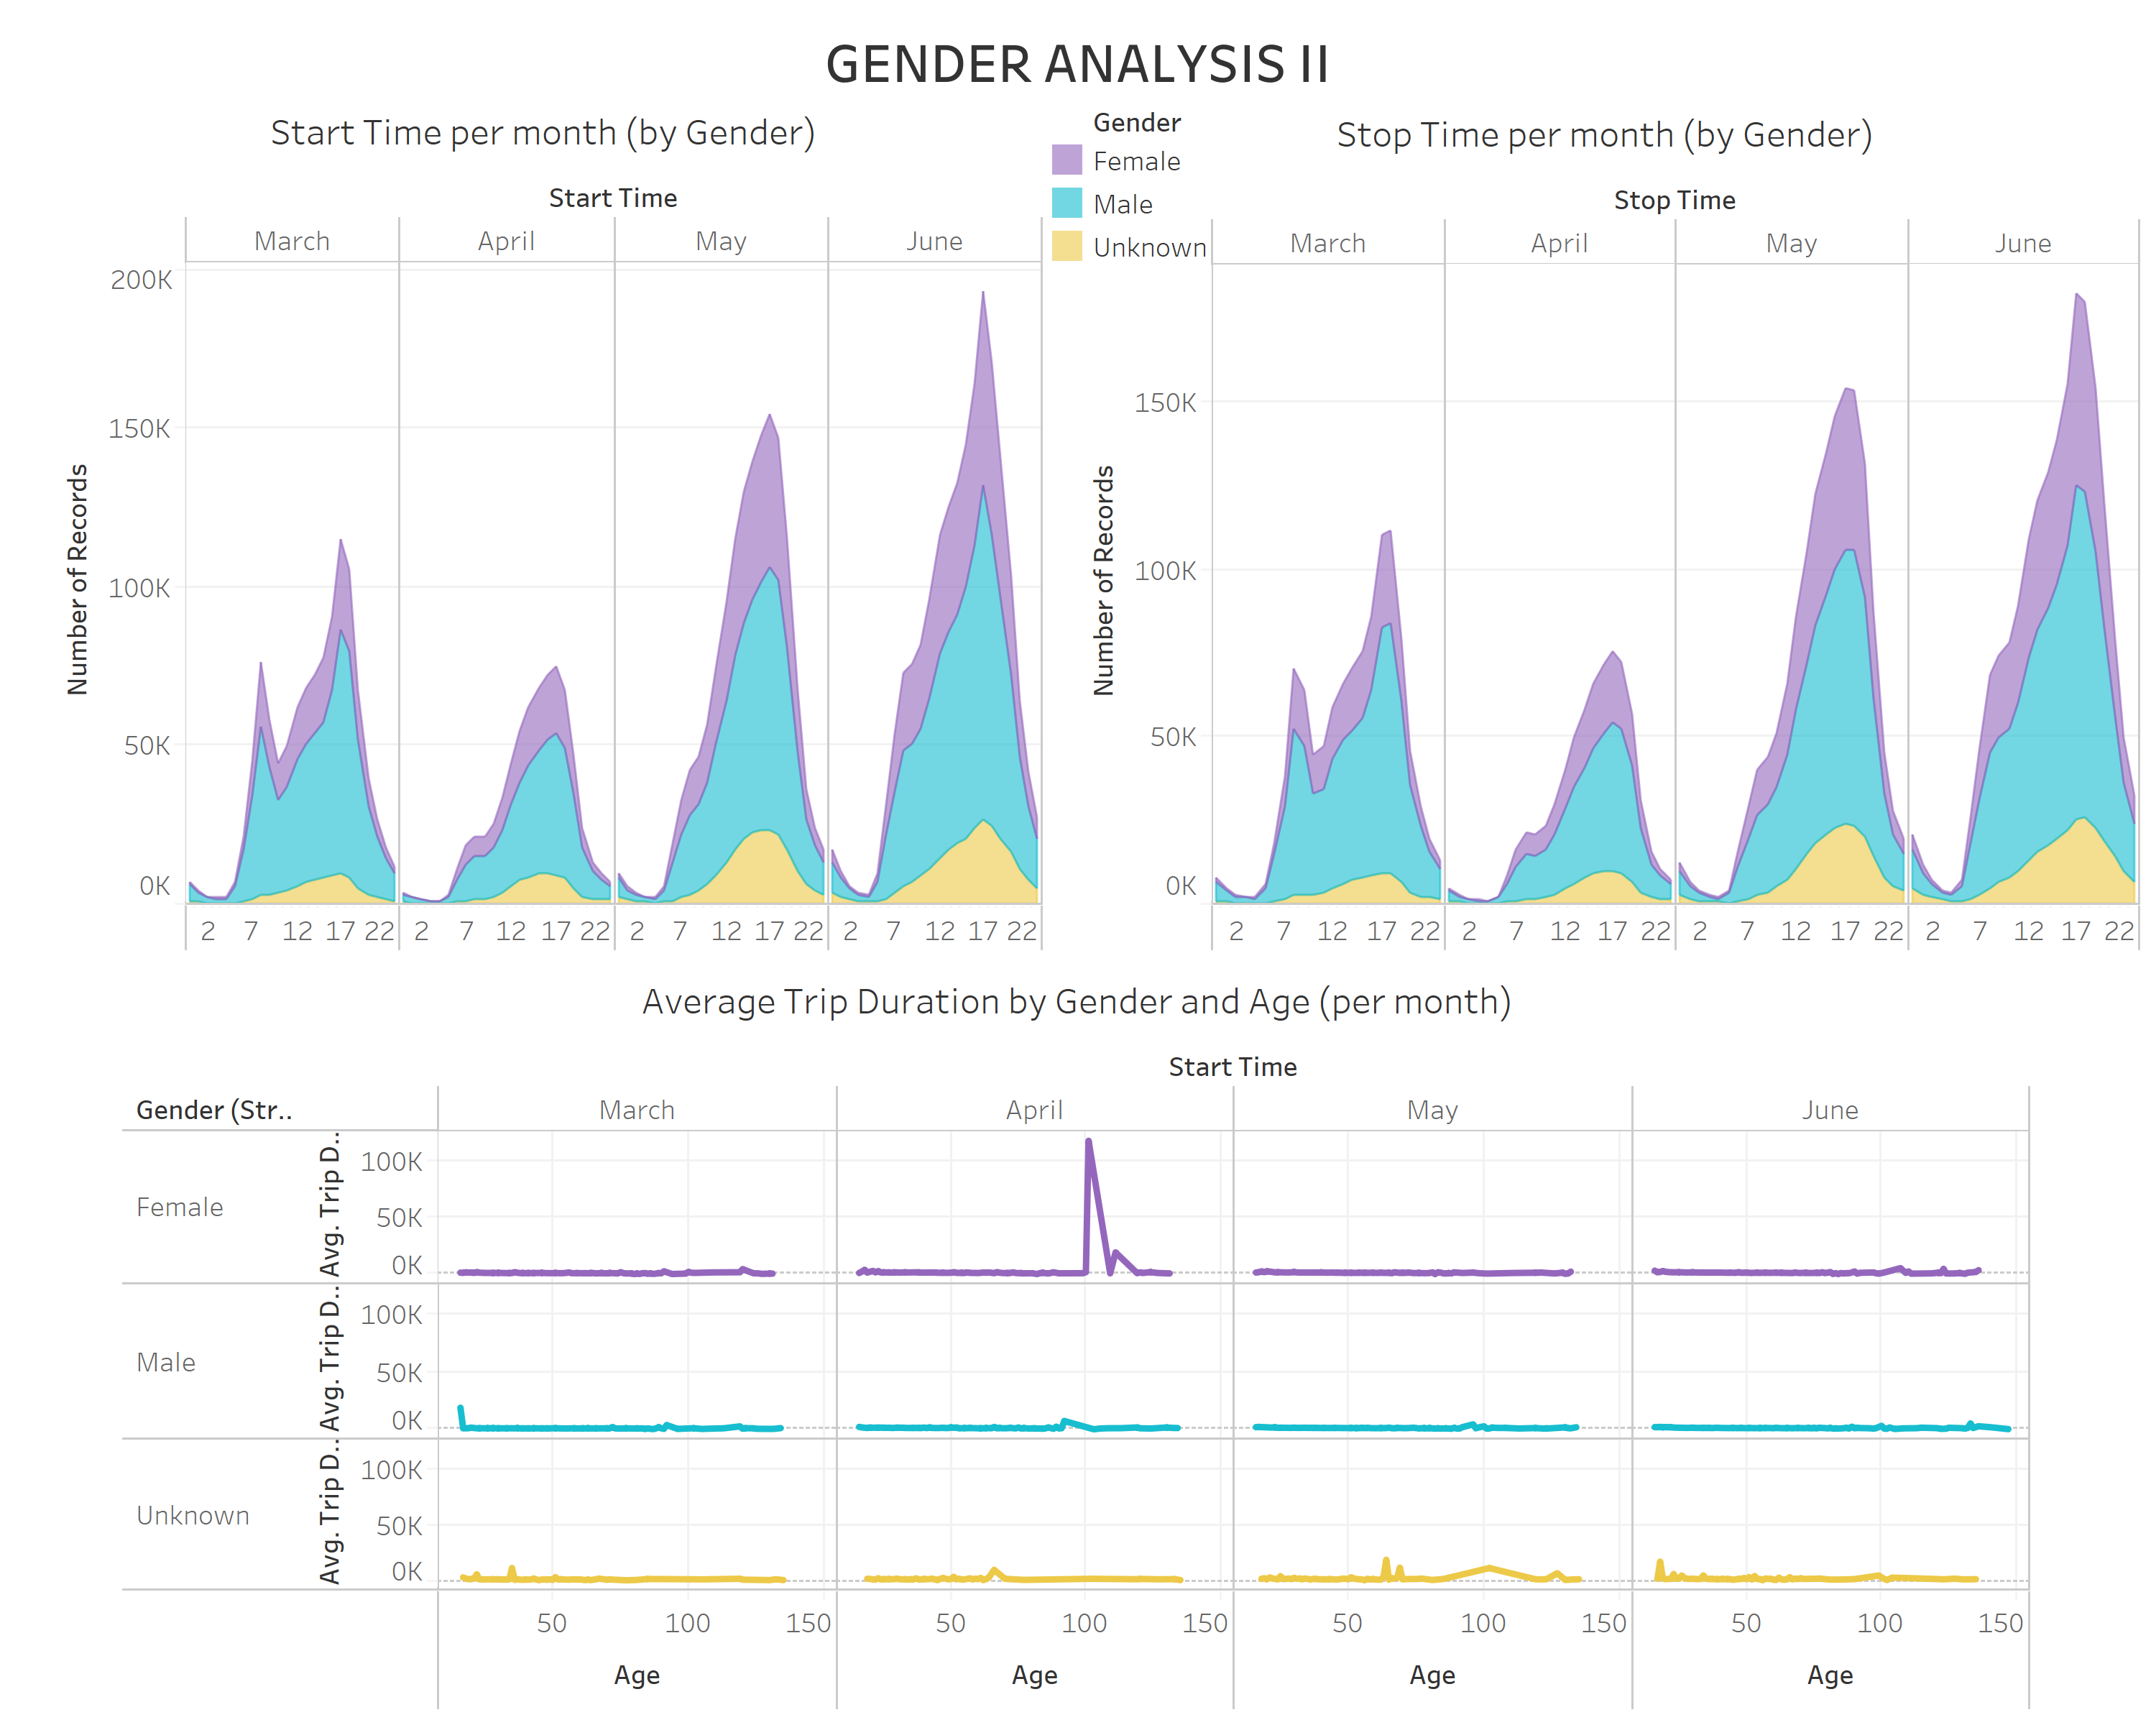
- The most popular start and stop time for all gender is 5:00 pm (17:00)
- The highest average trip duration for females was in the month of April at age 100-110, which can be determined as erroneous.
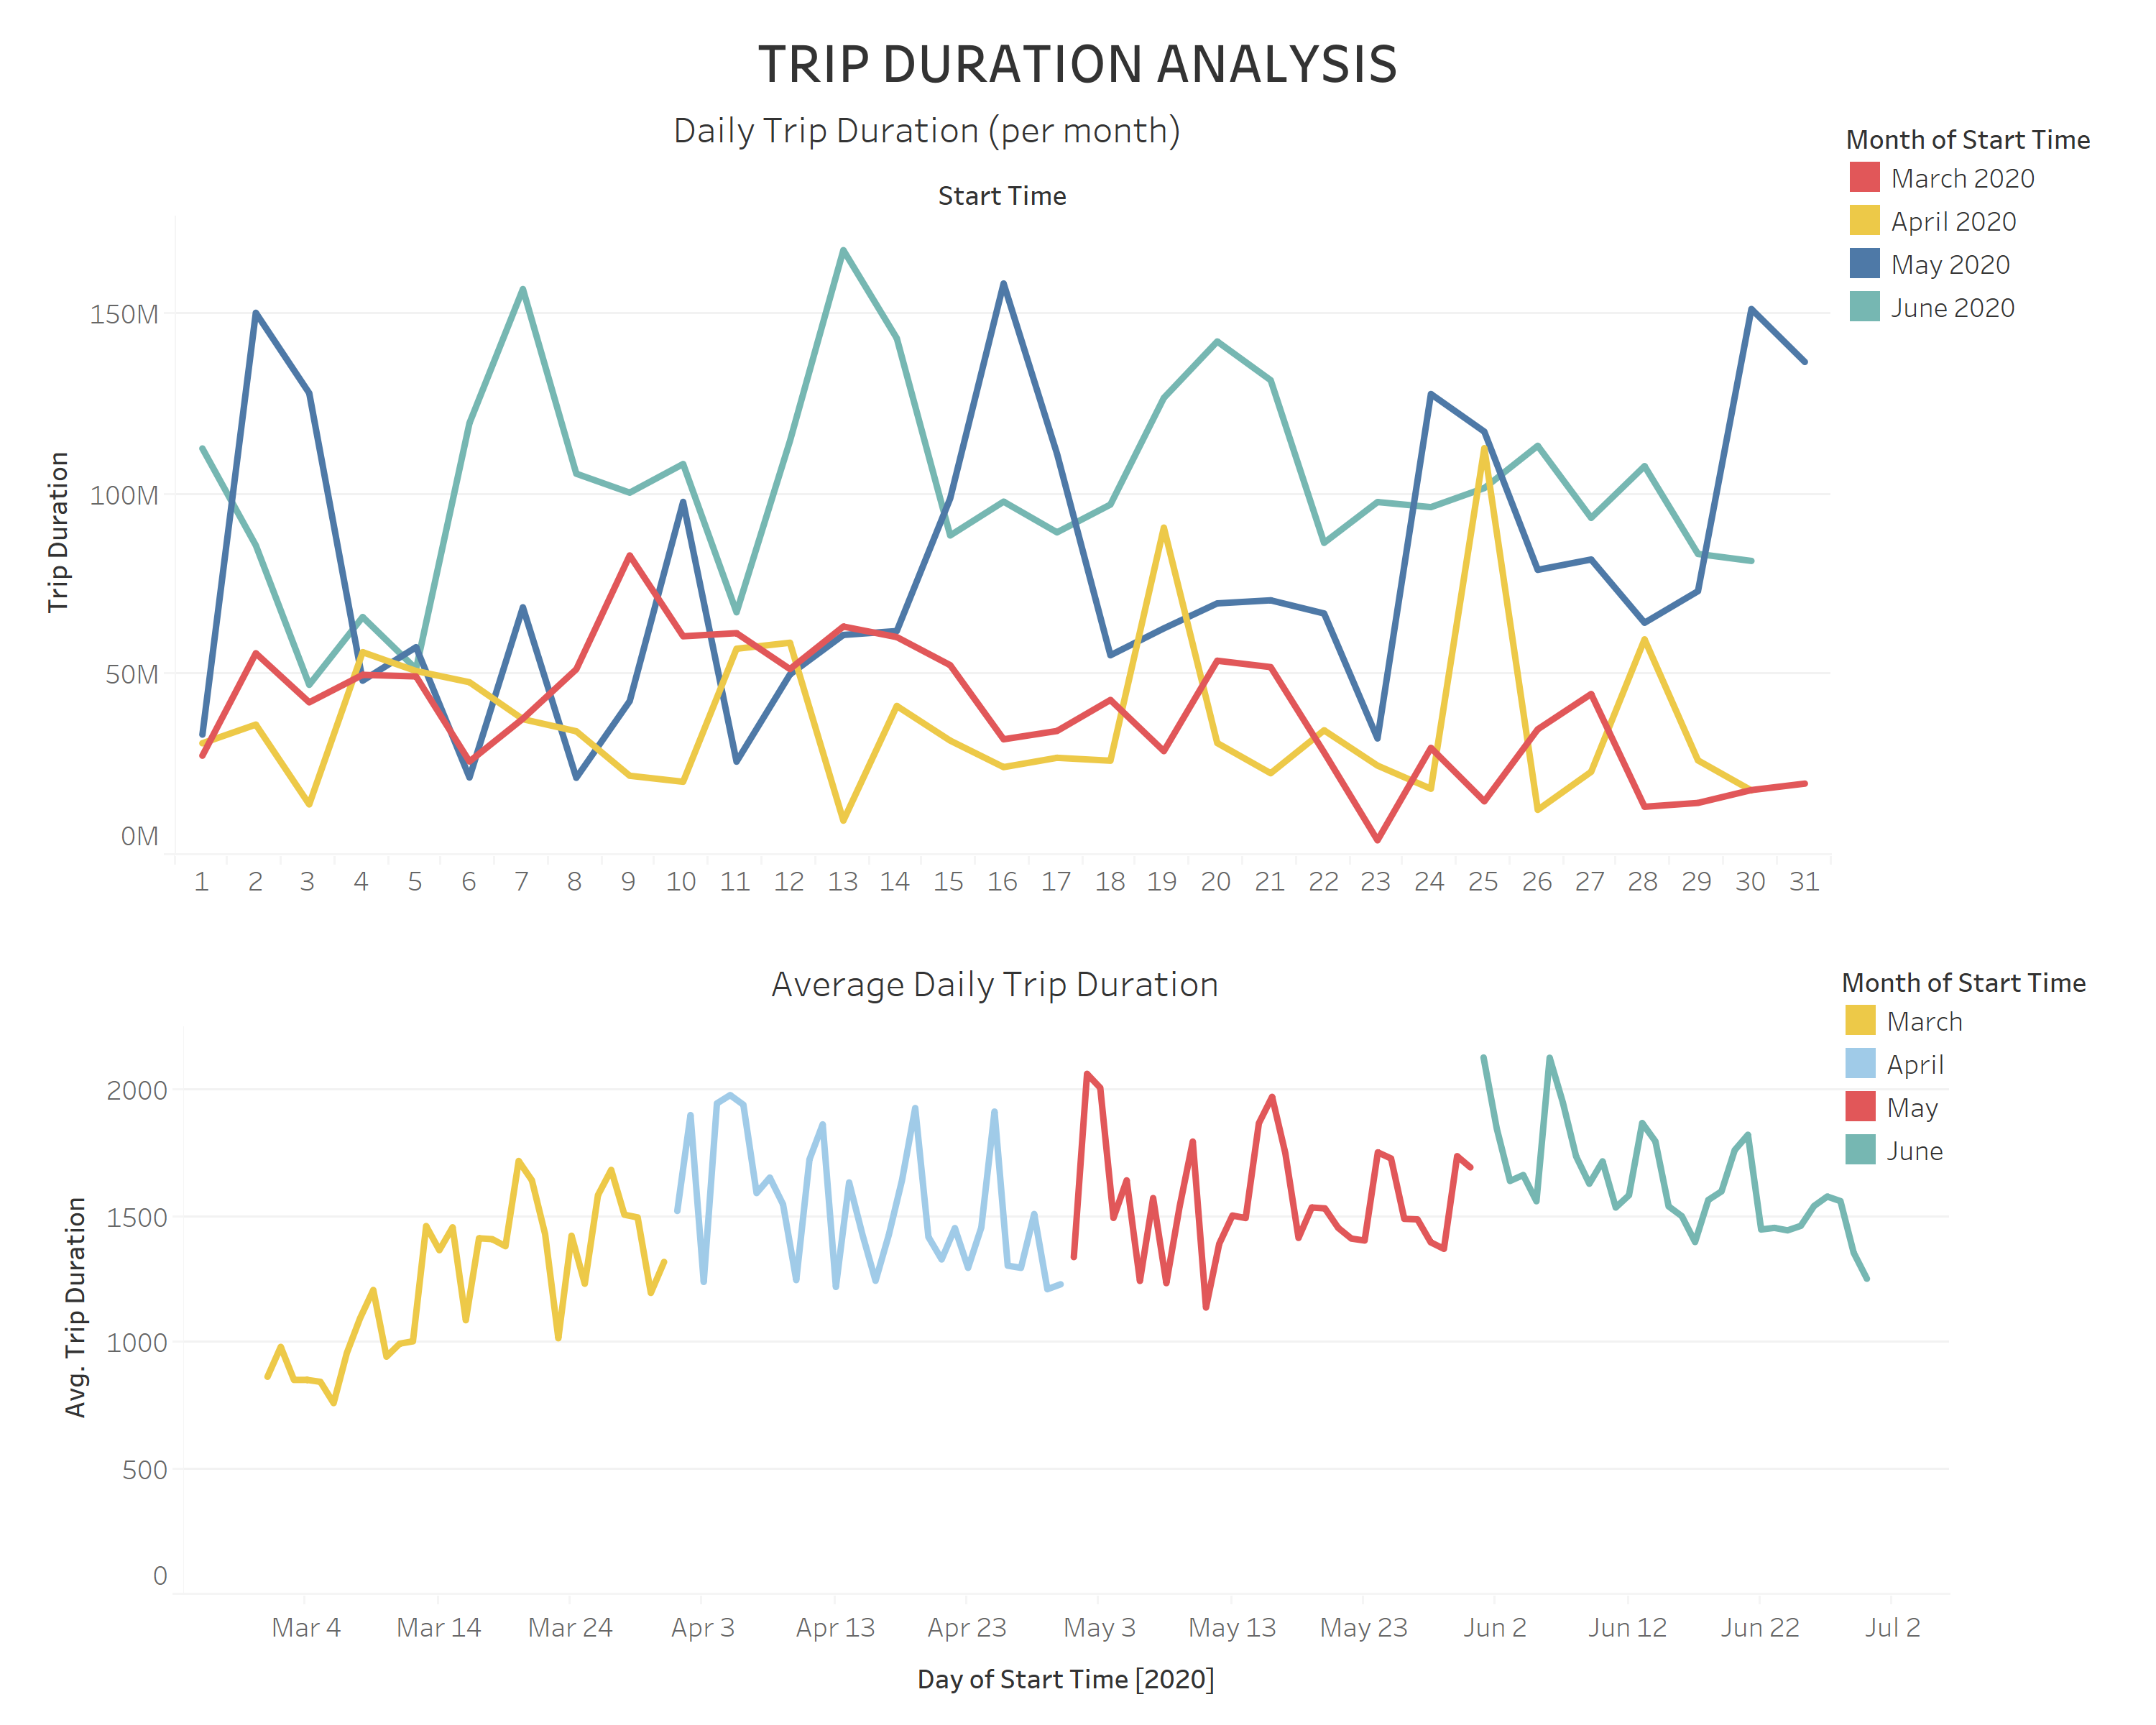
- May and June generally have higher trip duration than March and April.
- The highest trip duration recorded during the Covid-19 lockdown was on the 13th of June.
- The average trip duration appears to increase from the beginning until the end of March.
- There average trip duration for the month of June generally decreased.
- There average trip duration for all 4 months appear highly unsteady.
- There highest average trip duration occur at the beginning of May and June.
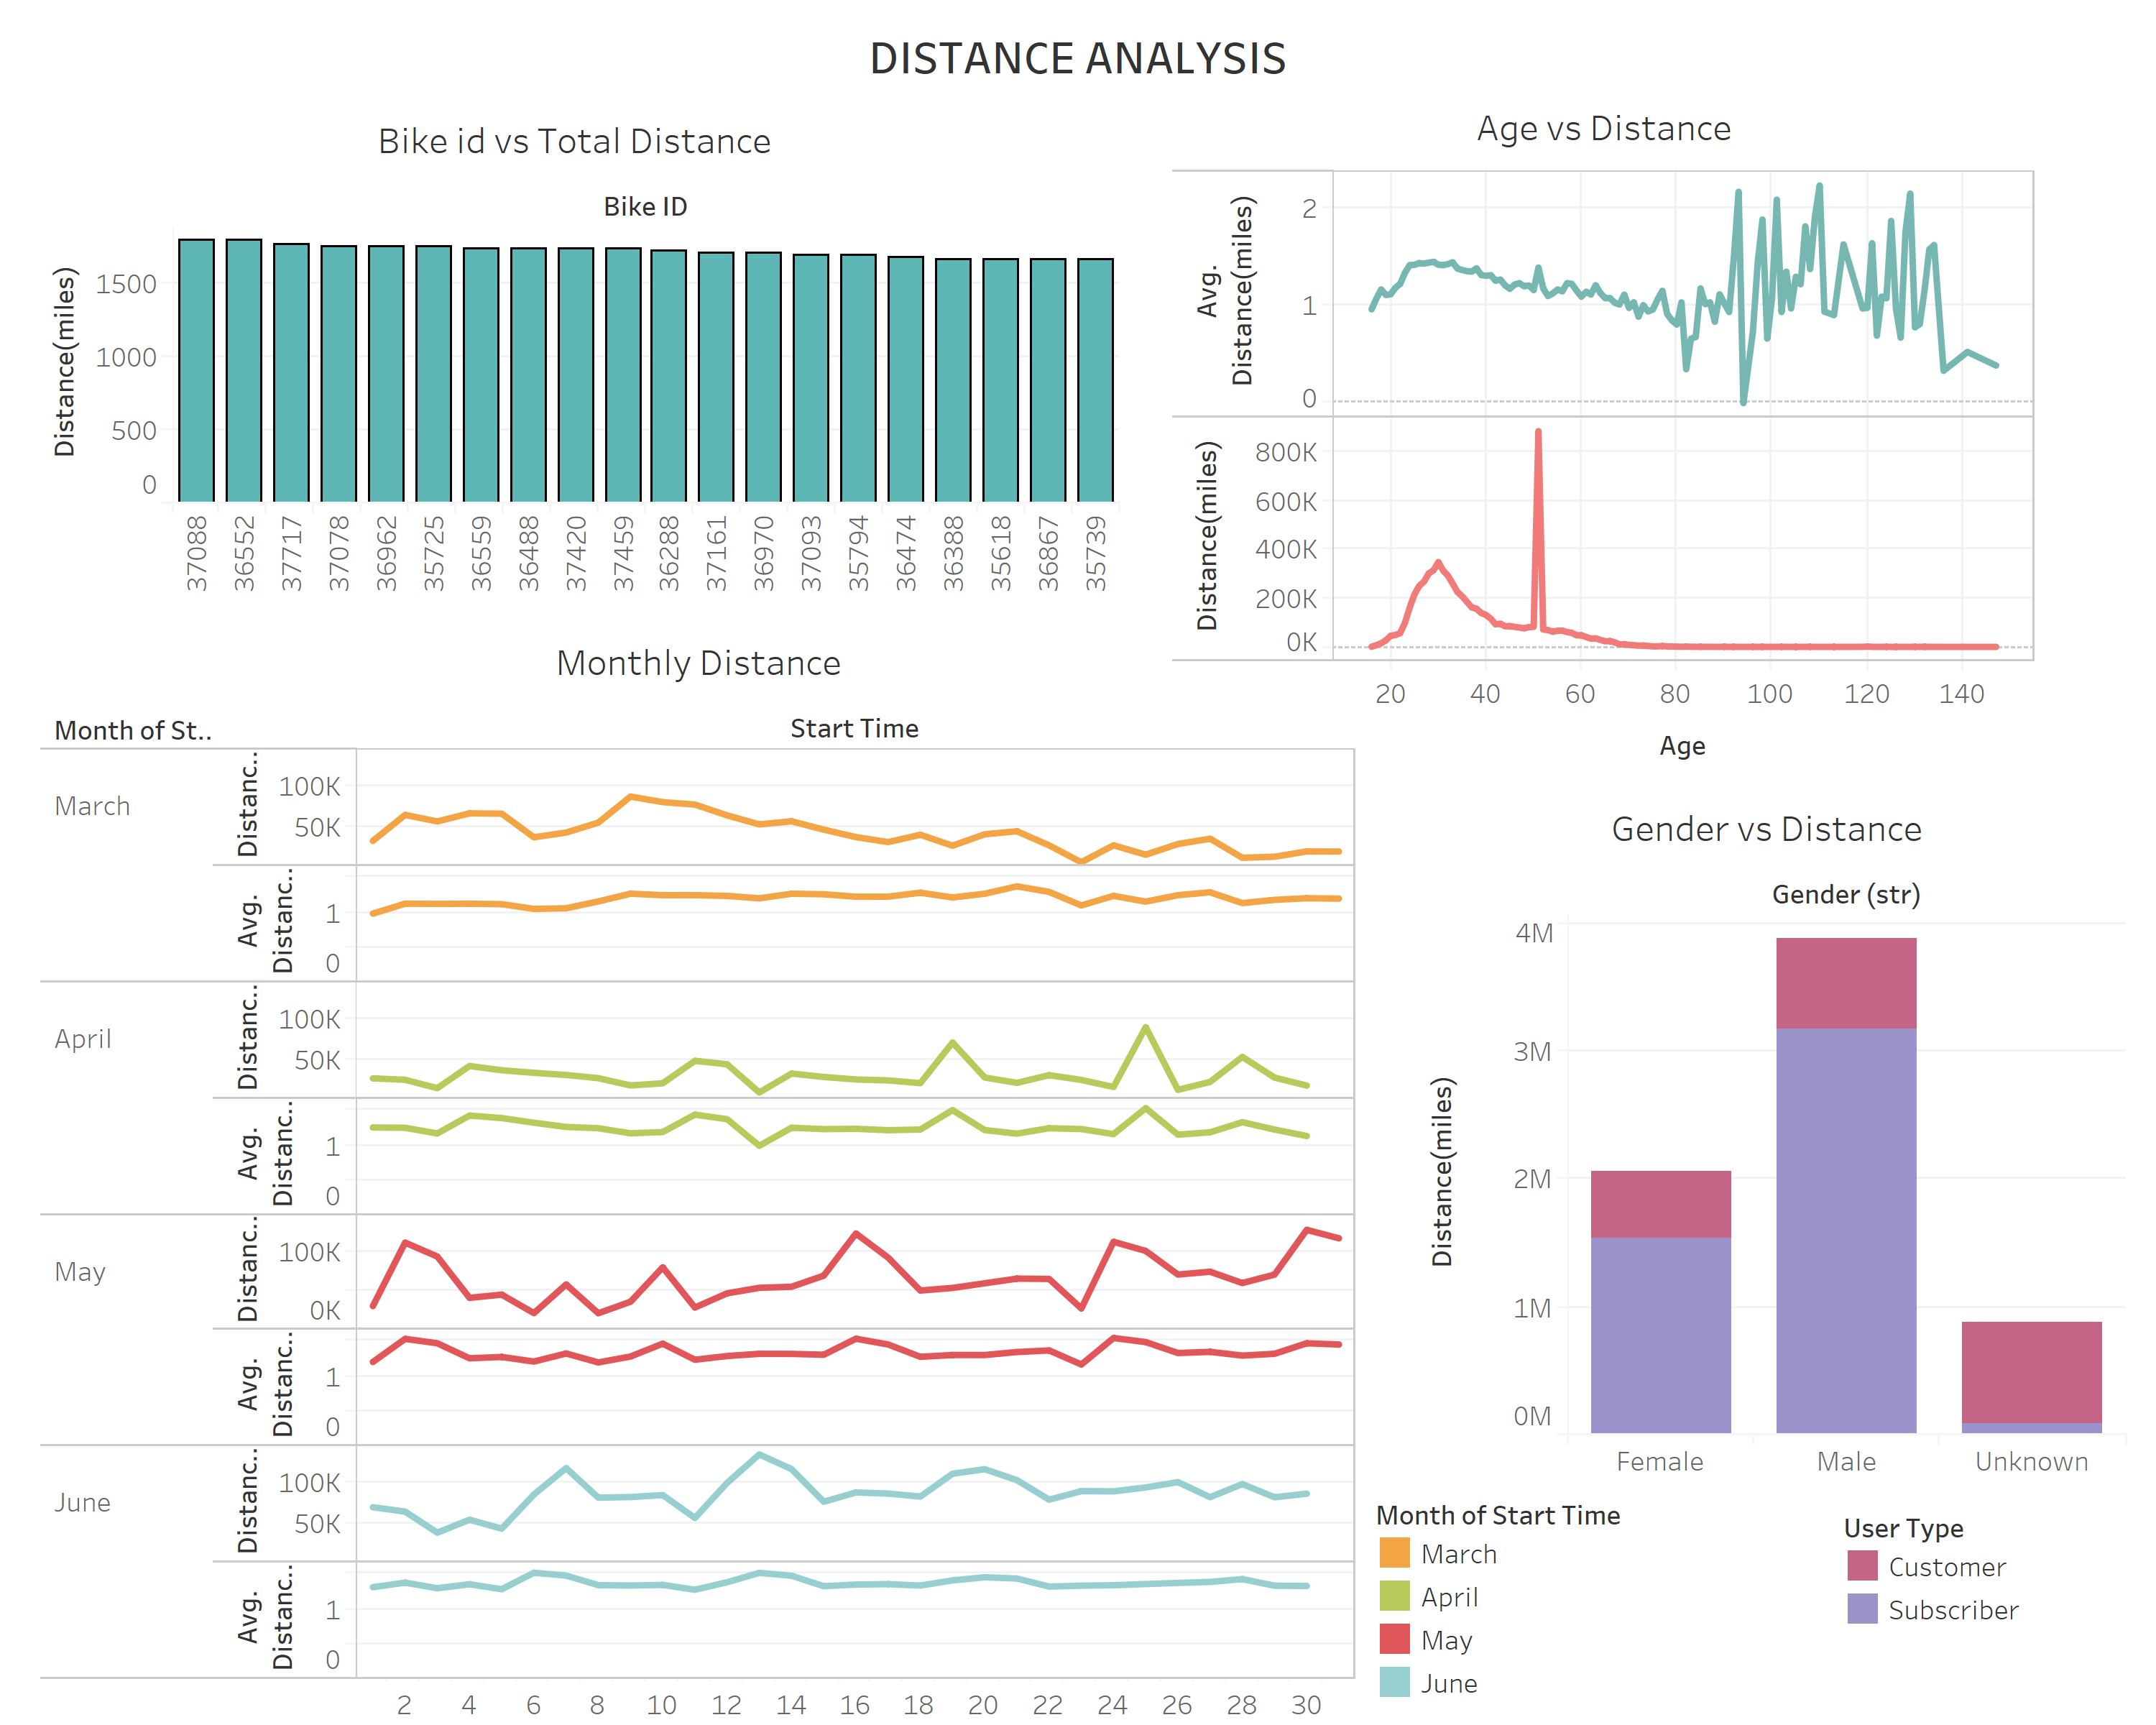
- Bike ID 37088 has the highest total distance traveled during the Covid-19 lockdown (March-June 2020).
- The total distance traveled is highest at age 50 followed by age 30.
- Subscribers have higher distance traveled than costumers for both male and female.
