This modified version only implements ad-hoc limited filters support for timelion queries
grafana-timelion-datasource 
ELK Timelion's data source for Grafana
Setup
Set the url for your ES server like: http://server:port/api/timelion (Same server where your Kibana instance is running)
Features
Query
Only query datasource feature is implemented.
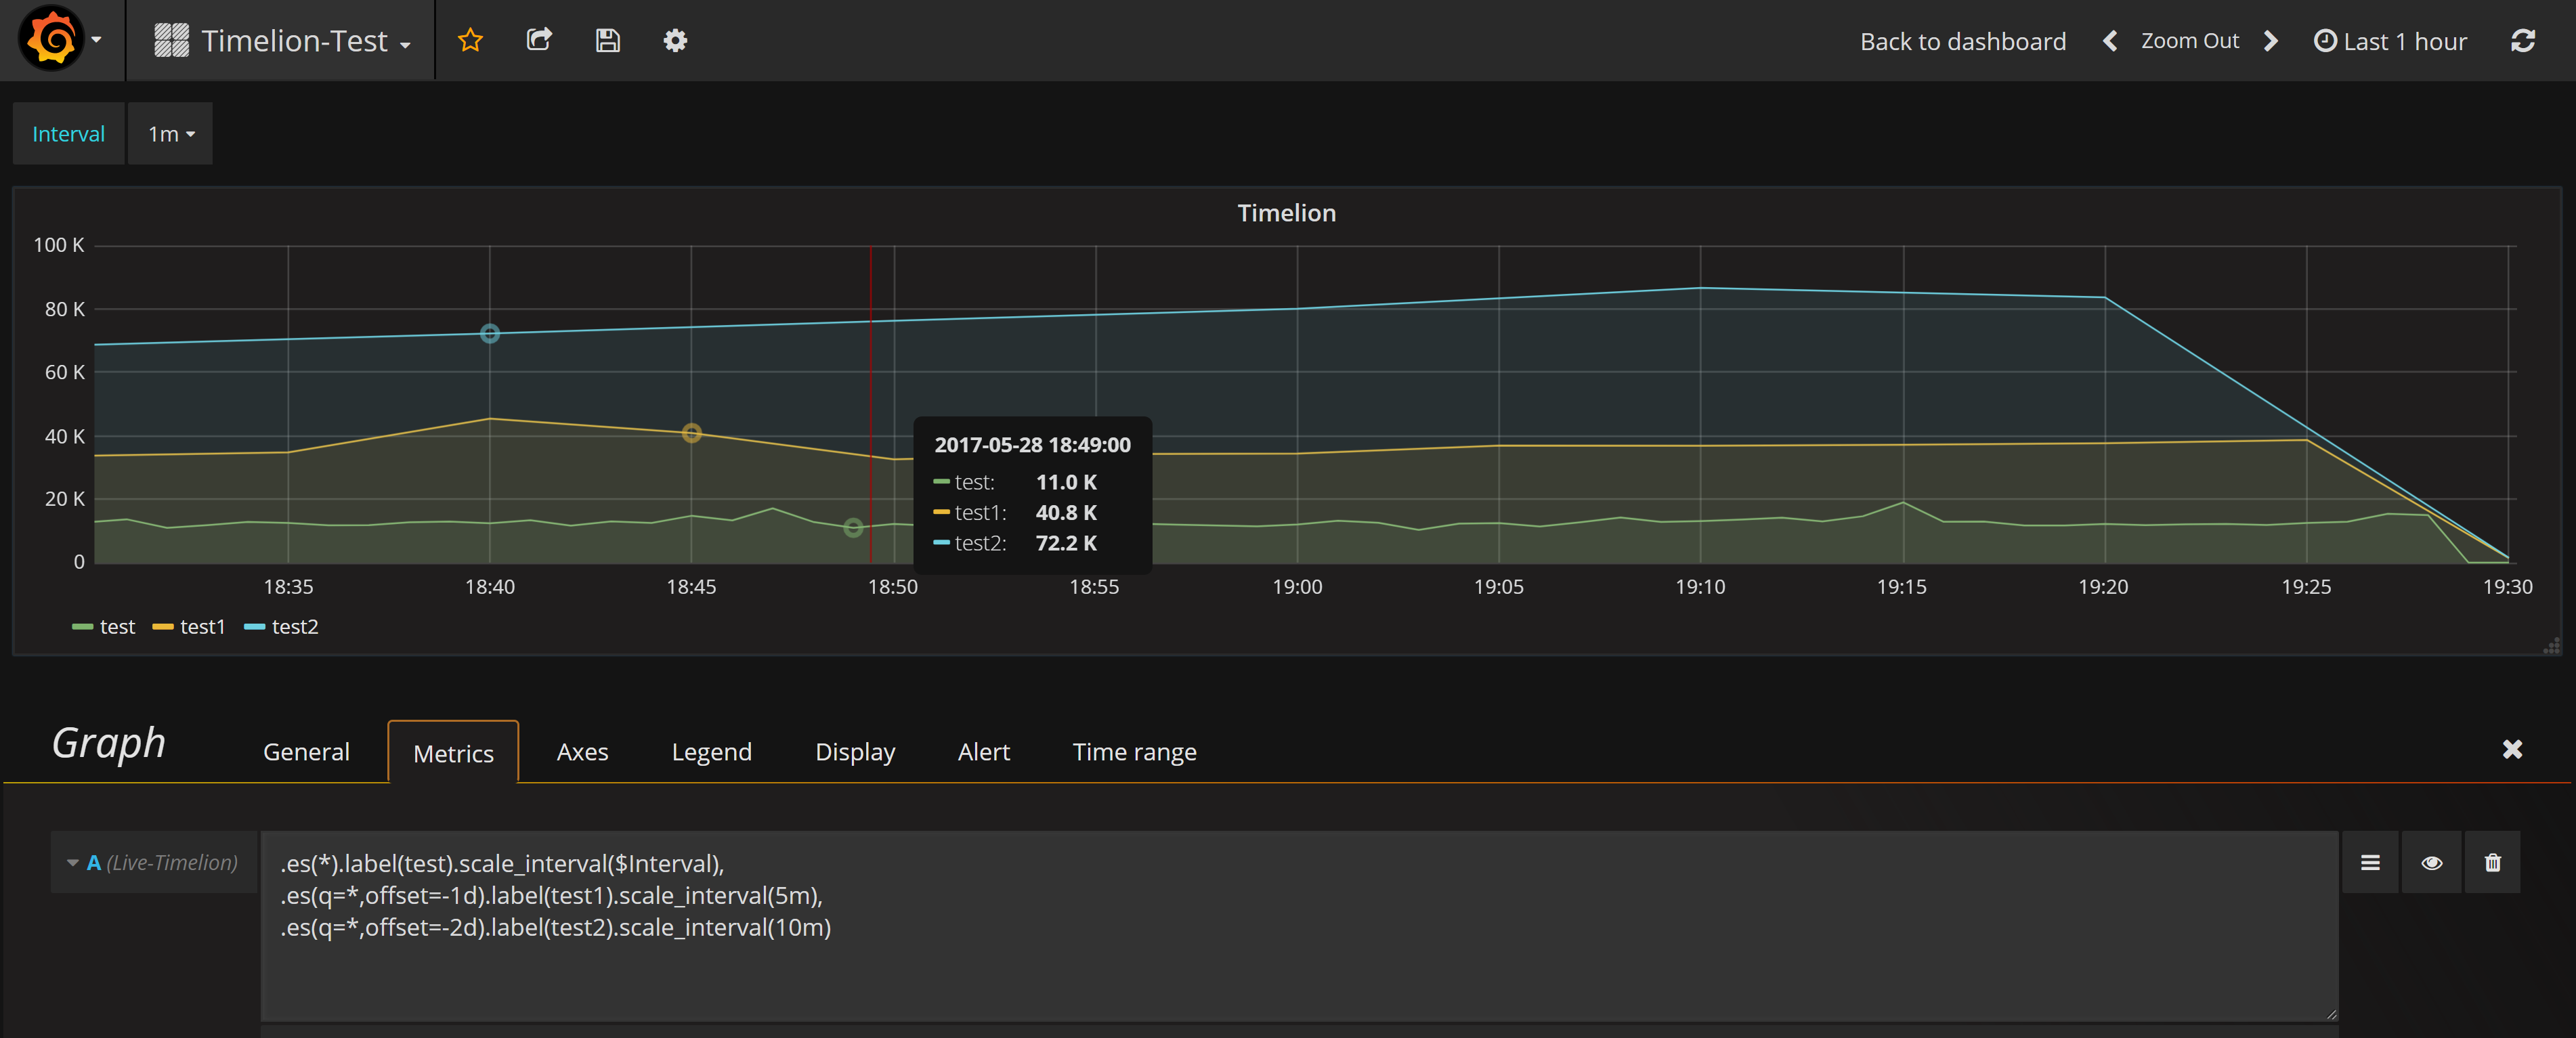
Multiple queries can be specified using same metric like: .es(*).label(metric1),.es(q=*,offset=1d).label(metric2)
Or defining multiple metrics.
Refer to Timelion's documentation for more details on writing queries: https://github.com/elastic/timelion/blob/master/FUNCTIONS.md
Labeling
Use the label() function to set the name of the metric
Interval
Use the scale_interval() function to specify metric interval. Grafana templating values are allowed
Variables
Starting with version 1.0.1 you can retrieve variables from Timelion labels.
Annotations
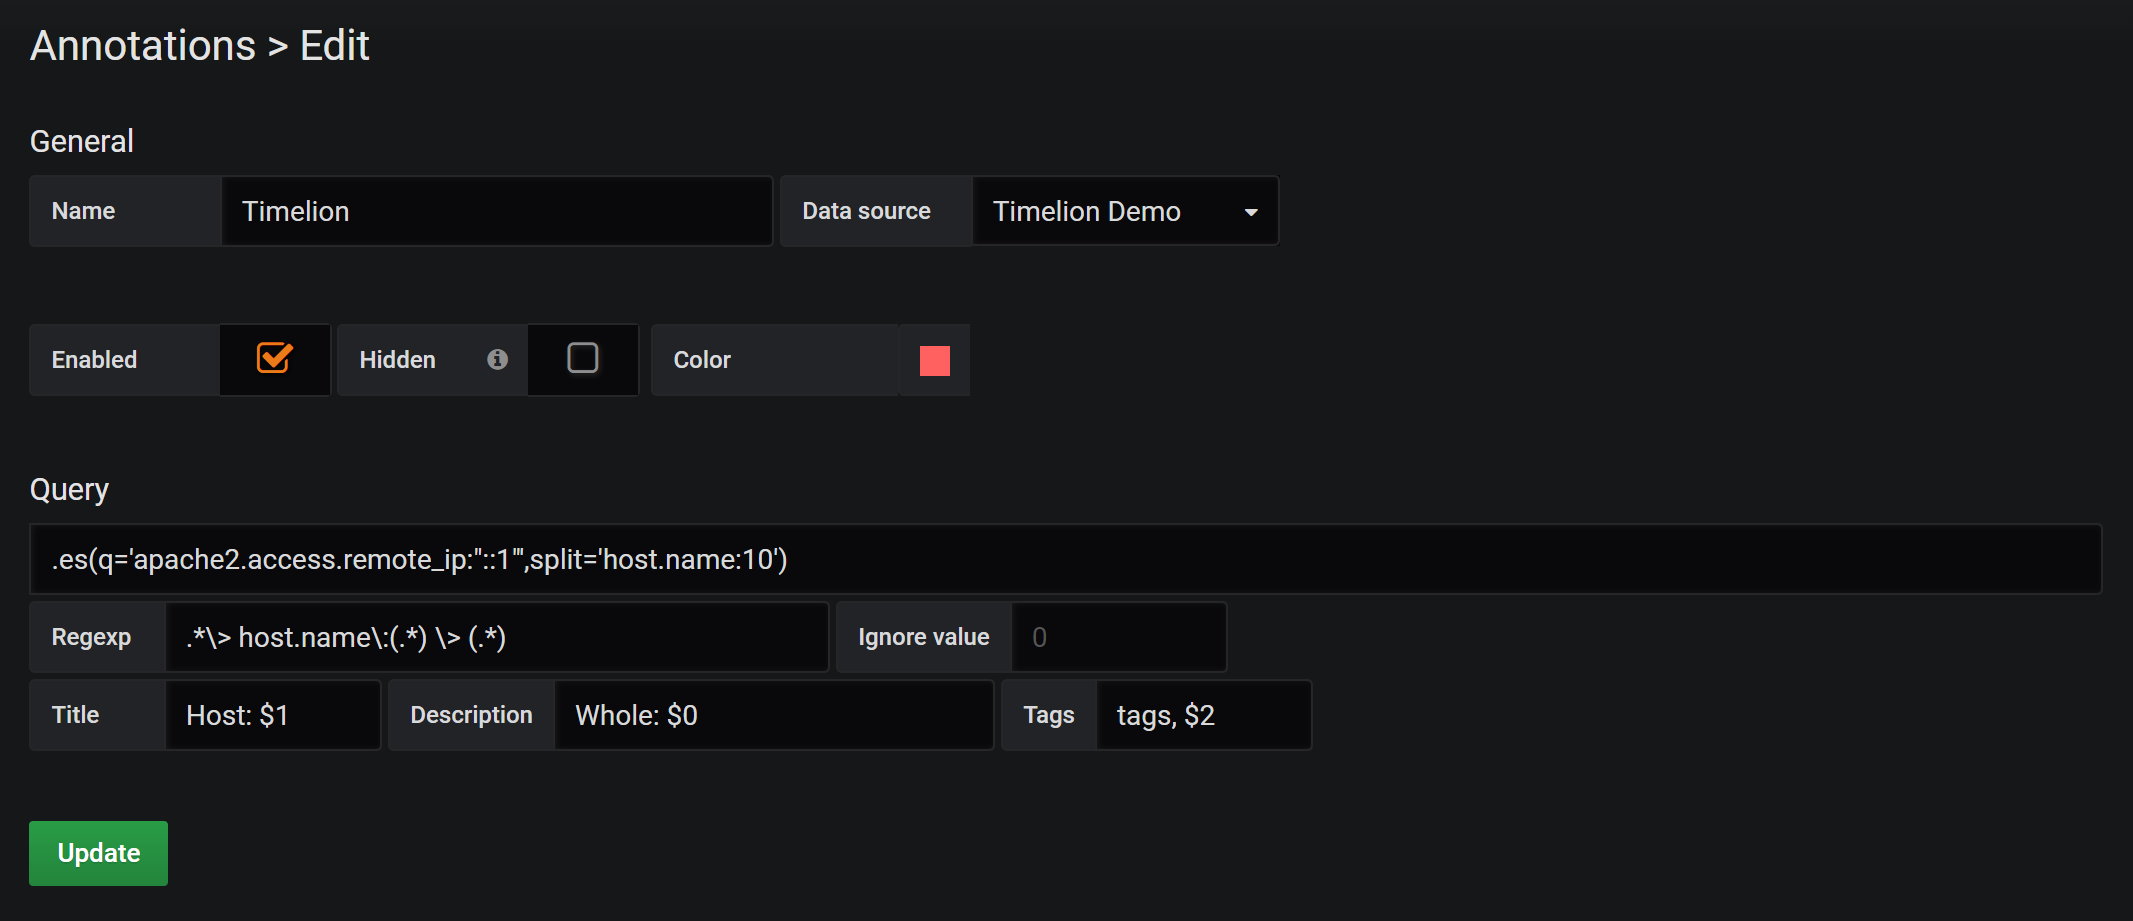
You can query annotations using Timelion as follow:
Notes:
- Data will be returned as
<label>: <value>exampleq* > host > count: 10 - Define a regexp to split label and use capture groups for: title, description, tags
- Timelion always returns a data point for each tick in the time range. Use
Ignore valueto discard invalid values. Default value is 0.
Screenshot
have fun!
Thanks to
Grafana team and @bergquist


